
The Dollar’s Share in 2035: Reserve Currency Scenarios for the Dollar, the Euro, the Renminbi and Gold

Driss EFFINA, PhD Independent Researcher, Global Strategy Files Foresight, prospective note No. 21, 24 October 2026. Reading time: about 55 minutes
Key takeaways
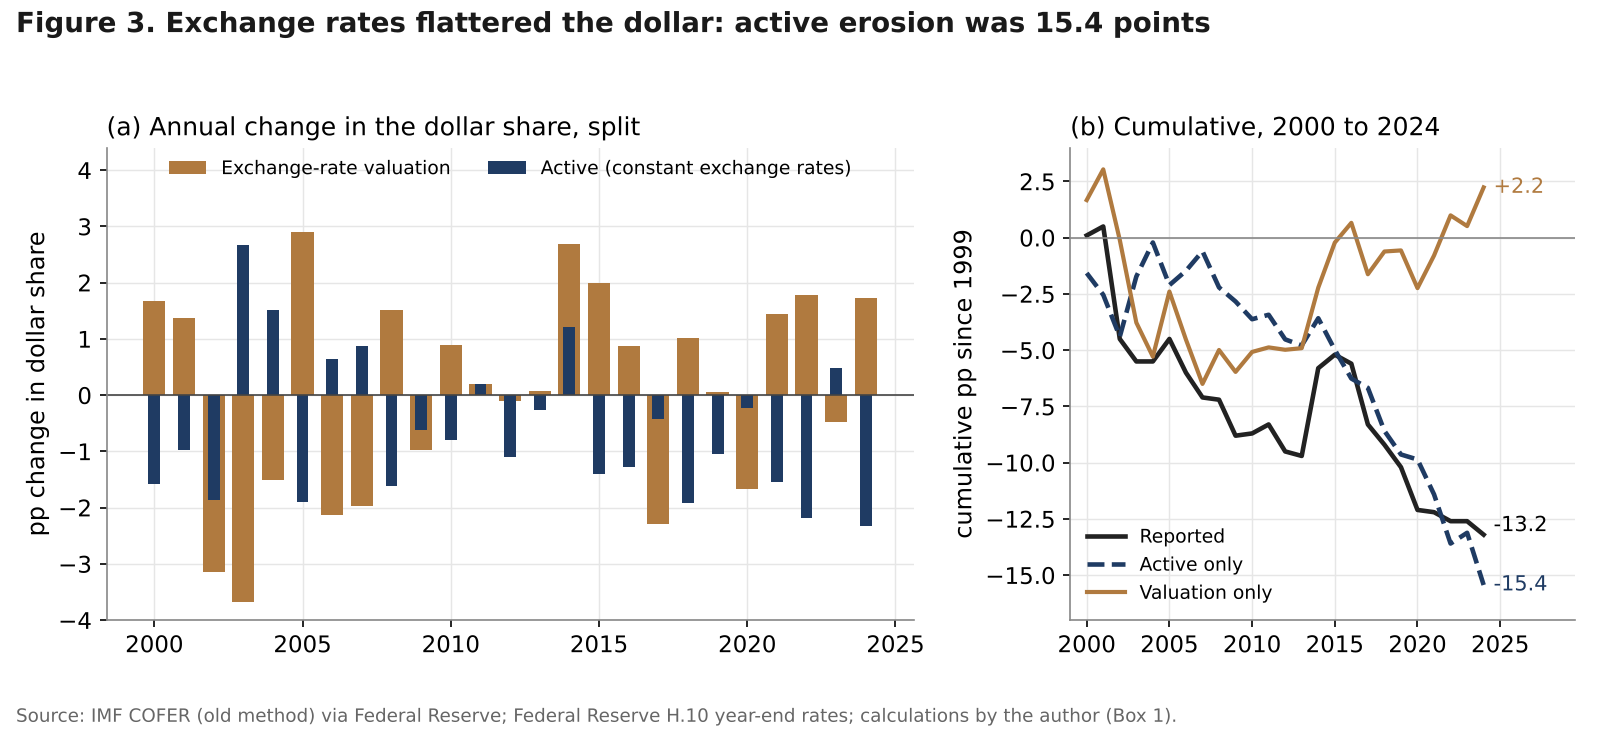
- The dollar held 56.70 percent of global FX reserves in mid-2026, down from 71.5 percent in 2001; at constant exchange rates the decline since 1999 is 15.4 points, and active erosion has averaged 1.16 points a year since 2016.
- Gold reached 27 percent of official reserves at the end of 2025, ahead of the euro; about 92 percent of its rise since 2015 came from price, and central banks bought 863 tonnes in 2025 and 345 tonnes in the first half of 2026.
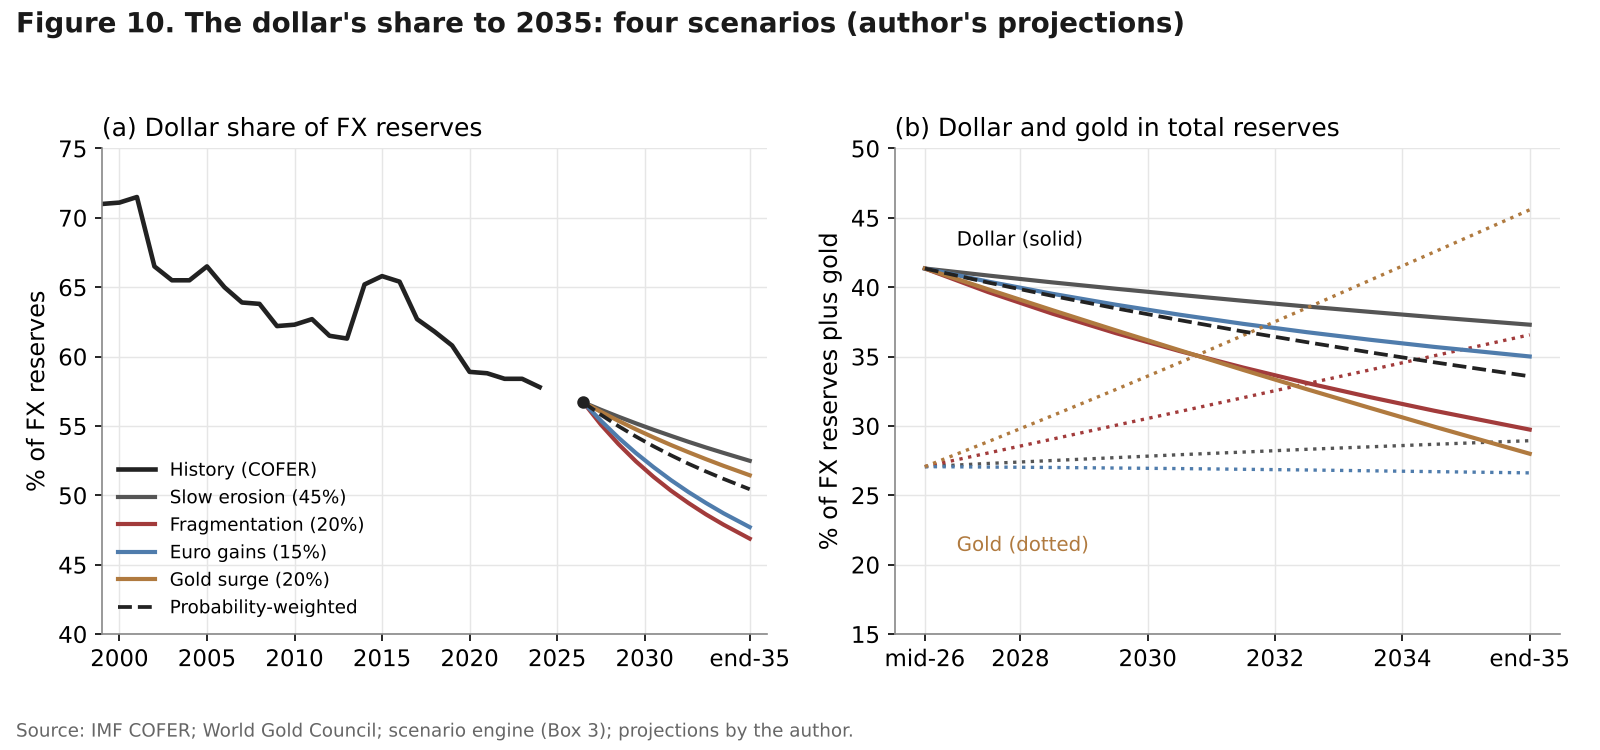
- In the author’s four scenarios the dollar keeps first place in 2035 with 46.9 to 52.5 percent of FX reserves (50.4 percent probability-weighted), but only 28 to 37 percent of reserves once gold is counted.
- Lost official demand and a thinner convenience yield add 13 to 60 basis points to Treasury yields by 2035 (29 probability-weighted, about 170 billion dollars a year); Europe gains only if it supplies more joint debt, and Canada gains most among small currencies.
Abstract
At the end of June 2026 the world’s central banks held 13.22 trillion dollars of foreign exchange reserves, and 56.70 percent of them were in US dollars, according to the IMF’s latest COFER release of 30 September 2026. The euro held 20.60 percent, the yen 4.96 percent and the renminbi 2.11 percent. Twenty-five years earlier the dollar’s share was 71.5 percent. Over the same period a reserve asset with no issuer, gold, went from below 10 percent of official reserves in 2015 to 27 percent at the end of 2025 on the ECB’s count, more than the euro and more than US Treasury securities. Two questions follow. How far will the dollar’s share fall by 2035, and who will take what it loses? And what does the answer cost or bring to the United States, the euro area, Canada and the United Kingdom?
This note answers with numbers. It splits the dollar’s past decline into exchange-rate valuation and active reallocation; estimates how much economic size and network inertia explain; scores six drivers for six currencies and gold; maps who sold and bought Treasuries in the year to August 2026; and builds a scenario engine for the composition of reserves to 2035 under four scenarios with probabilities: slow erosion, fragmentation, euro gains and gold surge. Each scenario is translated into US Treasury yields, demand for euro safe assets, and Canadian dollar and sterling reserve holdings. A dashboard of twelve indicators and a dated calendar close the note. All projections and probabilities are the author’s.
Keywords: reserve currency, US dollar, euro, renminbi, gold, central bank reserves, COFER, Treasury securities, sanctions, network effects, exorbitant privilege, Canada, United Kingdom
JEL codes: F31, F33, E58, G15, H63
Key findings
1. The dollar’s decline is larger than the headline, and it is speeding up. The reported share fell 13.2 percentage points between 1999 and 2024, but 15.4 points at constant exchange rates: a strong dollar added 2.2 points. Active erosion averaged 0.62 point a year over 2000 to 2024 and 1.16 points a year over 2016 to 2024. The euro’s gain since 1999 is entirely a valuation effect. 2. Size explains little, inertia a lot. Across 1999 to 2023 one point of US share in world output goes with 0.81 point of reserve share, but the projected fall in the US share of world GDP to 2035 lowers the dollar’s share by only 0.39 point. The persistence of the dollar’s share (0.916 a year in logit terms) implies a half-life of about eight years: only 57 percent of any shift that reserve managers want is visible by the end of 2035. 3. Gold is the dollar’s real competitor, and price did most of the work. Gold’s share of official reserves rose from 9.1 percent in late 2015 to 27 percent at the end of 2025. Ounces held rose 9.8 percent and the price 177 percent, about 92 percent of the rise in value. Central banks bought more than 1,000 tonnes a year in 2022 to 2024, 863 tonnes in 2025 and 345 tonnes in the first half of 2026. 4. In 2035 the dollar is still first in every scenario, but it holds about a third of all reserves once gold is counted. In the author’s scenarios the dollar’s share of foreign exchange reserves at the end of 2035 is 52.5 percent in slow erosion (probability 45 percent), 46.9 percent in fragmentation (20 percent), 47.7 percent in euro gains (15 percent) and 51.5 percent in gold surge (20 percent); 50.4 percent probability-weighted, with a 35 percent probability of falling below half. Counting gold, the dollar’s share of reserves falls from 41.4 percent in mid-2026 to between 28.0 and 37.3 percent, and gold’s rises to between 26.6 and 45.6 percent. The euro peaks at 25.6 percent and the renminbi at 5.4 percent. 5. The cost to the United States is real but second-order next to its fiscal path; the gains for others depend on supply. Lost official demand and a smaller convenience yield add 13 to 60 basis points to Treasury yields by 2035, 29 basis points probability-weighted, or about 170 billion dollars a year on 58 trillion dollars of marketable debt, 8 percent of the interest bill the CBO projects for 2036. Euro reserves already equal 45 percent of the supply of core euro safe assets; in the euro-gains scenario they would add 0.88 trillion dollars, which Europe can absorb only if joint debt grows. Canada gains most among small currencies, with reserves in Canadian dollars rising from 344 billion dollars to 470 to 560 billion; sterling’s share barely moves.
1. Introduction: a share, not a throne
Debates about the dollar run to extremes: one camp reads every gold purchase or new payment system as the end of dollar dominance, the other points to the dollar’s 89 percent presence in foreign exchange trades. Both usually skip the arithmetic. A reserve currency is a share of a portfolio held by about 150 central banks and governments, and it moves slowly, through valuation, through flows, and through changes in who holds reserves. The relevant question for 2035 is not whether the dollar is “replaced” but how large its share will be, who gains the difference, and what that does to borrowing costs and exchange rates.
The question is more pressing in 2026 than it was five years ago, for four reasons. First, the immobilisation of about 300 billion dollars of Russian central bank reserves in 2022, and the European Union’s decision of 12 December 2025 to keep its share of them frozen indefinitely, turned seizure risk from a theory into a precedent. Second, the US fiscal position has worsened: the CBO’s February 2026 baseline projects federal debt held by the public at 120 percent of GDP in 2036, and Moody’s removed the last AAA rating of the United States on 16 May 2025. Third, gold has become the fastest-growing reserve asset, mostly because of its price, which peaked at 5,539 dollars an ounce on 29 January 2026 before falling to 4,010 dollars on 23 October. Fourth, the euro area has started to build the instruments that a reserve currency needs: EU bonds outstanding reached 849 billion euros in September 2026, and the ECB speaks openly of a “global euro moment”.
This note does not revisit how the dollar traded during the 2026 war involving Iran (Decoded No. 15, “The Dollar as a War Asset”) or the role of dollar stablecoins in Treasury bill demand (Foresight No. 18, “Stablecoins and Monetary Sovereignty”). It is about the long-run composition of official reserves. Figure 1 sets out the framework: five drivers act on the allocation chosen by reserve managers, network inertia slows the response, and the result feeds back into US borrowing costs, demand for euro assets, and the small reserve currencies of Canada and the United Kingdom.
2. Where reserves stand in 2026
2.1 The headline numbers
The IMF’s Currency Composition of Official Foreign Exchange Reserves (COFER) for the second quarter of 2026, released on 30 September, puts total reserves at 13.22 trillion dollars, up from 13.10 trillion at the end of March. The dollar’s share fell to 56.70 percent from a revised 57.18 percent, and the euro’s rose to 20.60 percent from 20.04 percent; the IMF described the euro’s increase as the largest in both claims and share among reported currencies. The yen fell to 4.96 percent from 5.43 percent, continuing a downward trend, and the renminbi rose to 2.11 percent from 1.98 percent. Sterling gained 0.16 point, the Australian dollar 0.13 point and the Swiss franc 0.03 point; the Canadian dollar lost 0.01 point and other currencies 0.06 point, remaining above 6 percent. Exchange rates moved by less than 2 percent in the quarter, so valuation played little role.
The previous release told a different story. In the first quarter of 2026, as the war drove the dollar up, the dollar’s share rose to 57.13 percent from 56.42 percent, and the IMF estimated that exchange-rate valuation explained about half of the increase. Over the twelve months to June 2026 the net effect is a small decline. Table 1 gives the composition in dollars; for sterling and the Canadian, Australian and Swiss dollars, whose recent shares are not published individually, it uses the IMF’s 2025 Q2 values, which add up exactly to the 2026 residual.
Table 1. Composition of global foreign exchange reserves, second quarter of 2026
| Currency | Share of FX reserves | Amount, USD bn | Change in share, 2026 Q1 to Q2 (pp) |
|---|---|---|---|
| US dollar | 56.70% | 7,496 | -0.48 |
| Euro | 20.60% | 2,723 | +0.56 |
| Japanese yen | 4.96% | 656 | -0.47 |
| Pound sterling | 4.71% (a) | 623 | +0.16 |
| Canadian dollar | 2.60% (a) | 344 | -0.01 |
| Renminbi | 2.11% | 279 | +0.13 |
| Australian dollar | 2.05% (a) | 271 | +0.13 |
| Swiss franc | 0.17% (a) | 22 | +0.03 |
| Other currencies | 6.10% | 806 | -0.06 |
| Total | 100% | 13,220 |
Source: IMF COFER release of 30 September 2026; (a) 2025 Q2 shares under the new IMF method (IMF technical note, 2025), consistent with the 2026 residual; amounts and allocation by the author.
2.2 A methodological break that moved the euro by a point
Comparisons over time need care. Until mid-2025 COFER reported shares of “allocated” reserves, those whose currency composition was reported; about 7 percent of reserves were “unallocated”. From the third quarter of 2025, with revisions back to 2000, the IMF imputes the composition of the missing part, so that published shares now cover all reserves; in the fourth quarter of 2025, 10.75 percent of reserves had an imputed composition. The change is not neutral. For the second quarter of 2025 it raised the dollar’s share from 56.32 to 57.12 percent and lowered the euro’s from 21.13 to 20.12 percent; the ECB estimates that the change lowered the euro’s share by about 0.8 point. In this note the long history (1999 to 2024) uses the old series as published by the Federal Reserve, and the 2025 and 2026 points use the new one (Figure 2a, diamonds). The scenarios start from the new series.
2.3 Gold overtakes the euro
Figure 2b shows the part of reserves that COFER leaves out. On IMF International Financial Statistics, compiled by the Federal Reserve, gold was 12.9 percent of official reserves at market value at the end of 2000, fell to 9.1 percent at the end of 2015, and rose to 18.6 percent at the end of 2024 and 23.3 percent in the first quarter of 2025. The ECB’s June 2026 report on the international role of the euro puts it at 27 percent at the end of 2025, ahead of the euro (15 percent of total reserves) and US Treasury securities (22 percent). The ECB attributes most of the rise to valuation: the gold price rose about 30 percent in 2024 and about 60 percent in 2025.
Meanwhile foreign investors’ share of marketable Treasuries fell from 56.5 percent in 2008 to 31.7 percent in 2025 (Figure 2c), reflecting the growth of US debt and of domestic holders more than a foreign retreat. And central banks have bought gold at roughly twice the pace of the previous decade (Figure 2d): 1,081.9 tonnes in 2022, 1,037.4 in 2023 and 1,092.4 in 2024, against an average of 473 tonnes a year in 2010 to 2021, then 863.3 tonnes in 2025, 21 percent less than in 2024.
A first look at the results
The full note goes much further, with original models, scenarios and a dashboard of leading indicators. Two of its 14 charts and diagrams are shown below.
Continue reading
Get the full note: 26 pages, 14 charts and diagrams, 8 tables
This page shows the first part of the note. The full PDF adds: what the headline hides: valuation versus active erosion; the network behind the reserve share; gold: the asset without an issuer; treasuries: who replaced the official buyer; the drivers, measured; four scenarios to 2035; consequences; leading-indicators dashboard; implications for policy and for investors.
29 USD, instant PDF download, secure card payment.
Buy the full noteNeed this analysis for your organisation?
We prepare confidential briefings, executive talks and studies on countries, markets and policies, built on the same method as this article.
Request a briefingSupport independent analysis
Our studies are free to read and carry no advertising. If this one was useful, a small contribution helps us publish the next.
Support our workGo further: books by Global Strategy Files

Frequently asked questions
What share of global reserves is in US dollars in 2026?
According to the IMF’s COFER data released on 30 September 2026, the US dollar accounted for 56.70 percent of the 13.22 trillion dollars of global foreign exchange reserves at the end of June 2026. The euro held 20.60 percent, the yen 4.96 percent and the renminbi 2.11 percent. The dollar’s share was 71.5 percent in 2001. Counting gold at market prices, the dollar is about 41 percent of all official reserves.
Is gold replacing the dollar as a reserve asset?
Gold has become the second largest reserve asset: the ECB puts it at 27 percent of official reserves at the end of 2025, ahead of the euro at 15 percent and US Treasuries at 22 percent. Most of the rise came from the price, not from new purchases: ounces held rose about 10 percent between 2015 and 2025 while the price nearly tripled. Gold complements the dollar rather than replacing it, because it pays no interest.
What will the dollar’s share of reserves be in 2035?
In the author’s four scenarios, the dollar’s share of foreign exchange reserves at the end of 2035 ranges from 46.9 percent in a fragmentation scenario to 52.5 percent in a slow-erosion scenario, with a probability-weighted value of 50.4 percent. The dollar remains the first reserve currency in all four. Including gold, its share of total reserves falls to between 28 and 37 percent, as gold rises to between 27 and 46 percent.
How would a lower dollar share affect US borrowing costs?
Fewer Treasury purchases by central banks and a smaller convenience yield would raise US Treasury yields by about 13 to 60 basis points by 2035 in the author’s scenarios, or 29 basis points on a probability-weighted basis. On projected marketable debt of about 58 trillion dollars, that is roughly 170 billion dollars a year once the debt has repriced, about 8 percent of the interest bill the CBO projects for 2036.
Sources
- IMF, “IMF Data Brief: Currency Composition of Official Foreign Exchange Reserves”, releases of 30 September 2026 (2026 Q2), 1 July 2026 (2026 Q1), 27 March 2026 (2025 Q4), 19 December 2025 (2025 Q3) and 1 October 2025 (2025 Q2), data.imf.org.
- IMF, “Improving the Analytical Usefulness of the IMF’s COFER Data”, Technical Notes and Manuals 2025/014.
- IMF, World Economic Outlook database, October 2026 (series NGDPD, GGXWDG_NGDP, GGXCNL_NGDP; local extract fetched 20 October 2026); Japan nominal GDP as reported by Kyodo/Nippon.com, 17 October 2026.
- Federal Reserve Board, “The International Role of the U.S. Dollar, 2025 Edition”, FEDS Notes, 18 July 2025 (and accessible tables).
- Federal Reserve Board, H.10 Foreign Exchange Rates (daily, via datahub mirror), retrieved 2026.
- Beltran, D., Kretchmer, M., Marquez, J. and Thomas, C., “Foreign Holdings of U.S. Treasuries and U.S. Treasury Yields”, International Finance Discussion Papers 1041, Federal Reserve Board, 2012 (Journal of International Money and Finance, 2013).
- Chinn, M. and Frankel, J., “Will the Euro Eventually Surpass the Dollar as Leading International Reserve Currency?”, in G7 Current Account Imbalances, NBER and University of Chicago Press, 2007.
- Arslanalp, S., Eichengreen, B. and Simpson-Bell, C., “The Stealth Erosion of Dollar Dominance: Active Diversifiers and the Rise of Nontraditional Reserve Currencies”, IMF Working Paper 22/58, 2022.
- European Central Bank, “The international role of the euro”, June 2026, and press release “International role of the euro increased moderately in 2025”, 2 June 2026.
- World Gold Council, Gold Demand Trends Full Year 2025 (central banks); Gold Demand Trends Q1 2025, Q2 2026 (central banks); Gold Demand Trends Full Year 2023 (central banks).
- World Gold Council, “Central bank gold statistics: central banks continue summer spree in August”, October 2026.
- World Gold Council, Central Bank Gold Reserves Survey 2026 and press release “Central banks set to step up gold buying over the next year”, June 2026.
- Bank for International Settlements, “OTC foreign exchange turnover in April 2025”, Triennial Central Bank Survey, 30 September 2025.
- Swift, RMB Tracker and Global Currency Tracker, editions of October 2025, November 2025, February 2026, June 2026 and July 2026.
- US Treasury, Treasury International Capital, Table 5 “Major Foreign Holders of Treasury Securities” (August 2025 to August 2026); press releases “Treasury International Capital Data for June” (17 August 2026) and “for August” (16 October 2026).
- Congressional Budget Office, “The Budget and Economic Outlook: 2026 to 2036”, February 2026, as summarised by the Committee for a Responsible Federal Budget.
- Moody’s Ratings, United States sovereign rating action, 16 May 2025.
- European Commission, “Commission raises 11 billion euros in its 8th syndicated transaction of 2026”, 15 September 2026.
- Council of the European Union and European Council: regulation of 12 December 2025 on the immobilisation of Central Bank of Russia assets; conclusions of 18 to 19 December 2025 (as analysed by OSW, “A bitter compromise over the EU’s financial assistance to Ukraine”, 19 December 2025).
- Japan Ministry of Finance, JGB Investor Presentation, August 2026.
- World Bank, World Development Indicators, GDP in current US dollars (NY.GDP.MKTP.CD), via the datasets/gdp repository.
- Section 899 withdrawal: US Treasury statement of 26 June 2025 as reported by Axios and Bloomberg Tax.
- Data series IDs: IMF COFER (IMF.STA:COFER); TIC slt_table5; H.10; WGC Gold Demand Trends; BIS rpfx25; IMF WEO NGDPD, GGXWDG_NGDP. All sources retrieved 20 to 24 October 2026.
Books from Global Strategy Files
Go further on this topic
 Future-Proofing AmericaEconomic challenges and the road to reform.20 USD, see the bookThe Tariff GambleHow America’s trade war is reshaping power, prices and prosperity.24.99 USD, see the book
 Kill KennedyWhat the 2025 declassified files reveal about the machinery of American power.20 USD, see the book
