
A New Bargain, Not a New Regime: Four Futures for China to 2035 and 2050


Driss EFFINA, PhD Independent Researcher, Global Strategy Files Foresight, prospective note No. 3, 20 October 2026. Reading time: about 65 minutes
Key takeaways
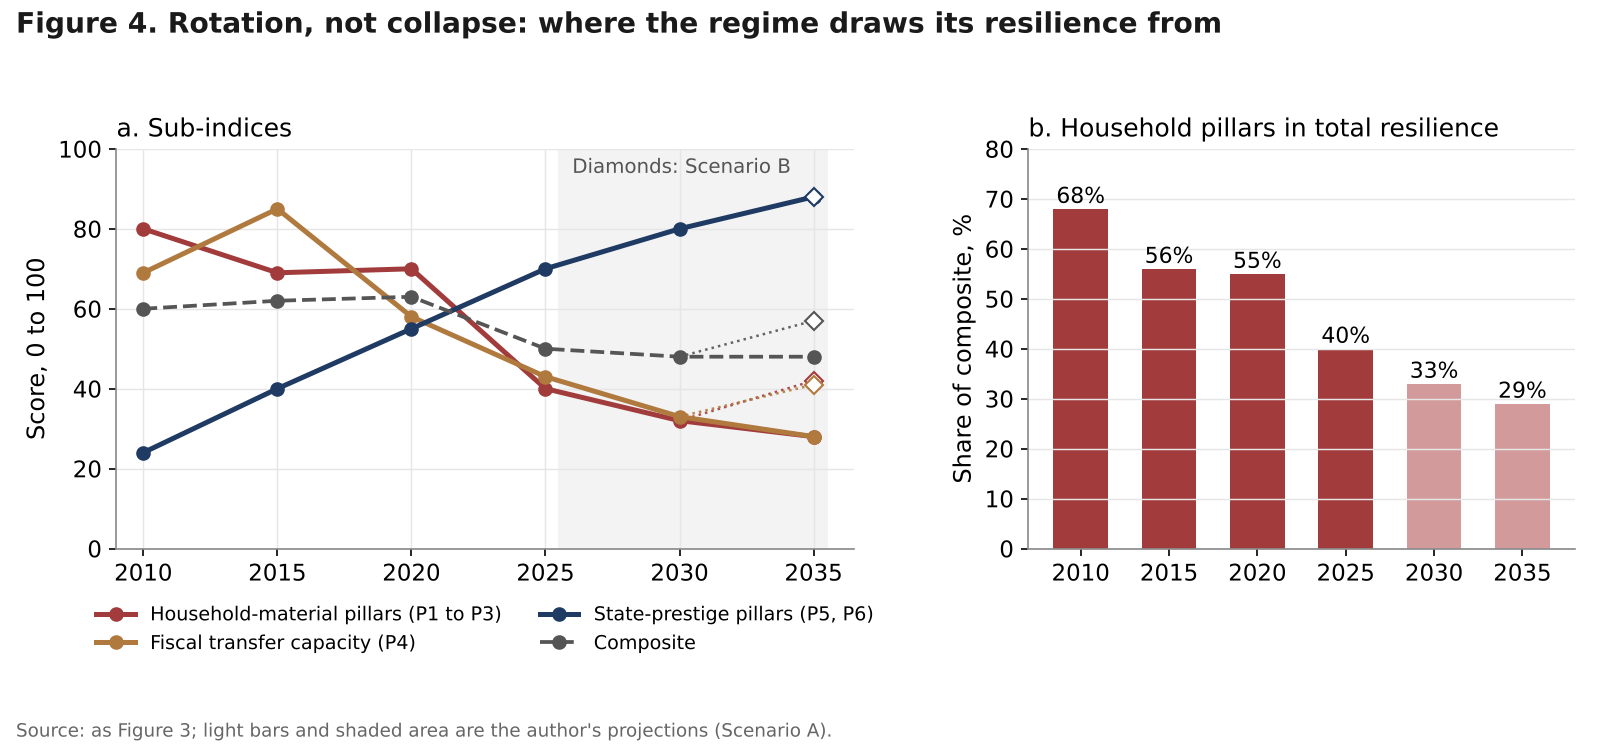
- China’s regime resilience has rotated rather than collapsed: household-material pillars supplied 68 percent of measured resilience in 2010 and 40 percent in 2025, while technology and national standing rose; the only pillar that can compensate households, fiscal capacity, is eroding.
- On a demographic clock aligned by old-age dependency, China reaches Japan’s 1995 and Korea’s 2019 ageing with a third of US income; doubling 2020 GDP slips to about 2038 and labour input subtracts 1.3 to 1.6 points of growth a year after 2035.
- A core adaptive package of pensions, child benefits and hukou services costs about 3.2 percent of GDP a year, less than the 5.5 percent of GDP of off-budget spending in the IMF augmented deficit: the constraint is allocation, not money.
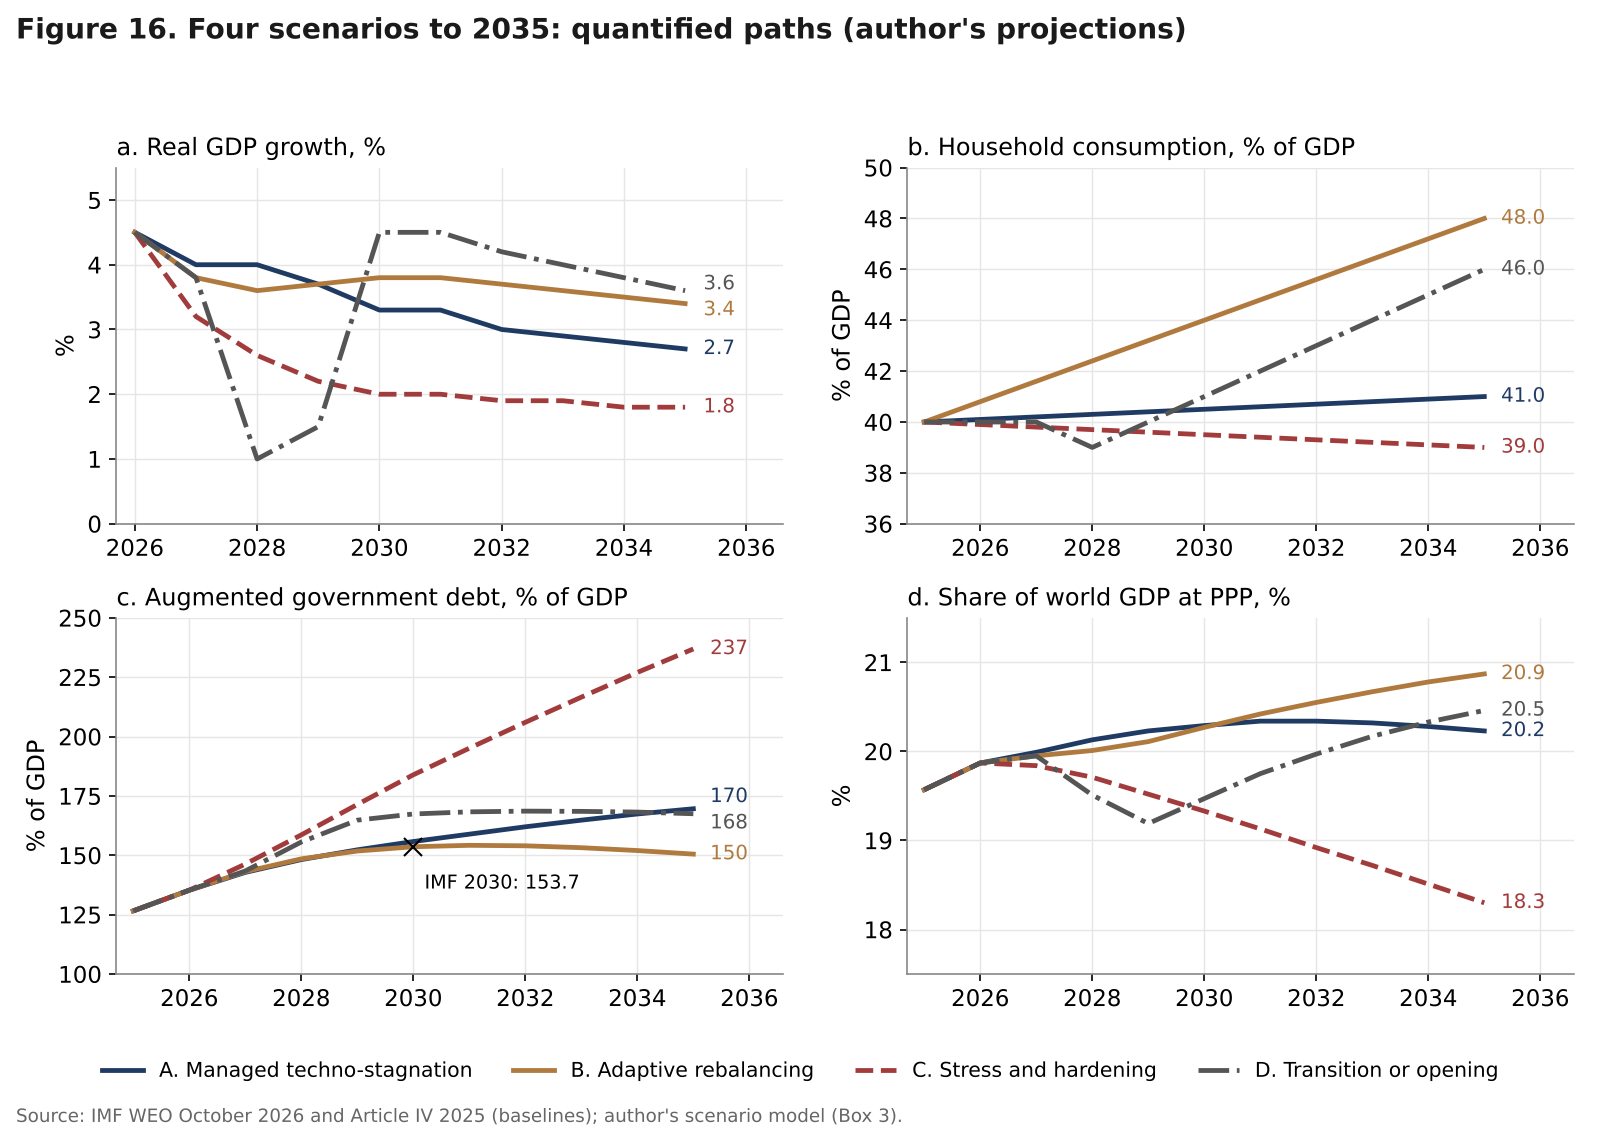
- Scenarios to 2035 (author’s probabilities): managed techno-stagnation 48 percent, adaptive rebalancing 21 percent, stress and hardening 19 percent, transition or opening 12 percent; China needs a new bargain, not a new regime.
Abstract
China ends 2026 with real growth of 4.6 percent over the first nine months, a record trade surplus, a fourth consecutive year of population decline and a property sector still contracting by a fifth a year. The debate on its future tends to swing between two stories: a system that will outgrow every rival and a system that has reached its peak. This note asks a more precise question, the one that matters for the next decade: can the current political economy absorb its internal and external pressures, or must the regime change form for China to keep advancing? It builds six original tools from IMF (October 2026), World Bank, NBS and other official data: a regime resilience accounting of six measurable pillars from 2010 to 2035; a “demographic clock” that compares China with Japan and Korea at the same old-age dependency ratio rather than the same calendar year; a demographic growth accounting to 2050; a rebalancing arithmetic linking the household consumption share to capital efficiency; a fiscal-demographic squeeze to 2050; and an external pressure index. The resilience of the Party-state has not collapsed; it has rotated from household-material pillars to state-prestige pillars, and those cannot substitute for the pillar that is eroding, fiscal transfer capacity. The binding constraint on China’s rise is not its political form but the distribution of income and risk between the state, firms and households. The adaptation it requires costs about 3 percent of GDP a year, less than the off-budget spending already in the IMF’s augmented deficit. Four scenarios to 2035 are quantified: managed techno-stagnation (48 percent), adaptive rebalancing (21 percent), fiscal-financial stress and hardening (19 percent), and transition or opening (12 percent). All projections and probabilities are the author’s.
Keywords: China, growth model, regime resilience, demography, rebalancing, household consumption, public debt, pensions, trade surplus, scenarios
JEL codes: O53, P26, E21, H55, J11, F13
Key findings
1. Resilience has rotated, not collapsed, and the substitutes are the wrong ones. On the author’s six-pillar index, the regime’s composite resilience fell from 63 in 2020 to 50 in 2025. The household-material pillars (income growth, housing wealth, youth jobs) supplied 68 percent of measured resilience in 2010, 40 percent in 2025 and 29 percent in 2035 under the baseline. Technology and national standing rose from 24 to 70. But they do not pay pensions or replace lost housing wealth. The only pillar that can stand in for household gains, fiscal transfer capacity, fell from 85 in 2015 to 43 in 2025. 2. On the demographic clock, China needs more growth per tick than any precedent. China reached an old-age dependency ratio of 21.4 in 2025, the level Japan reached in 1995 and Korea in 2019, with 33 percent of US income per head against 81 and 73 percent. A clock-and-gap benchmark, crediting China for its larger catch-up room, gives 3.6 percent a year of per capita growth for 2025 to 2035, below the 4.4 percent needed to double income per head from 2020. On the IMF path, real GDP doubles from its 2020 level only in about 2038. After 2035, shrinking labour input subtracts 1.3 to 1.6 points from growth every year. 3. Rebalancing is a capital-efficiency problem before it is a demand problem. The incremental capital-output ratio rose from 3.6 in 2001 to 2007 to 7.9 in 2018 to 2024 and about 10 on the IMF growth path. At that efficiency, 4 percent growth leaves room for a household consumption share of only 41 percent of GDP. Lifting it to 48 percent by 2035 costs 0.7 points of growth unless capital efficiency improves by 17 percent. It needs transfers to households rising by about 0.7 points of GDP a year. 4. The money for adaptation exists; the allocation does not. A core adaptive package (resident pensions raised from 163 to 1,000 yuan a month, the IMF’s social items, a child benefit of 1,000 yuan a month and services for non-hukou urban residents) costs about 3.2 percent of GDP a year. That is less than the 5.5 percent of GDP gap between the IMF’s augmented and official deficits in 2026, and less than the 4.25 points of GDP of revenue lost since 2015. Meanwhile, age-related spending rises from 29 percent of government revenue in 2025 to 42 percent in 2035 and 63 percent in 2050. 5. Exports cannot carry the model much further. Since 2021 the rise in the current account surplus has offset only 29 percent of the 8.3 points of GDP lost in property investment. If net exports had to absorb just 0.5 points of GDP of additional drag each year, China’s surplus would exceed the entire US current account deficit by 2029. The author’s external pressure index rose from 21 in 2015 to 78 in 2025 and stands at 70 in 2026.
1. Introduction
Few questions in economics carry as much political charge as the future of China. The two dominant answers are mirror images. One extrapolates four decades of catch-up and sees a China that will soon dominate world output, technology and trade. The other sees an ageing, indebted, deflationary economy that has already passed its high point and must slide into stagnation unless its political system opens. Both answers rest on the same weak foundation: they treat the economy and the regime as a single block that either succeeds or fails.
This note separates them. A regime can survive with slow growth, as many have; an economy can keep advancing under an unchanged political form, as China itself has shown since 1978. The relevant question for 2026 to 2035 is narrower and more testable: which specific economic constraints threaten the capacity of the Party-state to keep delivering what has sustained it, and which changes would relieve those constraints? Are those changes compatible with the existing political form, or do they require a different one?
To answer, the note builds six quantitative tools. Section 3 decomposes regime resilience into six measurable pillars and tracks them from 2010 to 2035. Section 4 aligns China with Japan and Korea on a demographic clock and computes what productivity must deliver to 2050. Section 5 derives the household consumption share compatible with given capital efficiency and growth, and prices the transfers needed to reach it. Section 6 projects the fiscal cost of ageing against a falling revenue ratio. Sections 7 and 8 test whether high-tech exports can offset domestic drags and measure external pressure. Section 9 confronts the political question directly, with historical analogues and explicit adaptation thresholds. Section 10 sets out four scenarios to 2035 with a view to 2050, and the following sections give indicators, implications and a calendar.
The answer, in brief, is that China does not need regime change to continue its rise, but it does need a change in its internal bargain: who absorbs losses, and who receives the marginal yuan. The cost of that change is modest relative to resources already deployed. Its difficulty is political-institutional, not fiscal. That distinction is the core of this note. Earlier notes on this site analysed the property contraction, local government debt, household consumption and the 2026 export surge in detail; this note does not repeat them but uses a few of their estimates where indicated.
2. The model in 2026: what still works and what broke
2.1 The numbers
The headline figures for 2026 are better than the gloom suggests. Real GDP grew 5.0 percent in the first quarter, 4.3 percent in the second and 4.5 percent in the third, 4.6 percent over nine months, within the official target of 4.5 to 5 percent. Industrial output rose 5.3 percent, and value added in high-tech manufacturing 14.3 percent. Exports rose 16.4 percent in yuan terms and imports 22.3 percent. The surplus reached 938 billion dollars in the first nine months, after a record of about 1.19 trillion dollars for 2025.
Beneath the headline, domestic demand is weak. Fixed asset investment fell 7.2 percent in the first nine months, real estate investment 20.6 percent and private investment 10.4 percent. Retail sales of goods rose only 1.1 percent; including services, 2.6 percent. Youth unemployment (ages 16 to 24, excluding students) reached 18.9 percent in August. In 2025, nominal GDP grew about 4 percent against real growth of 5 percent, according to a Chinese Academy of Social Sciences report cited by Yicai: the GDP deflator was negative again.
| Indicator | 2010 | 2015 | 2020 | 2025 | 2026 |
|---|---|---|---|---|---|
| Real GDP growth (%) | 10.6 | 7.0 | 2.3 | 5.0 | 4.5 (IMF) |
| Household consumption (% GDP) | 34.6 | 38.1 | 38.2 | 40.0 (2024) | n.a. |
| Gross capital formation (% GDP) | 46.1 | 42.7 | 42.6 | 38.8 (IMF) | n.a. |
| Current account (% GDP) | 3.8 | 2.6 | 1.5 | 3.7 | 4.0 |
| Government revenue (% GDP) | 24.1 | 28.6 | 25.5 | 25.0 | 24.3 |
| Gross government debt, WEO (% GDP) | 33.1 | 40.9 | 70.6 | 98.6 | 104.4 |
| Property investment (% GDP) | 11.7 | 13.9 | 13.9 | 5.9 | about 4.5 |
| Old-age dependency ratio | 11.9 | 14.0 | 18.2 | 21.4 | 21.6 |
| Youth unemployment, ILO modelled (%) | 9.8 | 10.7 | 12.7 | 15.8 | 18.9 (NBS, Aug.) |
| FDI net inflows (% GDP) | 3.9 | 2.1 | 1.7 | 0.4 | n.a. |
| Share of world GDP at PPP (%) | 12.8 | 15.8 | 18.4 | 19.6 | 19.9 |
Table 1. China’s model in numbers. Sources: IMF WEO October 2026; World Bank WDI; NBS; IMF Article IV 2025 (capital formation 2025); Global Strategy Files estimate for property investment in 2026. Property investment uses NBS investment and nominal GDP.
2.2 How the machine was wired
Figure 1 maps the causal structure. For two decades, high and precautionary household saving was channelled by state banks at low deposit rates into property, infrastructure and manufacturing. Property fed land sales, which financed local governments, which financed more infrastructure: a reinforcing loop (R1 in the figure). Rising house prices also made housing the main store of household wealth, which supported consumption and confidence.
Loop R1 broke in 2021. Sales of commercial buildings, which reached 17.4 trillion yuan in 2020 and topped 17 trillion in 2021, fell to 8.39 trillion in 2025. Land revenue fell from 8.70 trillion yuan in 2021 to 4.15 trillion in 2025, or 3.0 percent of GDP. Real residential property prices in 70 cities stood at 85.1 in the first quarter of 2026 on the BIS index (2010 = 100): in real terms, existing homes are worth less than in 2010. A second loop then took over: credit moved from property to manufacturing and high-tech capacity, which pushed exports and the surplus up, which in turn triggered partners’ reactions (balancing loop B2). Overcapacity and the housing slump fed low prices, raising the real burden of debt. Demography, finally, weakens housing demand and household income at once.
2.3 A plateau in weight
Figure 2 shows the result in the IMF’s own baseline. China’s growth slows from 4.5 percent in 2026 to 3.3 percent in 2030 and 2031. Its share of world GDP at purchasing power parity, which rose by 0.54 points a year in 2010 to 2019, rises by only 0.09 points a year from 2026 to 2031, to 20.3 percent. India’s share rises by 0.33 points a year. In the baseline, China does not decline; its relative weight stops growing. This is the first fact a forecaster must explain: the IMF already assumes a plateau, so the question is not whether China slows but what the slowdown does to the system that produced the boom.
2.4 Policy since 2024
The authorities have not stood still. The Third Plenum of July 2024 adopted more than 300 reform measures, including a shift of excise tax collection towards local governments and a larger central share of spending. In November 2024 the National People’s Congress Standing Committee approved a 6 trillion yuan increase in local debt quotas over three years to swap hidden debt, alongside 800 billion yuan a year of special bonds for the same purpose over five years: a 10 trillion yuan package against hidden debt estimated at 14.3 trillion yuan at the end of 2023. The statutory retirement age began rising on 1 January 2025, from 60 to 63 for men and from 50 and 55 to 55 and 58 for women, over 15 years. A national childcare subsidy of 3,600 yuan a year per child under three was announced in July 2025. The 2026 budget set a deficit of about 4 percent of GDP, 1.3 trillion yuan of ultra-long special treasury bonds and 4.4 trillion yuan of local special bonds; the minimum basic pension for rural and non-working urban residents rose by 20 yuan to 163 yuan a month. The 15th Five-Year Plan, approved on 12 March 2026, keeps growth “within a reasonable range”, targets R&D spending growth of more than 7 percent a year and urbanisation of 71 percent by 2030, and states an aim to raise the household consumption rate without a numerical target. A dedicated consumption plan of July 2026 targets retail sales of about 60 trillion yuan by 2030, against 50.1 trillion in 2025.
These measures share a pattern. They socialise risk, moving local liabilities onto stronger balance sheets, but they transfer little income. The 2025 data make the point: according to the National Institution for Finance and Development, the macro leverage ratio rose 11.8 points to 302.3 percent of GDP, with government leverage up 7.6 points and corporate leverage up 6.2 points, while household leverage fell 2 points. Risk is being socialised; income is not. This asymmetry runs through the rest of the note.
A first look at the results
The full note goes much further, with original models, scenarios and a dashboard of leading indicators. Two of its 17 charts and diagrams are shown below.
Continue reading
Get the full note: 30 pages, 17 charts and diagrams, 12 tables
This page shows the first part of the note. The full PDF adds: regime resilience accounting; demography: the clock and the arithmetic; the rebalancing arithmetic; the fiscal-demographic squeeze; the techno-industrial offset and its external limit; external pressure; does China need regime change to continue its rise?; scenarios to 2035, with a horizon to 2050; a dashboard of leading indicators.
29 USD, instant PDF download, secure card payment.
Buy the full noteNeed this analysis for your organisation?
We prepare confidential briefings, executive talks and studies on countries, markets and policies, built on the same method as this article.
Request a briefingSupport independent analysis
Our studies are free to read and carry no advertising. If this one was useful, a small contribution helps us publish the next.
Support our workGo further: books by Global Strategy Files

Frequently asked questions
Does China need regime change to keep growing?
Not according to this analysis. The binding constraint is the distribution of income and risk between the state, firms and households, not the political form. Moving about 3 percent of GDP a year from off-budget investment to pensions, child benefits and public services for migrants would relieve the main pressures. That requires a political decision within the current system, not a political transformation, although the author judges a slow renegotiation more likely than a decisive one.
How fast is China ageing compared with Japan and Korea?
China’s old-age dependency ratio reached 21.4 people aged 65 and over per 100 of working age in 2025, a level Japan reached in 1995 and Korea in 2019. China will take about 13.8 years to reach 40, against 16.9 for Japan and 11.9 for Korea. The difference is income: China reaches this stage with 33 percent of US income per head, against 81 percent for Japan and 73 percent for Korea.
Can China raise household consumption to 48 percent of GDP?
Yes, but not cheaply in growth unless capital efficiency improves. With an incremental capital-output ratio of about 10, a consumption share of 48 percent is compatible with growth of about 3.3 percent a year. Reaching it by 2035 would require lower precautionary saving worth about 3 percent of GDP and transfers to households rising by about 0.7 points of GDP a year, according to the author’s estimates.
What are the four scenarios for China to 2035?
The author’s scenarios are managed techno-stagnation (48 percent), with growth slowing to 2.7 percent by 2035; adaptive rebalancing (21 percent), with consumption reaching 48 percent of GDP; fiscal-financial stress and hardening (19 percent), with augmented debt near 240 percent of GDP; and leadership transition or political opening (12 percent). China’s share of world output stays near 20 percent in 2035 on a probability-weighted basis.
Sources
- IMF, World Economic Outlook database, October 2026: NGDP_RPCH, PCPIPCH, NGDPD, NGDPDPC, PPPSH, BCA_NGDPD, GGXWDG_NGDP, GGR_G01_GDP_PT, G_X_G01_GDP_PT, GGXONLB_G01_GDP_PT, GGXCNL_NGDP, LUR for China, United States and India (retrieved 21 October 2026).
- IMF, “IMF Executive Board Concludes 2025 Article IV Consultation with China”, Press Release 26/053, 18 February 2026; People’s Republic of China: 2025 Article IV Consultation, Staff Report, Country Report, February 2026.
- World Bank, World Development Indicators and Population Estimates and Projections: NE.CON.PRVT.ZS, NE.GDI.TOTL.ZS, NE.EXP.GNFS.ZS, NV.IND.MANF.ZS, BX.KLT.DINV.WD.GD.ZS, SL.UEM.1524.ZS, TX.VAL.TECH.MF.ZS, SI.POV.GINI, GB.XPD.RSDV.GD.ZS, SP.URB.TOTL.IN.ZS, SP.POP.DPND.OL, SP.POP.1564.TO, SP.POP.65UP.TO.ZS, SP.POP.TOTL, NY.GDP.PCAP.PP.KD, SL.TLF.CACT.ZS, SP.DYN.TFRT.IN (retrieved 21 October 2026).
- National Bureau of Statistics of China: National Real Estate Development and Sales in 2010, 2015 and 2020; GDP and industrial data for 2025 (China Daily and gov.cn, 19 January 2026); data release of 19 October 2026 as reported by Al Jazeera, Global Times, Babypips and The Eastern Herald.
- Caixin Global, “China’s population decline accelerates as births hit modern-era low in 2025”, 19 January 2026; “China’s new home sales sink to 10-year low as crisis persists”, 21 January 2026; “China devotes 1.4 trillion to fixing its hidden debt problem”, 8 November 2024.
- Trading Economics, “China Youth Jobless Rate Surges to 1-Year High” (August 2026 data).
- Yicai Global, “China’s Debt-to-GDP Ratio Tops 300% in 2025 on Slower Economic Growth, Think Tank Says”, 28 January 2026 (National Institution for Finance and Development).
- BIS via FRED: Total Credit to Households for China (CRDQCNAHUBIS); Real Residential Property Prices for China (QCNR628BIS) (retrieved 21 October 2026).
- South China Morning Post, “China’s R&D spending hits record 2.8% of GDP, beating OECD average for the first time”, 30 September 2026.
- gov.cn, high-tech manufacturing share of industrial value added in 2025 (19 January 2026).
- Wikipedia, “15th Five-Year Plan” (targets table); MERICS, B. Hofman, “Deciphering the 15th Five-Year Plan”, March 2026; LexisNexis China, “China Unveils 20 Major Targets in the Draft Outline of the 15th Five-Year Plan”.
- Shanghai Municipal Government, “Highlights of 2026 Government Work Report”, 5 March 2026.
- China Services Info, “Blueprint to boost consumption unveiled”, 14 July 2026.
- Reuters (K. Yao), Chinese advisers on household consumption in the 15th Five-Year Plan, 7 July 2025.
- Mondaq, “CPC’s Third Plenary Session Heralds New Directions For China Economy”, 2024.
- Linklaters, “A New Chapter for China’s Workforce: China’s Retirement Age Increase takes effect from 1 January 2025”, 30 October 2024.
- China Briefing, “China Launches First-Ever National Childcare Subsidy”, July 2025.
- State Council, people-centred urbanisation plan, gov.cn, 3 August 2024.
- Pekingnology (Zichen Wang), “Investing in people, in Rmb20 instalments”, 10 March 2026.
- Jiemian, social insurance fund revenue and expenditure, first half of 2025; China Services Info, “China’s medical insurance fund sees stable operation”, January 2026.
- Al Jazeera, “China’s trade surplus hits new heights in 2025 despite US tariff war”, 14 January 2026; “Trump clears way for sale of powerful Nvidia H200 chips to China”, 9 December 2025.
- China Daily Hong Kong, SAFE data on direct investment liabilities in 2025, 14 February 2026.
- PIIE, C. P. Bown, “US-China Trade War Tariffs: An Up-to-Date Chart” (data to 22 August 2026).
- Wikipedia, “Busan Summit”; Northeast Times, “Trump welcomes Xi to White House as US, China extend tariff truce”, 24 September 2026.
- First Trust, “Tariffs: Some Relief, But Here to Stay”, 26 February 2026; Steptoe, “From IEEPA to Section 301”, 24 July 2026; ETRX Index, July 2026 print.
- Mining Technology, “China rare earth export pause nears expiry amid persistent supply concentration”, 27 April 2026.
- US Department of Defense, Military and Security Developments Involving the People’s Republic of China 2025, 23 December 2025 (via USNI News).
- SCMP, “China’s October plenum plan reveals focus on party discipline ahead of 2027 congress”, July 2026; CGTN, plenum dates, 21 September 2026.
- Wikipedia, “APEC China 2026”; “2026 Taiwanese local elections”; “21st National Congress of the Chinese Communist Party”.
- China Daily, “China holds Central Economic Work Conference to plan for 2026”, 11 December 2025.
- Global Strategy Files, earlier notes on China’s property contraction, local government debt, household consumption and AI-driven exports, October 2026.
Books from Global Strategy Files
Go further on this topic
The Tariff GambleHow America’s trade war is reshaping power, prices and prosperity.24.99 USD, see the book Future-Proofing AmericaEconomic challenges and the road to reform.20 USD, see the book
 Kill KennedyWhat the 2025 declassified files reveal about the machinery of American power.20 USD, see the book
