
The Reindustrialisation Race: Subsidies versus Results, 2020 to 2030

Driss EFFINA, PhD Independent Researcher, Global Strategy Files Foresight, prospective note No. 12, 24 October 2026. Reading time: about 55 minutes
Key takeaways
- No country has raised its manufacturing weight since 2019: the share of GDP fell from 0.43 point in France to 1.70 points in Germany, and all five economies are below their 2010 to 2019 trend, from 0.19 to 2.24 points.
- Payments lag promises: 42 percent of CHIPS awards and 41.8 percent of the France 2030 envelope had been paid, while the 2025 US tax law cut 496 billion dollars of energy credits, 1.27 times the IRA’s original estimate.
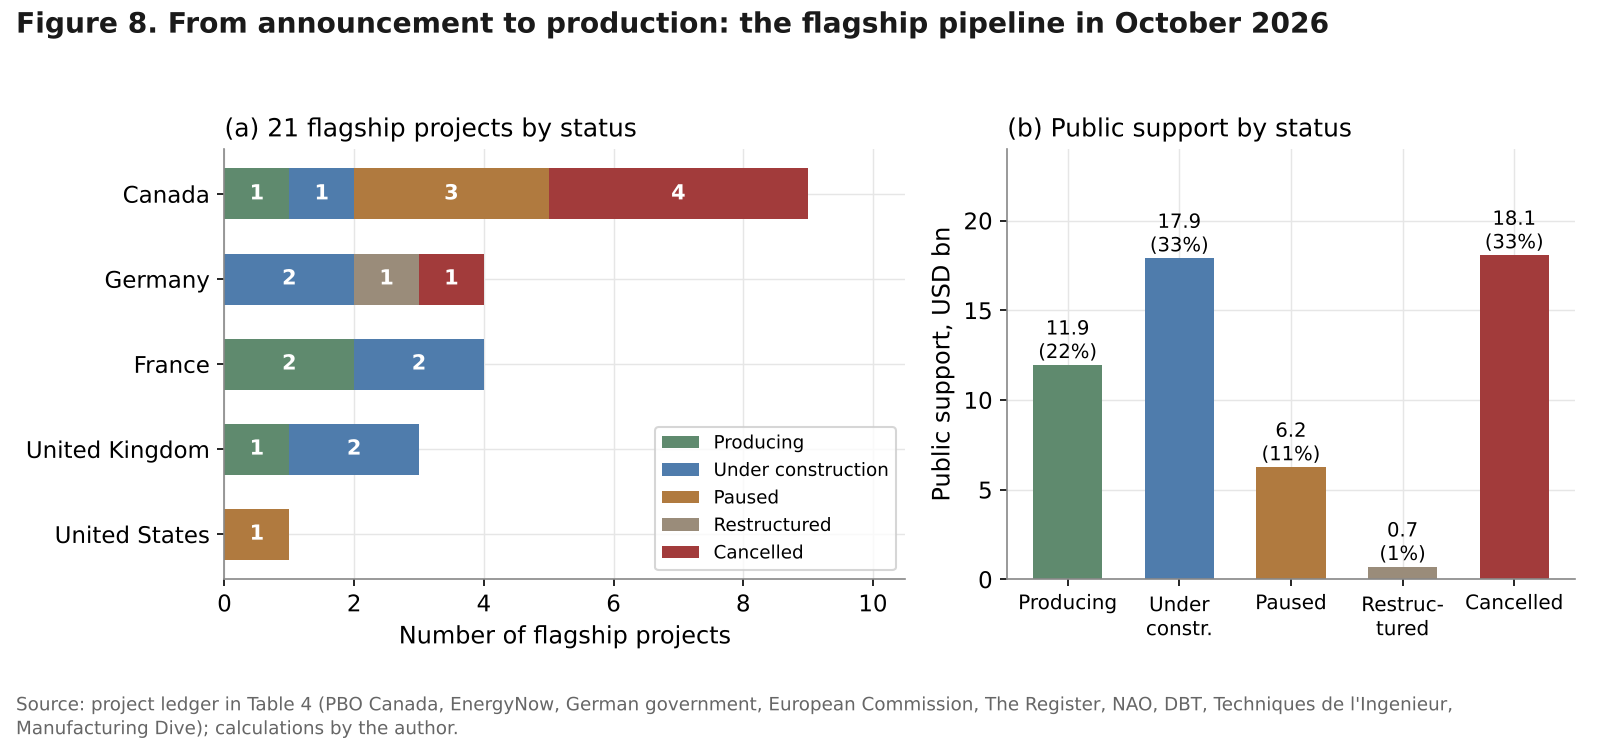
- Of 21 flagship projects with 54.8 billion dollars of public support, 10 are cancelled, paused or restructured and hold 45.6 percent of the money; a promised job cost a median 1.54 million dollars of support.
- Energy, not general competitiveness, explains who lost most; in the author’s scenarios the manufacturing share falls to 2030 in all five economies on a probability-weighted basis, from 0.10 point in Canada to 0.58 in the United Kingdom.
Abstract
Between 2021 and 2024 the United States, France, Germany, the United Kingdom and Canada each launched programmes to bring manufacturing home: the Inflation Reduction Act and the CHIPS Act, France 2030 and the green industry tax credit, German chip and battery aid followed by energy price relief, the British Industrial Strategy of June 2025, and Canada’s clean investment tax credits and electric vehicle deals. Five years on, the race has a first set of results, and they are sobering. In 2025 the manufacturing share of GDP was lower than in 2019 in all five economies and below its 2010 to 2019 trend in all five. Manufacturing production in 2025 ranged from 92.8 (Germany) to 102.8 (France) on a 2021 base. US manufacturing construction spending, the clearest sign of the boom, peaked at 249.8 billion dollars (annual rate) in August 2024 and was 170.7 billion in August 2026. Meanwhile, policy has started to reverse: the 2025 US tax law cut 496 billion dollars of energy credits over ten years, Intel cancelled its Magdeburg fab, Northvolt failed in Sweden, Germany and Quebec, and French programme credits were cancelled in 2025.
This note measures what the money bought. It builds four original tools: a ledger of manufacturing-targeted support committed and paid, with a “subsidy efficiency” measure per job and per point of value added share; a decomposition of output into energy-intensive and high-tech segments; an announcement-to-production pipeline of 21 flagship projects; and a structural competitiveness index built from energy cost, labour cost, skills, permitting time and market size. It closes with four scenarios to 2030 with explicit probabilities, 20,000 simulations, a dashboard of twelve indicators and a calendar of what to watch.
Keywords: industrial policy, reindustrialisation, subsidies, Inflation Reduction Act, CHIPS Act, France 2030, Industrial Strategy, energy-intensive industry, semiconductors, batteries, electric vehicles, scenarios
JEL codes: L52, L60, H25, O25, F13, Q48
Key findings
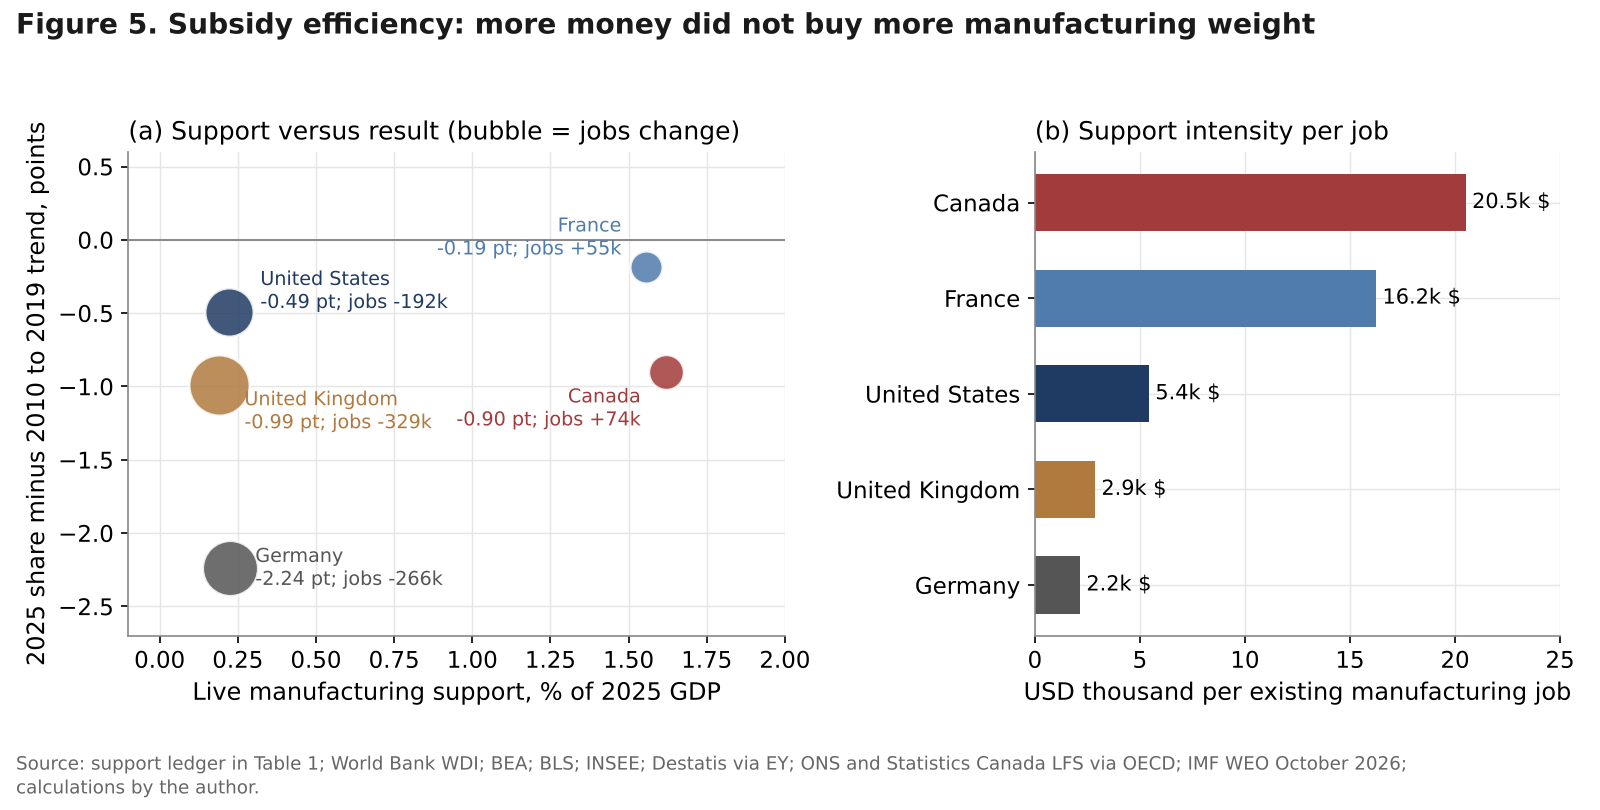
1. Commitments are large, payments are slow and the reversals are bigger than the payments. Of the 31.5 billion dollars of CHIPS incentives awarded to 49 projects, 13.1 billion (42 percent) had been paid by June 2026. France 2030 had paid 22.0 billion euros, 41.8 percent of its 52.6 billion envelope, by the end of 2025, and 1.9 billion euros of its 2025 credits were cancelled. The 2025 US tax law removed 496 billion dollars of energy credits over 2025 to 2034, 1.27 times the 391 billion dollars at which the Congressional Budget Office first costed all the climate and energy provisions of the Inflation Reduction Act. 2. No country has raised its manufacturing weight. Between 2019 and 2025 the manufacturing share of GDP fell by 0.43 point in France, 1.10 in the United States, 1.21 in Canada (author’s estimate), 1.30 in the United Kingdom and 1.70 in Germany. Against the 2010 to 2019 trend, the shortfall in 2025 ranges from 0.19 point (France) to 2.24 points (Germany). Only France and Canada have more manufacturing jobs than in 2019 (55,100 and 74,200 more). 3. More subsidy did not buy more industry. Live manufacturing support ranges from 0.19 percent of GDP (United Kingdom) to 1.62 percent (Canada), but its rank correlation with the 2025 gap to trend is only 0.3. Relative to the median loss of share across the five, France retained 0.79 point at a cost of about 67 billion dollars per point; the United States retained 0.11 point at about 606 billion dollars per point. In the flagship projects, a promised job cost a median 1.54 million dollars of public support, and 2.53 million in Canada’s electric vehicle deals, about 36 years of the average Canadian wage. 4. Manufacturing is running at two speeds, and energy decides who loses. US high-tech output grew 7.66 percent a year from 2017 to September 2026 while energy-intensive output fell 0.73 percent a year; in France the gap is 5.47 points a year since 2021. German energy-intensive output is 15.2 percent below February 2022; with 15 percent of manufacturing jobs, it accounts for about 24 percent of the industrial output loss. The ranking of shortfalls follows energy exposure (rank correlation 0.6), not general competitiveness, on which Germany ranks first (minus 0.7). 5. The pipeline leaks. Of 21 flagship projects carrying 54.8 billion dollars of public support, 4 are producing, 7 are under construction and 10 are cancelled, paused or restructured; those 10 hold 45.6 percent of the support. In the United States, new clean-tech manufacturing announcements fell 63 percent over the last two years, and 2025 cancellations equalled 55 percent of the year’s investment. 6. In the author’s scenarios, the race to 2030 is about limiting losses. Subsidy fatigue (40 percent), selective catch-up (25 percent), an energy squeeze (20 percent) and a competitiveness reset (15 percent) give probability-weighted manufacturing shares in 2030 below their 2025 levels in all five economies, from minus 0.10 point (Canada) to minus 0.58 (United Kingdom). The simulated probability that the 2030 share exceeds the 2025 share ranges from 12 percent (United States) to 38 percent (Germany); only France has a measurable chance (5 percent) of regaining its 2019 share.
1. Introduction
For three decades the official view in most advanced economies was that the sector mix should be left to markets. That view ended between 2020 and 2022. The pandemic exposed thin supply chains for chips and medicines, the energy crisis of 2022 showed Europe how exposed its heavy industry was to imported gas, and Chinese dominance in batteries, solar panels and electric vehicles turned industrial capacity into a question of security.
By October 2026 the money has been committed long enough to judge early results, and the environment has turned harsher. The war involving Iran that began at the end of February 2026 disrupted the Strait of Hormuz: Brent crude averaged 69.1 dollars a barrel in 2025 and 70.9 dollars in February 2026, then 117.3 dollars in April and 127.0 dollars in October. Long-term interest rates rose after February. Electric vehicle demand has fallen short of the plans on which battery plants were financed. And the largest programme of all, the American clean energy credits, was cut back by the 2025 tax law before most of its factories were built.
This note asks four questions. How much has each country committed, and how much has actually been paid? What has happened to manufacturing construction, output, jobs and the share of manufacturing in GDP? How efficient has the spending been, measured in dollars per job and per point of value added share? And what is likely by 2030? Figure 1 sets out the framework: instruments act through the cost of capital, operating costs and home-market protection, but their effect is filtered by structural conditions (energy cost, labour cost, skills, permitting and market size) before it reaches outcomes, and weak results feed back into policy reversals that raise the risk for the next investor.
The note does not repeat earlier work in this series: Decoded No. 13 traced how tariffs and the oil shock hit North American supply chains, and Foresight No. 8 projected the energy mix to 2030; here both enter only as inputs. Section 2 builds the ledger of programmes, Section 3 sets out outcomes, Section 4 measures subsidy efficiency, Section 5 decomposes output into two speeds, Section 6 follows the pipeline from announcement to production, Section 7 builds the competitiveness index and Section 8 presents the scenarios, followed by a dashboard, implications and a calendar.
2. Five programmes, one race: what was promised and what was paid
A fair comparison needs a common definition. This note separates three layers. The first is manufacturing-targeted support: money tied to specific plants or to manufacturing output, such as CHIPS grants, the 45X production credit, France 2030 aid, German chip and battery subsidies, British sector funds and Canadian production deals. The second is broad envelopes: economy-wide climate or energy programmes that help manufacturing among other things, such as the US clean electricity credits or German grid fee subsidies. The third is protection: tariffs, which raise prices for users rather than costing the budget. Table 1 and Figure 2 set out the first layer and the headline numbers of the second; Box 1 explains the choices.
2.1 United States: a large commitment, then a reversal
The CHIPS Act of 2022 set aside 39 billion dollars for manufacturing incentives. By June 2026, the Commerce Department had awarded 31.5 billion dollars to 49 projects across 24 companies and disbursed 13.1 billion, about 42 percent, according to the Government Accountability Office. The programme changed character in 2025: Commerce awarded nine new projects after July 2025, amended the awards of 14 companies, cancelled the National Semiconductor Technology Center award and began to treat equity as a factor in setting awards. The clearest case is Intel: in August 2025 the government took a stake of about 9.9 percent, buying 433.3 million shares at 20.47 dollars, for 8.9 billion dollars made up of 5.7 billion of unpaid CHIPS grants and 3.2 billion from the Secure Enclave programme. Intel’s 28 billion dollar Ohio project, which received 1.5 billion dollars of CHIPS funds, was pushed back in 2025 to completion in 2030 and 2031.
The Inflation Reduction Act was larger. In 2022 the Congressional Budget Office scored its energy and climate provisions at 391 billion dollars over 2022 to 2031, including 161 billion for clean electricity credits, 37 billion for clean manufacturing credits (mainly the 45X production credit) and 36 billion for clean fuel and vehicle credits. Later estimates were much higher, because the credits were uncapped. The 2025 tax law, enacted on 4 July 2025, cut them back by 496 billion dollars over 2025 to 2034: 190 billion from clean vehicle credits, 166 billion from the clean electricity investment credit and 77 billion from residential credits. The consumer electric vehicle credit ended for vehicles acquired after 30 September 2025. Wind and solar plants must now start construction by 4 July 2026 or be placed in service by the end of 2027. The 45X credit survives for most products, but wind components lose it after 2027, critical minerals are phased out over 2031 to 2033, and firms linked to “prohibited foreign entities” are excluded.
Tariffs are the third pillar. Customs duties reached 194.9 billion dollars in fiscal year 2025, about 0.63 percent of GDP, and 173.2 billion in fiscal 2026. On 20 February 2026 the Supreme Court ruled 6 to 3 that the International Emergency Economic Powers Act does not authorise tariffs. The administration replaced those duties with a 10 percent global tariff under Section 122 from 24 February (with an announced increase to 15 percent), which lapsed on 24 July 2026, when new Section 301 tariffs of 10 to 12.5 percent took effect on 60 economies covering 99.4 percent of imports. Section 232 tariffs on steel, aluminium and other sectors stayed in force, and refunds of the struck-down duties are being processed.
2.2 France: the most money per head, paid slowly
France 2030 was presented in 2021 with 54 billion euros; the Senate puts the envelope at 52.6 billion at the end of 2025. Commitment authority was 98 percent used (48.6 billion euros) and 43 billion had been awarded to final beneficiaries, 82 percent of the envelope. Payments are slower: 22.0 billion euros had been paid by the end of 2025, with 26.6 billion still to be opened. Annual payments fell from 5.7 billion in 2024 to 5.1 billion in 2025, and 1.9 billion euros of 2025 payment credits, 37 percent of the initial amount, were cancelled during the year. The 2026 budget opens 4.4 billion euros, 1.1 billion below the trajectory set in the autumn of 2025.
The green industry investment tax credit (C3IV) adds a second instrument. The government says about 73 projects have been approved for 3.6 billion euros of credits, supporting nearly 22 billion euros of industrial investment by 2030. A decree published on 11 August 2026 extended the credit by three years; the ministry expects about 40 more projects, 8 billion euros of investment and 20,000 direct jobs for a cost of about 1.1 billion euros. On the ground, the battery plants of the Hauts-de-France have advanced further than peers abroad (Table 4).
2.3 Germany: from chip subsidies to energy relief
Germany’s strategy rested on a few very large plants. The largest, Intel’s fab near Magdeburg, a project of more than 30 billion euros with about 10 billion euros of promised aid, was cancelled in July 2025 together with Intel’s assembly plant in Poland, which had 1.9 billion dollars of approved state aid. The 5 billion euro subsidy for ESMC, the TSMC-led fab in Dresden with Bosch, Infineon and NXP, was approved by the European Commission in August 2024; the plant is due to be fully operational in 2029. Infineon’s Dresden expansion, a 5 billion euro investment with about 1 billion euros of public support and up to 1,000 jobs, is due to start production in 2026. The battery bet went worse: Northvolt’s Heide plant was financed with a 600 million euro convertible bond from the state bank KfW, guaranteed half by the federal government and half by Schleswig-Holstein. After Northvolt’s insolvency, 153 million euros has been repaid, about 330 million had been spent on construction, land and machinery, and the American firm Lyten is taking over the site with an initial plan for about 1,000 jobs.
Since 2025 the emphasis has moved to energy costs. The European Commission approved an industrial electricity price on 16 April 2026: energy-intensive firms in 91 sectors can receive support to bring the price of up to half their consumption towards 5 cents per kWh over 2026 to 2028, with a budget of up to 3.8 billion euros, on condition that half the aid is invested in decarbonisation within 48 months. The government also funds a subsidy to transmission grid fees of 6.5 billion euros in 2026 and 5.525 billion a year in 2027 to 2029, 23.1 billion in all, and has cut the electricity tax for about 600,000 manufacturing firms. These broad measures are larger than the plant-specific aid that remains.
2.4 United Kingdom: a strategy with a small budget
The Industrial Strategy of June 2025 is a ten-year plan built around eight growth sectors. Its manufacturing money is modest: up to 4.3 billion pounds for advanced manufacturing, including up to 2.8 billion for research and development, within which the DRIVE35 automotive programme has 2.5 billion. A government progress report in July 2026 recorded 533 million pounds of DRIVE35 grants paid. The strategy’s main cost lever is the British Industrial Competitiveness Scheme, which from 2027 is to cut electricity costs by up to 25 percent (up to 40 pounds per MWh) for more than 7,000 electricity-intensive firms by removing renewables levies, and an increase of the network charge discount for the most energy-intensive firms from 60 to 90 percent from 2026. The National Wealth Fund, with 27.8 billion pounds, finances projects across sectors.
Steel has absorbed money outside the headline numbers. Under the Steel Industry (Special Measures) Act of 12 April 2025, the government took control of British Steel’s Scunthorpe works. The National Audit Office counts 377 million pounds spent by January 2026, expects more than 642 million by June 2026 and warns that costs could exceed 1.5 billion pounds in 2028. A 500 million pound grant supports Tata Steel’s electric arc furnace at Port Talbot, due in early 2028, and 380 million pounds supports the Agratas battery plant in Somerset, where delays to first deliveries have been reported.
2.5 Canada: the biggest bet relative to its size
Canada answered the American credits with six investment tax credits whose cost the Parliamentary Budget Officer put at 103 billion Canadian dollars over 2022-23 to 2034-35, 10 billion more than the 2024 budget estimate, and with production deals for electric vehicles and batteries. Thirteen major projects announced between October 2020 and April 2024 promised 46.1 billion dollars of investment, with potential public support of 52.5 billion Canadian dollars (31.4 billion federal and 21.1 billion provincial), much of it paid only as plants produce. By September 2026 the record is mixed: the NextStar battery plant in Windsor is producing with more than 1,300 employees, the Volkswagen PowerCo plant in St. Thomas is under construction for production in 2027, but Northvolt’s Quebec complex has been abandoned (Quebec spent about 510 million dollars, including a 270 million write-off), Honda’s Alliston programme was postponed in May 2025, construction of the Umicore and Ford/EcoPro cathode plants is suspended, Ford converted Oakville back to petrol pickups, GM ended BrightDrop production at Ingersoll in October 2025 and Stellantis stopped retooling in Brampton.
Table 1. Manufacturing-targeted support: committed, paid and changed, as of October 2026
| Country | Main instruments counted | Committed (local, bn) | USD bn | % of 2025 GDP | Paid to date | 2025 to 2026 changes |
|---|---|---|---|---|---|---|
| United States | CHIPS awards 31.5; 45X credit 37.0 (CBO 2022) | 68.5 | 68.5 | 0.22 | CHIPS 13.1 (42%) | Equity in Intel; 2025 tax law cut 496 bn of energy credits; tariffs |
| France | France 2030 aid awarded 43.0; C3IV 3.6 (EUR) | 46.6 | 52.7 | 1.56 | 22.0 of 52.6 envelope | 1.9 bn credits cancelled in 2025; C3IV extended to 2029 |
| Germany | ESMC 5.0; Infineon 1.0; Northvolt bond 0.6; power price 3.8; Intel 10.0 withdrawn (EUR) | 20.4 gross, 10.2 live | 23.1 gross, 11.6 live | 0.23 (live) | Not published | Intel cancelled; Northvolt insolvent; energy relief added |
| United Kingdom | Advanced manufacturing 4.3; British Steel 0.64; Port Talbot 0.5; Agratas 0.38 (GBP) | 5.8 | 7.7 | 0.19 | About 0.9 | British Steel taken over; BICS from 2027 |
| Canada | EV and battery deals, federal and provincial (CAD) | 52.5 | 37.6 | 1.62 | Mostly linked to output | Northvolt Six abandoned; Honda paused |
Note: committed amounts are the author’s ledger of manufacturing-targeted support (Box 1); broad envelopes are excluded. US dollars at 2025 average exchange rates (1.13 dollars per euro, 1.32 per pound, 0.72 per Canadian dollar). Sources: GAO-26-109121; CBO via CRFB; PGPF; French Senate report No. 736 (2025-2026); DGE; European Commission; German government; NAO; DBT; PBO; EnergyNow; IMF WEO October 2026.
Figure 2 puts the numbers on one scale. Relative to GDP, Canada (1.62 percent) and France (1.56 percent) have committed seven to eight times more manufacturing-targeted support than the United States (0.22 percent), Germany (0.23 percent of live support) or the United Kingdom (0.19 percent). The American numbers look small only because the large clean energy credits are counted as a broad envelope; the reversal of 2025 is larger than the whole original estimate of those credits.
Box 1. The support ledger and the efficiency measures
What is counted. Manufacturing-targeted support includes grants, tax credits tied to manufacturing output, loans or bonds to specific plants, plant-specific state aid and energy price support restricted to industrial users. It excludes economy-wide energy and climate credits, grid fee subsidies paid to all consumers, research funding not tied to manufacturing, and tariffs. For the United States, the 45X credit is counted at the CBO’s 2022 ten-year estimate (37 billion dollars), which is a lower bound; actual claims are not published by programme. For Germany, “live” support excludes the withdrawn Intel aid and the 153 million euros repaid by Northvolt. For Canada, the 52.5 billion Canadian dollars is a maximum: most of it is production-linked and paid only if output occurs. Currencies are converted at 2025 average ECB reference rates.
Outcome measures. The manufacturing value added share is from the World Bank (1995 to 2025 for France, Germany and the United Kingdom). For the United States, the World Bank series stops in 2021; the note adds the annual changes of the BEA series (annual averages of quarterly data) to the 2021 World Bank level. For Canada, the World Bank series ends in 2021; the author extends it with real manufacturing production growth (OECD, Statistics Canada) relative to real GDP growth (IMF), which assumes unchanged relative prices. The method gives 9.01 percent for 2022, against about 9.05 percent published, and 8.09 percent for 2025. The counterfactual is a linear trend fitted over 2010 to 2019 and extended to 2025; for Canada, where the series could not be obtained before 2019, the median slope of the four peers is applied from the 2019 level.
Efficiency. Three ratios are reported: support per existing manufacturing job; the gap to trend per percentage point of GDP of support; and, because no country beat its own trend, “peer-relative retention”, the 2019 to 2025 change in share minus the median change of the five (minus 1.21 points). With five countries these are descriptive comparisons, not causal estimates.
A first look at the results
The full note goes much further, with original models, scenarios and a dashboard of leading indicators. Two of its 14 charts and diagrams are shown below.
Continue reading
Get the full note: 27 pages, 14 charts and diagrams, 7 tables
This page shows the first part of the note. The full PDF adds: outcomes: construction, output, jobs and the manufacturing share; subsidy efficiency: what did the money buy?; two-speed manufacturing: energy-intensive versus high-tech; from announcement to production: the pipeline; structural competitiveness: the filter subsidies cannot remove; four scenarios to 2030; a dashboard of leading indicators; implications for policy, investors and firms; what to watch, October 2026 to mid-2027.
29 USD, instant PDF download, secure card payment.
Buy the full noteNeed this analysis for your organisation?
We prepare confidential briefings, executive talks and studies on countries, markets and policies, built on the same method as this article.
Request a briefingSupport independent analysis
Our studies are free to read and carry no advertising. If this one was useful, a small contribution helps us publish the next.
Support our workGo further: books by Global Strategy Files

Frequently asked questions
Have industrial subsidies brought manufacturing back to the United States and Europe?
Not yet. Between 2019 and 2025 the manufacturing share of GDP fell in all five economies studied: by 0.43 point in France, 1.10 in the United States, 1.21 in Canada, 1.30 in the United Kingdom and 1.70 in Germany. All five are below their 2010 to 2019 trend. US manufacturing construction boomed to a peak of 249.8 billion dollars in August 2024 but output and jobs did not follow.
Which country got the best value from its industrial subsidies?
France, on the author’s measures. It committed about 1.56 percent of GDP, lost only 0.43 point of manufacturing share since 2019, added 55,100 industrial jobs and beat the median of the five by 0.79 point, at about 67 billion dollars of commitments per point retained. Two of its four flagship battery plants are producing and two are under construction. Part of this reflects a lower dependence on gas-intensive industry.
Why did German industry decline despite large subsidies?
Because its losses came from energy-intensive branches and cars, which chip and battery subsidies do not reach. Energy-intensive output was 15.2 percent below February 2022 by March 2026, and these industries explain about 24 percent of the industrial output fall. Intel’s Magdeburg fab, with about 10 billion euros of promised aid, was cancelled in July 2025 and Northvolt’s Heide plant failed. Germany now subsidises industrial power instead.
What are the scenarios for manufacturing to 2030?
The author sets four: subsidy fatigue (40 percent), selective catch-up as plants under construction start producing (25 percent), an energy squeeze with oil above 110 dollars through 2027 (20 percent) and a competitiveness reset (15 percent). The probability-weighted manufacturing share falls in all five economies by 2030, and the chance that any country except France regains its 2019 share is close to zero.
Sources
- World Bank, World Development Indicators: NV.IND.MANF.ZS for France, Germany, the United Kingdom and the United States (file wb_governance.txt); Canada 2019 to 2021 as reported by TheGlobalEconomy, Trading Economics and Helgi Library (retrieved 24 October 2026).
- IMF, World Economic Outlook database, October 2026: NGDPD and NGDP_RPCH (file imf_weo_oct2026.txt). FRED: DCOILBRENTEU (file fred_batch1.txt).
- US Bureau of Economic Analysis, value added by industry, manufacturing as a percentage of GDP (FRED VAPGDPMA, retrieved 24 October 2026).
- US Census Bureau, construction spending, manufacturing (FRED TLMFGCONS and PRMFGCONS, August 2026); annual averages as compiled by Manufacturing Lead Generation (July 2026); FactCheck.org, manufacturing construction (6 February 2026).
- US Bureau of Labor Statistics, The Employment Situation, September 2026 (2 October 2026); manufacturing employment levels as compiled by Manufacturing Lead Generation; Manufacturing Dive, September 2026 jobs report.
- Board of Governors of the Federal Reserve System, G.17 Industrial Production and Capacity Utilization (16 October 2026).
- US Government Accountability Office, GAO-26-109121, CHIPS Act implementation (August 2026, status as of 5 June 2026).
- Intel equity stake: BetaNews (23 August 2025). Intel Ohio delay: Manufacturing Dive (3 March 2025). Intel withdrawal from Germany and Poland: The Register (25 July 2025).
- Congressional Budget Office estimate of the Inflation Reduction Act, as summarised by the Committee for a Responsible Federal Budget (“CBO Scores IRA with 238 Billion of Deficit Reduction”, 2022).
- Peter G. Peterson Foundation, “Energy Tax Policy under the OBBBA” (2025); RSM, “Tax bill significantly changes clean energy credits and incentives” (2025).
- Rhodium Group and MIT, Clean Investment Monitor: US Q4 2025 update; US Q2 2026 update; US Clean Technology Manufacturing Q2 2026; cleaninvestmentmonitor.org headline data (retrieved 24 October 2026).
- WilmerHale, “Supreme Court Strikes Down IEEPA Tariffs: What Now?” (20 February 2026); UHY, “Tariff reset: Section 122 expires as Section 301 duties expand” (July 2026); USAFacts, federal tariff revenue (fiscal years 2025 and 2026).
- US Energy Information Administration, Electric Power Monthly, average industrial price, August 2026.
- French Senate, Report No. 736 (2025-2026), “Investir pour la France de 2030” (17 June 2026). Ministry for the Economy (DGE), C3IV extension press release (12 August 2026); Barometre industriel de l’Etat 2025 (March 2026).
- INSEE, Indice de la production industrielle, August 2026 (Informations Rapides No. 245); Estimations trimestrielles d’emploi, Q2 2026 (28 August 2026).
- SDES, “Prix de l’electricite en France et dans l’Union europeenne en 2025”. Techniques de l’Ingenieur, “Gigafactories: quelle actualite en 2026” (30 January 2026).
- Destatis via produktion.de, energy-intensive industries (15 May 2026); Destatis production releases for August 2026 as reported by Kettner Edelmetalle (7 October 2026); Destatis press release on manufacturing employment (14 August 2026); EY analysis of industrial employment via Industriemagazin (19 February 2026).
- European Commission, approval of 5 billion euro German aid to ESMC (August 2024); SDxCentral on ESMC; electrive, German funding for Infineon Dresden (12 May 2025); Schwaebische Zeitung on Northvolt Heide repayments (10 April 2026).
- Clean Energy Wire, “EU approves German industry electricity price” (April 2026); Enerdata, German grid fee subsidies through 2029 (8 September 2026).
- Eurostat, non-household electricity prices, second half of 2025, as reported by Cyprus Mail (8 May 2026).
- European Commission, State Aid Scoreboard 2025, as summarised by Lexxion State Aid Post.
- UK Government, Industrial Strategy (June 2025) and Advanced Manufacturing Sector Plan; Energy Institute, New Energy World, on the British Industrial Competitiveness Scheme; Oxygen Finance on sector allocations; Manufacturing Digital, “How is the UK’s Industrial Strategy doing after one year?” (10 July 2026).
- National Audit Office, Investigation into the government’s intervention in British Steel’s Scunthorpe site (March 2026).
- ONS, Index of Production, UK: August 2026; Enginuity, manufacturing sector health check (August 2026); UK manufacturing LFS employment via OECD (FRED LFEAMNTTGBQ647N); D. Turver, “High UK electricity prices continue into 2025”, citing DESNZ.
- Parliamentary Budget Officer of Canada, “Long-term fiscal cost of major economic investment tax credits” (3 July 2024). EnergyNow, “Canada’s electric vehicle gold rush hits the brakes” (9 September 2026).
- Statistics Canada, “Manufacturing labour in 2025” (17 March 2026); real GDP by industry, July 2026 (as reported by BOE Report and Trading Economics); C.D. Howe Institute, Graphic Intelligence on manufacturing output (18 May 2026); LFS manufacturing employment via OECD (FRED LFEAMNTTCAQ647S); OECD MEI manufacturing production (FRED PRMNTO01 series).
- Hydro-Quebec, Comparison of Electricity Prices in Major North American Cities (rates in effect 1 April 2025).
- OECD, Survey of Adult Skills 2023, as tabulated by the Central Statistics Office of Ireland; OECD average annual wages 2024 (USD PPP); World Bank, Doing Business 2020 economy profiles (construction permits), and Regulation Tomorrow for Canada.
- ECB euro reference exchange rates, 2025 annual averages, via Deutsche Bundesbank.
- All data retrieved 24 and 25 October 2026 unless stated otherwise.
Books from Global Strategy Files
Go further on this topic
The Tariff GambleHow America’s trade war is reshaping power, prices and prosperity.24.99 USD, see the book Future-Proofing AmericaEconomic challenges and the road to reform.20 USD, see the book
 Kill KennedyWhat the 2025 declassified files reveal about the machinery of American power.20 USD, see the book
