
Heat, Drought and Rivers: Physical Climate Risk to GDP to 2035

Driss EFFINA, PhD Independent Researcher, Global Strategy Files Foresight, prospective note No. 17, 24 October 2026. Reading time: about 55 minutes
Key takeaways
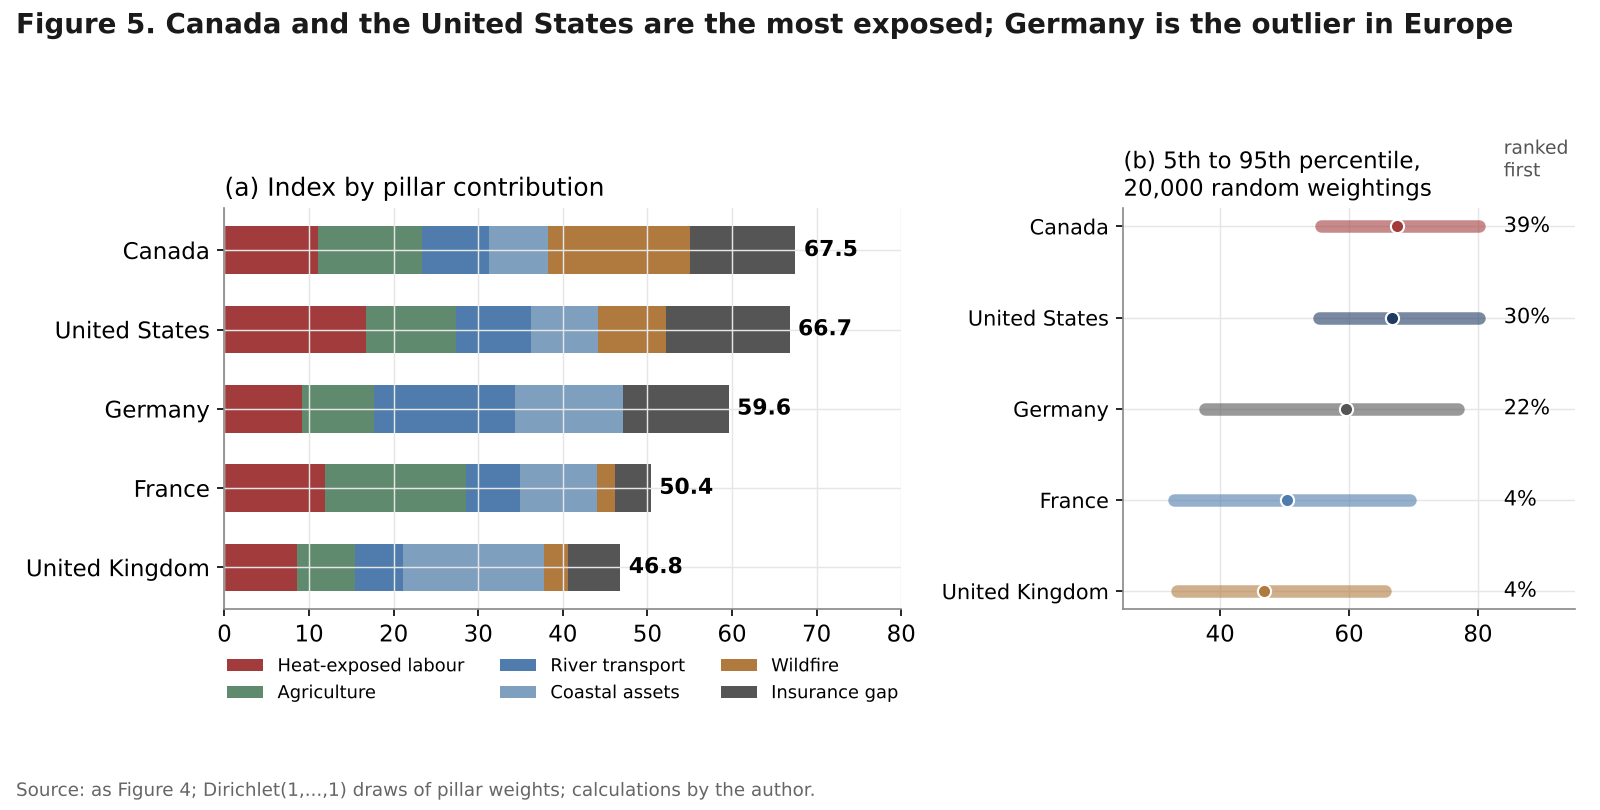
- On a six-pillar Physical Risk Exposure Index (0 to 100), Canada scores 67.5 and the United States 66.7, ahead of Germany (59.6), France (50.4) and the United Kingdom (46.8); Germany stands out in Europe because of its dependence on the Rhine and a 41 percent gap in home natural hazard cover.
- Today’s climate already costs the United States about 0.63 percent of GDP a year; the warming expected to 2035 adds 0.13 percent there and 0.02 to 0.04 percent in the other four, about 63 billion dollars across the five in 2035, with heat on labour the largest new channel.
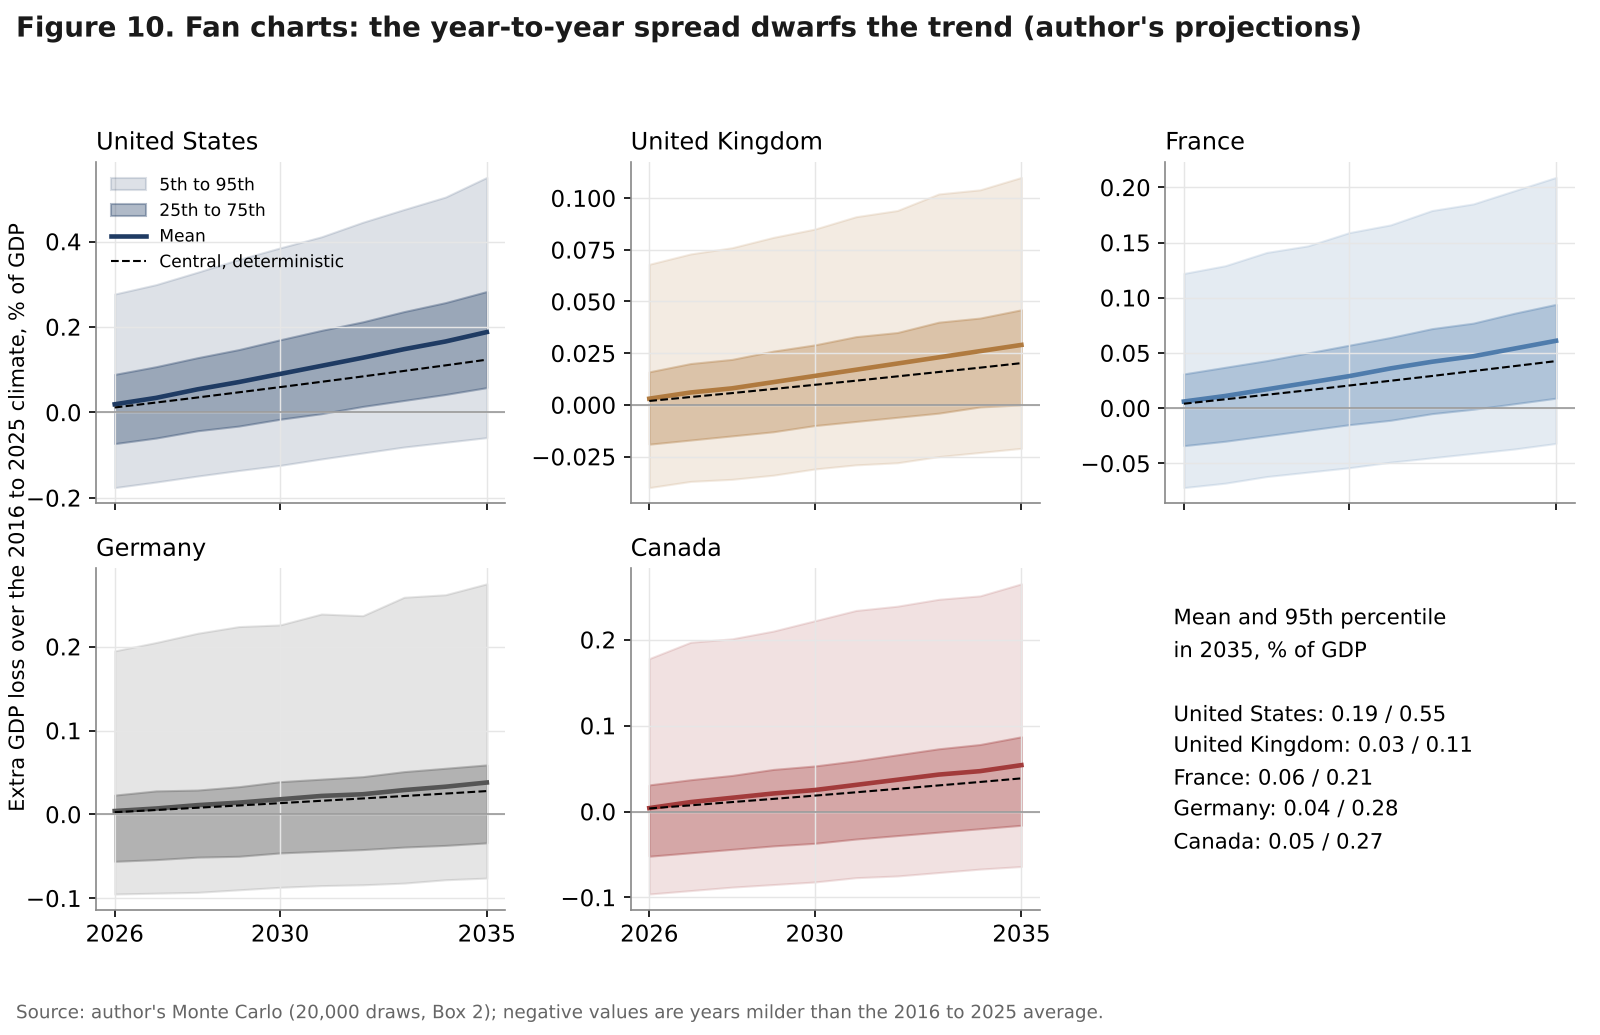
- Year-to-year swings dwarf the trend: the 95th percentile of the extra loss in 2035 is 0.55 percent of GDP in the United States, and a one-in-twenty year would cost the German budget about 0.26 percent of GDP, three times the expected bill.
- Top-down estimates are 60 to 140 times larger than the bottom-up result because they assume persistent losses; the flagship Kotz study was retracted in December 2025. Adaptation of about 98 billion dollars over ten years would avoid about 586 billion dollars of losses.
Abstract
The summer of 2026 gave Europe its clearest lesson yet in physical climate risk. Germany set three national temperature records in three days in late June, France recorded its hottest day since 1947, and in August the Rhine at Kaub fell to 14 centimetres, the lowest reading since records began in 1880, splitting Europe’s busiest inland waterway in two. In North America, Canada had just lived through its second-worst wildfire season in 2025 and the United States counted 23 billion-dollar disasters in the same year, one every ten days. Yet global insured catastrophe losses in the first half of 2026 were 12 percent below their ten-year average, reinsurance prices are falling at the fastest pace since the late 1990s, and the most cited estimate of climate damage to the world economy was retracted by Nature in December 2025. Markets, insurers and macroeconomists are reading the same weather very differently.
This note asks a narrow question with a long tail: what will physical climate risk cost the United States, the United Kingdom, France, Germany and Canada in GDP, public money and financial stability between now and 2035? It builds a Physical Risk Exposure Index of six pillars (heat-exposed labour, agriculture, river-dependent transport, coastal assets, wildfire and the insurance gap), a bottom-up damage engine with four channels calibrated on observed losses, three warming paths with probabilities and a 20,000-draw Monte Carlo, and satellite blocks for budgets, mortgages and adaptation. It sets the result against the published macro estimates, including the corrections of 2025 and 2026, and ends with a dashboard and a dated calendar. All projections and probabilities are the author’s.
Keywords: physical climate risk, climate damage function, heatwave, drought, Rhine low water, wildfire, insurance protection gap, NGFS scenarios, Kotz Levermann Wenz retraction, adaptation, GDP losses 2035
JEL codes: Q54, Q51, E01, H84, G22, G21
Key findings
1. Canada and the United States are the most exposed; Germany is Europe’s outlier. On the author’s Physical Risk Exposure Index (0 to 100), Canada scores 67.5 and the United States 66.7, ahead of Germany (59.6), France (50.4) and the United Kingdom (46.8). Canada or the United States ranks first in 69 percent of 20,000 random weightings. Germany’s score comes from rivers and insurance: it moves 33.5 tonnes of inland waterway freight per million dollars of GDP, about twice the other four, and 41 percent of its homes have no natural hazard cover. 2. Today’s climate already costs far more than the next decade of warming will add. Measured bottom-up, the climate of 2016 to 2025 costs the United States about 0.63 percent of GDP a year (about 196 billion dollars) through heat-reduced labour and disaster damage, against 0.08 to 0.15 percent in the other four. The warming expected to 2035 adds, probability-weighted, 0.13 percent of GDP in the United States and 0.02 to 0.04 percent elsewhere: about 63 billion dollars across the five in 2035 on the central path, 307 billion cumulated over 2026 to 2035. Heat on labour is 56 percent of the increment. 3. The year matters more than the trend. The year-to-year spread of losses is several times the trend. In 2035 the 95th percentile of the extra loss is 0.55 percent of GDP in the United States and 0.21 to 0.28 percent in France, Germany and Canada, four to ten times the central value. A one-in-twenty disaster year would cost the German budget about 0.26 percent of GDP, three times the expected bill. 4. The macro literature and the bottom-up evidence are one to two orders of magnitude apart. Applied to the 0.27 °C of warming expected over 2025 to 2035, the top-down estimate of Bilal and Kaenzig implies an eventual loss of 3.24 percent of GDP and the NGFS Phase V current policies range, scaled pro rata, about 4.0 percent, against 0.05 percent on average in this note’s engine. The flagship study of Kotz, Levermann and Wenz was retracted on 3 December 2025 after data errors; the gap is about persistence, which no one has yet measured convincingly. 5. The danger to budgets and banks runs through insurance, not defaults; adaptation pays. A severe year would cost lenders about 0.01 percent of GDP or less in credit losses in every country, but a 20 to 45 percent repricing of high-risk homes would erase collateral worth 1.0 to 4.5 percent of GDP. The pressure points are public insurers (the US flood programme owes the Treasury 22.5 billion dollars) and coverage gaps. About 98 billion dollars of adaptation spending over 2026 to 2035 at a benefit-cost ratio of six would avoid about 586 billion dollars of losses in present value.
1. Introduction
Climate risk reaches economies in two ways: transition risk, from policies and prices that move capital away from carbon, and physical risk, from the weather itself. In 2026 the second has become the more pressing. Transition policies have been slowed or reversed in several countries, while the physical record keeps getting worse.
The numbers are clear on the trend and ambiguous on the cost. According to the Indicators of Global Climate Change report published in June 2026 (Forster et al., 2026), human-induced warming reached 1.37 °C above 1850 to 1900 in 2025 and is rising at about 0.27 °C per decade, so the 1.5 °C mark should be crossed around 2030. Copernicus measured 1.63 °C in September 2026, the second month in a row above 1.5 °C, with an El Niño strengthening into 2027. But the damage estimates that central banks and supervisors use are in flux. The Network for Greening the Financial System (NGFS) told users in December 2025 to treat its Phase V physical risk numbers with caution after the study underlying its damage function was retracted; the Federal Reserve left the NGFS in January 2025 and, with the FDIC and the OCC, withdrew its climate risk principles for large banks in October 2025; the ECB, by contrast, introduced climate factors into its collateral framework on 15 June 2026, and the Prudential Regulation Authority set out new expectations for banks and insurers in SS5/25 in December 2025.
This note does not try to settle the long-run debate. It asks what can be measured and projected to 2035: how exposed each economy is, through which channels the damage arrives, what the next decade of warming adds, who pays, and what adaptation is worth (Figure 1).
Section 2 reviews the 2025 and 2026 record. Section 3 summarises the macro estimates and their corrections. Section 4 builds the exposure index. Section 5 presents the damage engine and the warming paths, Section 6 the GDP results, Section 7 the sectoral channels. Sections 8 and 9 turn to budgets and to mortgages, Section 10 to adaptation, and Sections 11 to 13 to the dashboard, the implications and the calendar. The energy mix after the Hormuz shock was covered in Foresight No. 8; this note does not repeat it.
2. The record of 2025 and 2026
2.1 Fewer peak events, more secondary perils
Two features stand out in the global loss data (Figure 2). First, the big numbers of 2024 were not repeated. Munich Re put overall natural catastrophe losses at 224 billion dollars in 2025 and insured losses at 108 billion, against 368 and 147 billion in 2024 and a ten-year average of 266 and 107 billion. The first half of 2026 was quieter still: 112 billion dollars overall and 44 billion insured, against ten-year first-half averages of 113 and 50 billion, so insured losses were 12 percent below normal. No major hurricane struck the United States in 2025, and the first hurricane of 2026, Isaias, came ashore near Destin, Florida, on 10 October as a Category 2 storm; Moody’s RMS put insured losses at 2.5 to 4.5 billion dollars with a best estimate of 3.5 billion, KCC at 3 billion and Verisk at 1 to 2 billion.
Second, the composition has shifted towards secondary perils (severe convective storms, floods and wildfires), a record 92 percent of global insured catastrophe losses in 2025 according to the Swiss Re Institute. The Los Angeles wildfires of January 2025 were the costliest insured wildfire on record, about 40 billion dollars insured and 53 billion overall according to Munich Re, and 61.2 billion dollars in the Climate Central count, more than half of the 115 billion dollars of US billion-dollar disasters that year. Swiss Re estimates that North American wildfire insured losses have grown by about 14 percent a year.
The trend is less dramatic than the headlines once exposure is removed. Swiss Re puts long-term growth of insured catastrophe losses at 5 to 7 percent a year and attributes more than 80 percent of the increase in weather-related insured losses between 1970 and 2025 to exposure growth: more and dearer buildings in risky places. That leaves at most about 1.2 percent a year for the hazard itself, a number this note uses to calibrate its damage engine. It also expects 148 billion dollars of insured losses in a normal 2026 and about 320 billion dollars in a peak-loss year.
2.2 Five countries, five stories
United States. NOAA announced in May 2025 that it would stop updating its billion-dollar disaster database; Climate Central relaunched it in October 2025 under Adam Smith, its former lead scientist. On that count the United States had 23 billion-dollar disasters in 2025 (115 billion dollars, 276 lives), 21 of them severe storms, after 27 in 2024 and a record 28 in 2023; the 1980 to 2025 average is nine a year. The 2025 drought in the West was driven mainly by heat rather than lack of rain.
Canada. About 8.9 million hectares burned in 2025, second only to 2023, and more than 75,000 people were evacuated. Insured severe weather losses totalled about 37 billion Canadian dollars over 2016 to 2025, 2.64 times the previous decade.
France and Germany. French insured climate claims reached 5.2 billion euros in 2025, with hail costing 2.2 billion and drought damage to houses through clay shrinkage nearly half of the natural catastrophe regime’s losses. In June 2026 France had its hottest day since 1947 and Germany set three national records in three days. Prognos estimated for Handelsblatt that the German heatwave cost at least 6.3 billion euros in lost productivity; in August the inland shipping association warned that the Rhine would be split in two, and Commerzbank estimated that critically low water through mid-September could cut about 0.35 percentage points from third-quarter GDP.
United Kingdom. Insurers paid a record 6.1 billion pounds of property claims in 2025. By 29 July 2026 seven areas covering 51.4 percent of England were in drought, about 23 million people faced hosepipe restrictions, and subsidence claims reached a record average of 20,000 pounds.
Across the European Union, the European Environment Agency counts 822 billion euros of losses from weather and climate extremes over 1980 to 2024, of which less than 20 percent was insured; the four years 2021 to 2024 averaged 52.1 billion euros and are all among the five worst on record. Usman and colleagues, with economists from the ECB, estimated that the extremes of summer 2025 cost 43 billion euros of output in the short run and could cost 126 billion euros by 2029. The EU’s wildfire season of 2025 burned 1,079,538 hectares, the most since EFFIS records began in 2006.
Table 1. Physical climate events and losses, 2025 and 2026: selected facts
| 2025 | 2026 to date | Reference | |
|---|---|---|---|
| World, insured losses (Munich Re) | USD 108 bn | USD 44 bn (H1) | 10-yr avg USD 107 bn; H1 avg 50 bn |
| United States | 23 billion-dollar events, USD 115 bn | 12 events, USD 31.9 bn (H1); Isaias, USD 1 to 4.5 bn insured | 1980 to 2025 avg: 9 events, USD 67.6 bn |
| Canada | 8.9 m ha burned; CAD 2.4 bn insured | 4.49 m ha burned to 31 Aug; Prairie storms over CAD 1.8 bn | 2023: 17.2 m ha; 2024: CAD 9.4 bn insured |
| France | Insured climate claims EUR 5.2 bn; drought EUR 0.77 to 1 bn | Hottest day since 1947 (23 June) | 2024: EUR 3.9 bn |
| Germany | Insured natural hazard losses EUR 1.4 bn | National records 41.3 to 41.7 °C; Rhine at Kaub 14 cm (11 Aug) | Lowest Rhine reading since 1880 |
| United Kingdom | Property claims GBP 6.1 bn (weather 1.2, subsidence 0.31) | June record 37.7 °C; 51.4% of England in drought (29 July) | Subsidence average claim GBP 20,000 (Q2) |
| European Union | Wildfires 1.08 m ha (record since 2006); summer losses EUR 43 bn | Western Europe’s hottest summer on record (Copernicus) | 2021 to 2024 avg losses EUR 52.1 bn |
Sources: Munich Re; Climate Central; Moody’s RMS, KCC, Verisk; Environment and Climate Change Canada; CatIQ and IBC; France Assureurs; CCR via Banque des Territoires; Prognos and Handelsblatt; Reuters; ABI; Environment Agency; EEA; EFFIS and JRC; Usman et al. (2025); Copernicus.
To compare countries, this note needs a common measure of recent direct losses as a share of GDP. Figure 3 builds one from the best national source in each case: the average of 2022, 2024 and 2025 in the Climate Central count for the United States (160.4 billion dollars, 0.52 percent of GDP); insured losses in Canada over 2016 to 2025 grossed up by the 2025 ratio of total to insured losses (5.24 billion Canadian dollars, 0.16 percent); the EEA’s per capita losses for France in 2022 and 2023 (4.37 billion euros, 0.15 percent); a German national study that found at least 145 billion euros of losses over 2000 to 2021 (6.59 billion a year, 0.15 percent); and British weather and subsidence claims grossed up for an assumed 60 percent insured share (2.51 billion pounds, 0.08 percent). The sources differ, so the ranking matters more than the decimals: the United States carries a direct loss burden three to six times larger than the others relative to GDP.
A first look at the results
The full note goes much further, with original models, scenarios and a dashboard of leading indicators. Two of its 14 charts and diagrams are shown below.
Continue reading
Get the full note: 26 pages, 14 charts and diagrams, 14 tables
This page shows the first part of the note. The full PDF adds: what the macro literature says, and what has been corrected; a Physical Risk Exposure Index; the damage engine and three warming paths; GDP losses to 2035; sectoral channels; fiscal costs: disaster relief and public insurance backstops; financial stability: mortgages in flood and fire zones; adaptation: investment needs and returns; leading-indicators dashboard.
29 USD, instant PDF download, secure card payment.
Buy the full noteNeed this analysis for your organisation?
We prepare confidential briefings, executive talks and studies on countries, markets and policies, built on the same method as this article.
Request a briefingSupport independent analysis
Our studies are free to read and carry no advertising. If this one was useful, a small contribution helps us publish the next.
Support our workGo further: books by Global Strategy Files

Frequently asked questions
What is physical climate risk?
Physical climate risk is the economic and financial damage caused by the weather itself rather than by climate policy. It includes acute events such as floods, storms and wildfires that destroy capital, and chronic changes such as heat that reduces working hours, droughts that cut harvests and low rivers that disrupt freight. It reaches the economy through output, prices, public budgets, insurance and the value of homes and other collateral.
How much will climate change cost GDP by 2035?
Measured bottom-up in this note, the extra warming expected between 2025 and 2035 lowers GDP in 2035 by about 0.13 percent in the United States and 0.02 to 0.04 percent in the United Kingdom, France, Germany and Canada, probability-weighted. The climate of 2016 to 2025 already costs the United States about 0.63 percent of GDP a year. Top-down models that assume permanent growth effects give losses one to two orders of magnitude larger.
Why was the Kotz, Levermann and Wenz climate damage study retracted?
The Nature paper of April 2024, which estimated a 19 percent loss of world income by mid-century, was retracted on 3 December 2025 after errors were found in economic data for Uzbekistan for 1995 to 1999 and concerns were raised about its statistical uncertainty. The authors said the errors were too large for a correction. The NGFS, which used the paper in its Phase V scenarios, asked users to take the retraction into account.
Which country is most exposed to physical climate risk?
On the author’s Physical Risk Exposure Index, Canada (67.5 out of 100) and the United States (66.7) are the most exposed of the five, because of wildfire, heat on outdoor labour and large insurance gaps. Germany (59.6) is the most exposed in Europe because of its reliance on Rhine freight and the 41 percent of homes without natural hazard cover. France (50.4) and the United Kingdom (46.8) score lower thanks to stronger insurance schemes.
Sources
Data retrieved on or before 24 October 2026.
- IMF, World Economic Outlook database, October 2026 (NGDPD, NGDP_RPCH); file imf_weo_oct2026.txt.
- World Bank, World Development Indicators: SP.POP.TOTL, SP.POP.1564.TO, NV.IND.MANF.ZS; agriculture value added and employment shares (via Destatis international table and World Bank modelled ILO estimates); EN.POP.EL5M.ZS (via IndexMundi).
- BIS, credit to households via FRED: QUSHAM770A, QGBHAM770A, QFRHAM770A, QDEHAM770A, QCAHAM770A.
- NOAA NCEI, Global Component of Climate at a Glance, via datasets/global-temp (GitHub), annual.csv.
- Forster, P. M. et al. (2026), “Indicators of Global Climate Change 2025”, Earth System Science Data 18; Copernicus press release, 11 June 2026.
- Copernicus Climate Change Service, “Second-warmest September”, October 2026.
- WMO, Global Annual to Decadal Climate Update 2026 to 2035 (Met Office, 2026).
- Munich Re, “Natural disaster figures 2025” (January 2026) and NatCat HY 2026 factsheet (July 2026).
- Swiss Re Institute, sigma 1/2026, “Natural catastrophes in 2025” and press release (April 2026).
- Climate Central, “2025 in review” and mid-year billion-dollar disasters 2026; Grist and WGME reports.
- Hurricane Isaias loss estimates (Moody’s RMS, KCC, Verisk), October 2026.
- Environment and Climate Change Canada, Canada’s top ten weather stories of 2025; Wikipedia summary of 2026 Canadian wildfires (CIFFC data); CatIQ and IBC press releases (January 2026; July and September 2026).
- France Assureurs via L’Info Durable (2025 climate claims); Banque des Territoires (2025 drought, CCR); MACIF (Cat Nat surcharge).
- Clean Energy Wire on Prognos for Handelsblatt (July 2026); Kiel Institute via Clean Energy Wire (June 2023); Reuters via Insurance Journal and gCaptain (August 2026); Destatis via Eurotransport (March 2026).
- ABI, “Adverse weather pushes property insurance payouts to 6.1 billion in 2025”; Insurance Business UK (October 2026); ITV (July 2026); Environment Agency flood risk assessment via Digital Insurance (December 2024).
- LSE Grantham Research Institute, “Climate change’s heat tax on the UK’s labour force and economy” (July 2026).
- Lancet Countdown, country data sheets for the United States (2024), Germany (2024), France (2025) and Canada (2025).
- European Environment Agency, “Economic losses from weather- and climate-related extremes” and country pages; Euronews (July 2025).
- University of Mannheim, Usman et al. (2025), summer 2025 extreme weather losses; JRC and EFFIS, 2025 wildfire season; Copernicus European State of the Climate 2025.
- Kotz, M., Levermann, A. and Wenz, L. (2024), “The economic commitment of climate change”, Nature 628, retracted 3 December 2025; NGFS statement regarding physical risk estimates (3 December 2025); NGFS Phase V press release (5 November 2024).
- Bilal, A. and Kaenzig, D. R. (2024), “The macroeconomic impact of climate change: global vs. local temperature”, NBER Working Paper 32450.
- Zhao, C. et al. (2017), “Temperature increase reduces global yields of major crops in four independent estimates”, PNAS 114(35).
- ECB Blog, “Has the heatwave been driving you nuts?” (13 July 2025) and “Climate factors” (7 July 2026); ECB Banking Supervision, 2022 climate risk stress test results (8 July 2022).
- Bank of England, Results of the 2021 Climate Biennial Exploratory Scenario (May 2022); PRA SS5/25 (December 2025).
- Federal Reserve press release, 17 January 2025 (NGFS withdrawal); ESG Today (October 2025, withdrawal of climate principles).
- Allianz Trade, extreme heat report, via Euronews (19 June 2026).
- EIOPA, Dashboard on insurance protection gap for natural catastrophes, “in a nutshell” (2023); GDV via experten.de (June 2026); ZDF (May 2025); Bundestag hib 268/2026.
- Federal Reserve Bank of Richmond, Economic Brief 26-22 (July 2026); CFPB, Flood Risk and Mortgages (January 2025); First Street via HousingWire (February 2025); US Senate Budget Committee, “Next to Fall” (December 2024).
- California Department of Insurance, FAIR Plan release (3 August 2026); Guy Carpenter via Artemis (June 2026).
- CRS, “National Flood Insurance Program Borrowing Authority” (March 2026) and “Disaster Relief Fund State of Play” (March 2026); NAHB (September 2026); IA Magazine (October 2025); Carrier Management (March 2026); NLC (May 2026); Spectrum News (July 2026); OMB, “Quantifying Risks to the Federal Budget from Climate Change” (April 2022).
- Bundestag, Aufbauhilfe 2021; Defra (June 2025); National Flood Forum (Flood Re); HSF Kramer on PNACC-3 (March 2025).
- National Institute of Building Sciences, Mitigation Saves; Canadian Climate Institute, “The GDP costs of climate change for Canada” (2022); European Commission, adaptation investment needs assessment via CMCC (January 2026); European Parliament Legislative Train (climate resilience).
- American Farm Bureau Federation (September 2023); FRED WATERBORNE; VNF via ADIRA (July 2026); St. Lawrence Seaway tonnage 2025; DfT domestic waterborne freight 2024.
- NIFC, Total wildland fires and acres; German federal forest fire statistics 2025 (June 2026); EFFIS via L’Info Durable; Wikipedia, 2025 United Kingdom wildfires (EFFIS); Wikipedia, 2026 European heatwaves; 2026 United Nations Climate Change Conference.
- ECB and Bundesbank, euro reference rates, 2025 annual averages.
Books from Global Strategy Files
Go further on this topic
The Tariff GambleHow America’s trade war is reshaping power, prices and prosperity.24.99 USD, see the book Future-Proofing AmericaEconomic challenges and the road to reform.20 USD, see the book
 Kill KennedyWhat the 2025 declassified files reveal about the machinery of American power.20 USD, see the book
