
Who Absorbs the Shock: Corporate Margins versus Price Pass-Through in Five Economies, 2026

Driss EFFINA, PhD Independent Researcher, Global Strategy Files Decoded, analysis note No. 22, 24 October 2026. Reading time: about 55 minutes
Key takeaways
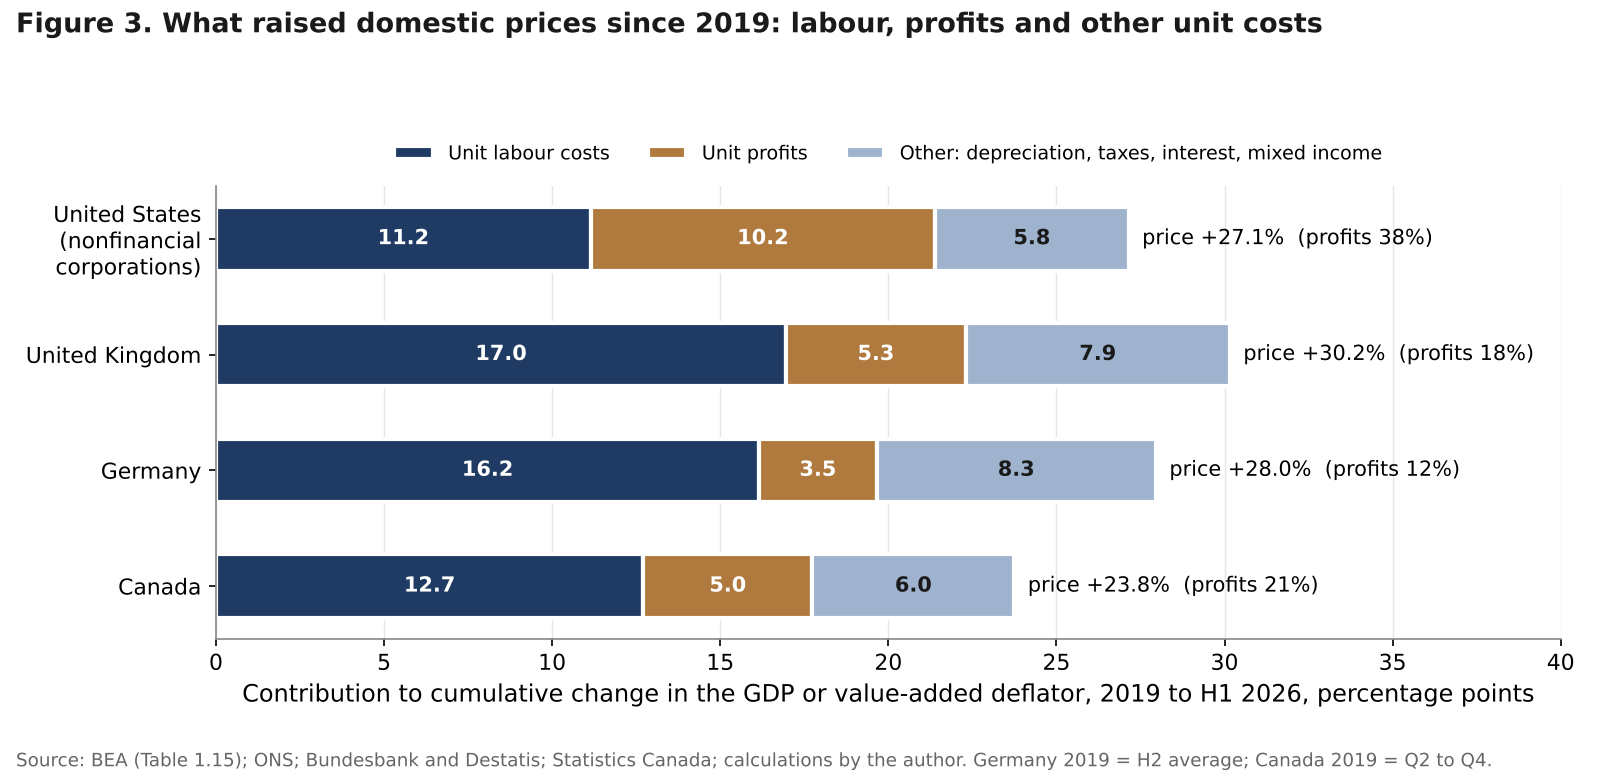
- Outside France, firms did not absorb the first half of the 2026 shock: unit profits explained all of the 2.15 percent rise in the US nonfinancial corporate price since the war, 73 percent of Canada’s deflator rise, 68 percent of Germany’s and 64 percent of the UK’s.
- The gain is an energy transfer: US refiners’ profits rose from 32.4 to 155.5 billion dollars at an annual rate, and 13.7 of Canada’s 15.3 billion dollar rise in nonfinancial profits came from energy.
- Downstream pass-through is far weaker than in 2022: the producer price ratio fell from 0.80 to 0.55 in the UK, 0.86 to 0.50 in France and 0.83 to 0.50 in Germany, and a net 62 percent of UK firms expect lower margins.
- European cushions are thin: profit shares are below their 2019 norm in the UK and Germany, and the author puts the probability that margins touch their recent floor before end-2027 at 48 percent in France, 36 percent in the UK and 22 percent in Germany.
Abstract
Every energy shock is a loss of real income that someone has to carry. Firms can pass the higher cost of energy into their selling prices, in which case households pay through inflation, or they can absorb it in their margins, in which case owners, workers and investment pay later. This note measures that split for the United States, the United Kingdom, France, Germany and Canada in the 2026 shock, which began with the war involving Iran at the end of February and took Brent from 69 dollars a barrel on average in 2025 to 117 dollars in April and 127 dollars in October 2026. It decomposes the GDP deflator, or the value-added price of nonfinancial corporations, into unit labour costs, unit profits and other unit costs from 2019 to mid-2026; compares 2022 and 2026; separates energy producers from energy users; builds pass-through ratios; reads firm surveys; constructs a margin cushion indicator; and projects profit shares to the end of 2027 under four scenarios with probabilities. The answer is uneven. In the first half of 2026 aggregate corporate margins did not absorb the shock anywhere except in France: unit profits explained most of the rise in domestic prices in North America and, more surprisingly, in Germany. But the aggregate hides a transfer from energy users to energy producers, a clear fall in downstream pass-through compared with 2022, and European margins that entered the shock below their 2019 norm. Because hedges delay the cost hit by one to three quarters, the absorption phase in Europe lies ahead, not behind. All projections and scenarios are the author’s.
Keywords: profit margins, unit profits, unit labour costs, GDP deflator, pass-through, energy shock, greedflation, profit share, producer prices, Decision Maker Panel, ifo, SAFE, taux de marge
Key findings
1. Outside France, firms did not absorb the first half of the shock; they gained. Between the fourth quarter of 2025 and the second quarter of 2026, unit profits accounted for all of the 2.15 percent rise in the US nonfinancial corporate price, 73 percent of Canada’s 3.71 percent rise in the GDP deflator, 68 percent of Germany’s 1.17 percent and 64 percent of the United Kingdom’s 1.08 percent. The US nonfinancial profit share reached 18.8 percent of value added, the highest since at least 2018. Only French firms absorbed: the margin rate of nonfinancial corporations fell from 32.5 to 31.5 percent, which Insee attributes to the terms-of-trade loss.
2. The profit gain is an energy transfer, not a broad profit-led inflation. US profits of petroleum and coal manufacturers rose from 32.4 to 155.5 billion dollars at an annual rate in two quarters, 41 percent of the gain across eight major sectors. In Canada, 13.7 billion of the 15.3 billion dollar quarterly rise in nonfinancial operating profits came from oil and gas, refining, pipelines and fuel retail; the rest of the nonfinancial economy gained 1.6 billion. In 2022, unit profits explained 13 percent of the US price increase and 25 percent of Canada’s; in the first half of 2026, 60 and 57 percent.
3. Downstream pass-through is markedly weaker than in 2022. The ratio of downstream to upstream producer price inflation fell from 0.80 to 0.55 in the United Kingdom, from 0.86 to 0.50 in France, from 0.83 to 0.50 in Germany and from 0.51 to 0.45 in the United States. In UK chemicals it fell from 1.05 to 0.62 and in metals and machinery from 0.94 to 0.64, while refiners kept a ratio above 1. Euro area firms expect selling prices to rise 3.2 percent and non-labour costs 5.2 percent; a net 62 percent of UK firms expect lower margins. Pricing intentions in surveys are at 40 to 60 percent of their 2022 readings.
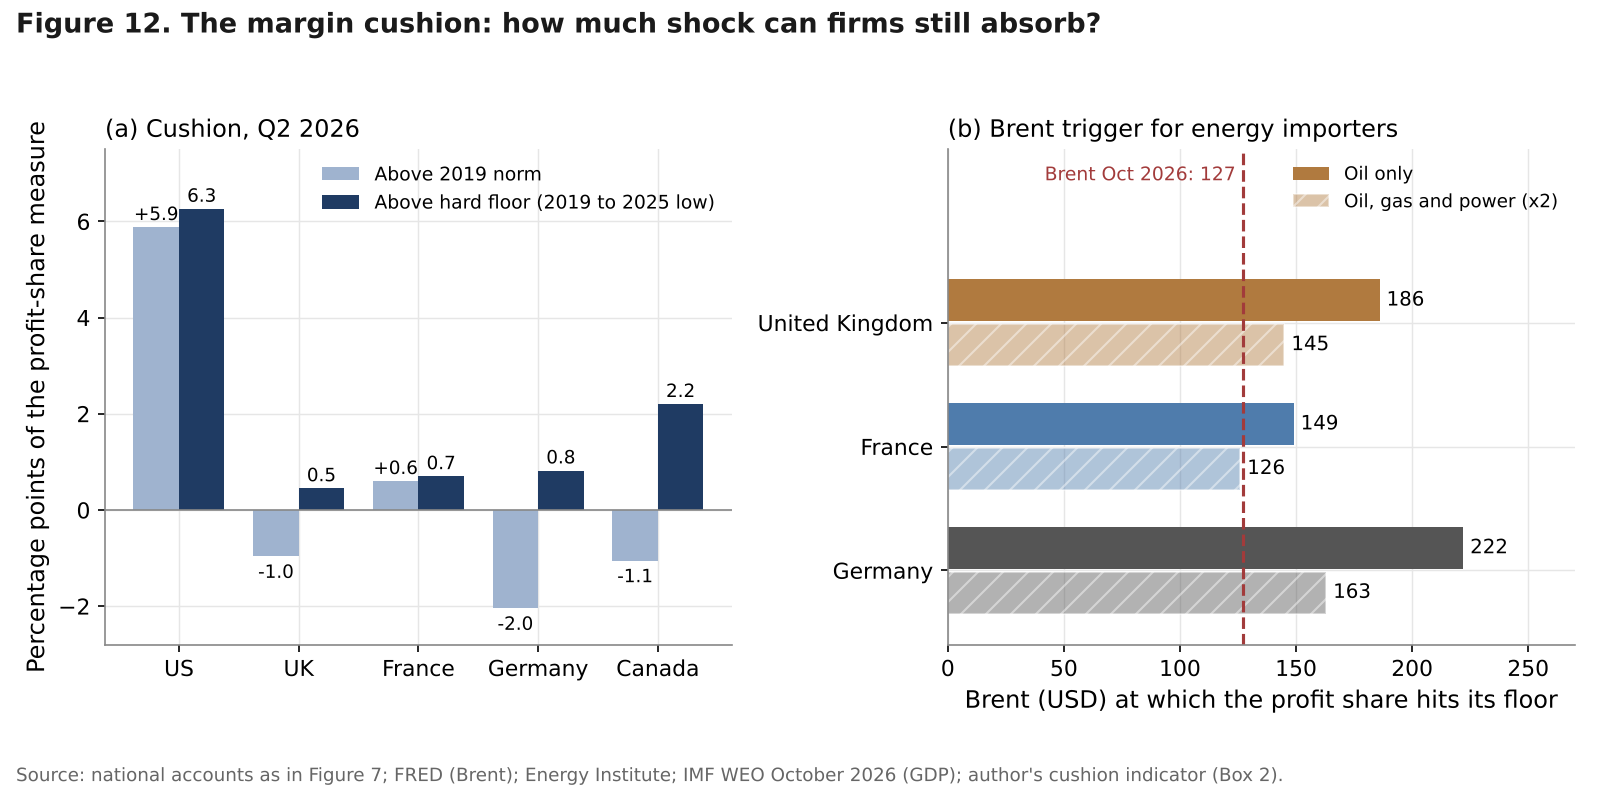
4. European margins have little cushion left. In the second quarter of 2026 the profit share stood 1.0 point below its 2019 norm in the United Kingdom, 2.0 points below in Germany and 1.1 points below in Canada, against 5.9 points above in the United States and 0.6 points above in France. The distance to the 2019 to 2025 low is 0.45 points in the United Kingdom, 0.7 in France and 0.8 in Germany. On the author’s margin cushion indicator, French firms would reach that floor with Brent at about 149 dollars, or about 126 dollars if gas and power double the oil cost base, against 127 dollars in October.
5. The absorption phase in Europe is ahead. In the author’s deferred-absorption model, with a probability-weighted Brent of 88 dollars at the end of 2027, the probability that the profit share touches its hard floor before the end of 2027 is 48 percent in France, 36 percent in the United Kingdom, 22 percent in Germany, 13 percent in Canada and close to zero in the United States. Energy costs absorbed but not yet passed on amount to 0.25 to 0.55 points of consumer prices in the central scenario: a second, smaller pass-through wave in the first half of 2027 that central banks should expect, while in the United States the issue is profit-led pricing rather than a squeeze.
1. Introduction: the question every energy shock asks
When the price of energy rises, a country that imports energy becomes poorer. That loss is fixed by the terms of trade; what is not fixed is who carries it. The first incidence falls on firms that buy energy as an input. They can raise their prices, which moves the loss to households through inflation. They can keep prices and accept a lower margin, which moves the loss to their owners and, if the squeeze lasts, to workers and investment. Governments can step in with subsidies or tax cuts and move part of the loss to future taxpayers. And in countries that produce energy, a share of the loss is not a loss at all but a transfer to oil companies and refiners.
The 2022 episode taught central banks to look at this split closely. Research at the European Central Bank found that unit profits had made an unusually large contribution to domestic inflation in 2022, and a debate on “greedflation” followed. This note asks the same question of 2026, with a different starting point: firms entered this shock with margins that had been eroded in Europe, demand that was weaker, and hedges that delay the cost. The question matters now because the answer decides the shape of inflation in 2027. If firms have absorbed the shock, there is pressure still to come, either in prices or in jobs. If they have passed it on, inflation has peaked but households have paid.
The note does not repeat earlier work in this series. Decoded No. 3 dealt with wages and second-round effects, Decoded No. 4 with who gained from US economic policy, Decoded No. 13 with the combination of tariffs and oil in North American supply chains, and Decoded No. 16 with diesel. Here the object is the margin itself: how it moved in national accounts, what producer prices and surveys say about the next step, and how much room is left.
Sections 2 and 3 set out the framework and the shock; Sections 4 to 6 decompose prices and profits; Sections 7 and 8 read producer prices and surveys; Section 9 builds the margin cushion; Section 10 gives scenarios to the end of 2027; Sections 11 to 13 give a dashboard, implications and a calendar.
2. Framework: four channels and three measures
Figure 1 sets out the channels. An energy shock reaches the economy through three doors: energy producers and refiners, whose revenues rise at once; energy-using firms, whose costs rise with a delay that depends on hedges and contracts; and governments, which may cut taxes or pay subsidies. Energy-using firms then choose between pass-through and absorption. Pass-through ends with households, through higher consumer prices and lower real wages. Absorption ends with firms’ owners first, through lower profits, and with workers and investment later. The producer channel ends as a transfer from households and firms to the owners of energy assets.
Three measures capture the split, and this note uses all of them.
National accounts. The GDP deflator, or a sector’s value-added price, is the sum of unit labour costs, unit profits and other unit costs. If firms absorb an energy cost increase, unit profits fall; if they pass through more than the cost, unit profits rise. For an energy importer, imported energy is not part of value added: a shock passed on shows up as consumer prices rising faster than the GDP deflator, a shock absorbed as a fall in the profit share.
Producer prices. The ratio of downstream to upstream price inflation gives a cruder but monthly reading of pass-through, by product, up to September 2026.
Surveys. Firms’ pricing intentions and cost expectations tell us what they intend to do once hedges roll off.
A first look at the results
The full note goes much further, with original models, scenarios and a dashboard of leading indicators. Two of its 14 charts and diagrams are shown below.
Continue reading
Get the full note: 26 pages, 14 charts and diagrams, 8 tables
This page shows the first part of the note. The full PDF adds: the 2026 shock in numbers; decomposing domestic prices, 2019 to mid-2026; 2022 versus 2026: a different kind of shock; inside profits: levels, energy winners and energy users; pass-through ratios by country and sector; what firms say, and how they choose; the margin cushion: how much shock can firms still absorb?; scenarios to the end of 2027; a dashboard of leading indicators.
29 USD, instant PDF download, secure card payment.
Buy the full noteNeed this analysis for your organisation?
We prepare confidential briefings, executive talks and studies on countries, markets and policies, built on the same method as this article.
Request a briefingSupport independent analysis
Our studies are free to read and carry no advertising. If this one was useful, a small contribution helps us publish the next.
Support our workGo further: books by Global Strategy Files

Frequently asked questions
Are corporate profits driving inflation in 2026?
In the national accounts for the first half of 2026, unit profits explain most of the rise in domestic prices in the United States, Canada and Germany. But much of the gain is an energy transfer to oil producers and refiners: US petroleum and coal profits rose almost fivefold in two quarters. Energy-using firms pass through less of their costs than in 2022, so profit-led inflation is concentrated in energy rather than broad-based, except partly in the United States.
How much of the 2026 energy shock are firms passing on to consumers?
Producer prices suggest about half. The ratio of downstream to upstream price inflation fell from 0.80 in 2022 to 0.55 in the United Kingdom, from 0.86 to 0.50 in France and from 0.83 to 0.50 in Germany. Euro area firms expect selling prices to rise 3.2 percent against 5.2 percent for non-labour costs, and a net 62 percent of UK firms expect lower margins.
Which countries’ firms have the least margin cushion in 2026?
France, the United Kingdom and Germany. In the second quarter of 2026 the profit share was 1.0 point below its 2019 norm in the United Kingdom and 2.0 points below in Germany, and France’s margin rate fell a full point to 31.5 percent. Distances to recent lows are only 0.45 to 0.8 points. US nonfinancial firms, by contrast, have a profit share 5.9 points above 2019.
Will energy costs push inflation up again in 2027?
Probably a little in Europe. Because hedges delay the cost hit by one to three quarters, firms have absorbed costs they have not yet passed on: about 0.25 to 0.42 points of consumer prices in the United Kingdom, Germany and France in the author’s central scenario. Part of this is likely to reach prices in the first half of 2027, the rest to fall on margins and jobs.
Sources
- US Bureau of Economic Analysis: “GDP (Third Estimate), Industries, Corporate Profits (Revised), State GDP and State Personal Income, 2nd Quarter 2026” (30 September 2026); “GDP (Second Estimate) and Corporate Profits (Preliminary), 2nd Quarter 2026” (26 August 2026); NIPA Tables 1.15 and 6.16D via FRED.
- FRED series: A455RD3Q052SBEA, A460RD3Q052SBEA, A456RD3Q052SBEA, W330RD3Q052SBEA, A463RD3Q052SBEA, A466RD3Q052SBEA, A455RC1Q027SBEA, N400RC1Q027SBEA, N401RC1Q027SBEA, N402RC1Q027SBEA, N403RC1Q027SBEA, N404RC1Q027SBEA, N414RC1Q027SBEA, N415RC1Q027SBEA, N417RC1Q027SBEA, N419RC1Q027SBEA, DCOILBRENTEU, CPIAUCSL, CPILFESL, FEDFUNDS, ECBDFR. Retrieved 20 to 24 October 2026.
- US Bureau of Labor Statistics: Producer Price Indexes, September 2026 (15 October 2026) and June 2022 (14 July 2022).
- Office for National Statistics: GDP quarterly national accounts, April to June 2026 (30 September 2026), series YBHA, ABMI, DTWM, CGBZ; GDP first quarterly estimate, April to June 2026 (13 August 2026); Profitability of UK companies, April to June 2025 (28 November 2025) and release calendar; Producer price inflation, September 2026 including services (21 October 2026) and July 2022; CPI and labour market series D7G7, DKO8, KAI9.
- Deutsche Bundesbank: Saisonbereinigte Wirtschaftszahlen, tables II.1, II.3 and II.4 (August and September 2026); Monatsbericht October 2026, statistical section, table on national accounts (source: Destatis).
- Destatis: press releases on GDP, 2nd quarter 2026 (30 July 2026, via DATEV); producer prices, September 2026 (20 October 2026, No. 373) and September 2022 (via Tichys Einblick).
- Insee: Informations Rapides, comptes nationaux trimestriels, resultats detailles, 1st and 2nd quarters 2026; Insee Premiere No. 2105, “Les comptes de la Nation en 2025” (29 May 2026) and No. 1997 (May 2024); Note de conjoncture, “Resultats des entreprises” (March 2024 and 24 March 2026); prix de production de l’industrie, August 2026 (30 September 2026) and September 2022; quarterly GDP series 010565707 via fgeerolf.com.
- Statistics Canada, The Daily: Gross domestic product, income and expenditure (2 March 2021, 1 March 2022, 28 February 2023, 31 May 2024, 30 May 2025, 29 May 2026, 28 August 2026), Tables 36-10-0103-01 and 36-10-0104-01; Industrial product and raw materials price indexes, July 2026 (20 August 2026) and June 2022 (20 July 2022); Quarterly financial statistics for enterprises, second quarter 2026, as reported by HRD Canada (25 August 2026).
- Eurostat household saving rate and business profit share, second quarter 2026, via Eunews (2 October 2026) and MTA; Eurostat HICP series.
- European Central Bank: Economic Bulletin, Issue 5/2026 (6 August 2026); Survey on the Access to Finance of Enterprises, round 39 (20 July 2026); P. R. Lane, Richard Cantillon Lecture (11 September 2026), with the September 2026 staff projections; I. Schnabel, “Monetary policy in a world of overlapping shocks” (30 September 2026); ECB wage tracker release (16 September 2026); Governing Council meeting calendar.
- Bank of England: Monetary Policy Report, July 2026; Decision Maker Panel monthly data (October 2022, February 2026, June 2026); DMP September 2026 via Newsquawk (2 October 2026); MPC dates for 2026 and 2027.
- P. Bunn, N. Bloom, P. Mizen, G. Thwaites and I. Yotzov, “How UK firms are responding to the war in Iran: Early evidence from the Decision Maker Panel”, VoxEU (11 May 2026).
- Banque de France: Projections macroeconomiques intermediaires, septembre 2026 (15 September 2026); Enquete mensuelle de conjoncture debut octobre 2026 (12 October 2026).
- Bank of Canada: Business Outlook Survey, third quarter 2026 (19 October 2026), as reported by MPA Magazine; schedules of policy announcements for 2026 and 2027; Valet API series V39079 and CPI.
- ifo Institute price expectations, as reported by retail-news.de (April and June 2026), Interior Daily (1 July 2026), QNA (1 September 2026) and Tageskarte (29 October 2022).
- NFIB Small Business Economic Trends, September 2026 (via NewKerala, 13 October 2026) and January 2022 (via Fox News, 9 February 2022). CFIB Business Barometer, September 2026 (24 September 2026).
- Federal Reserve Board: October 2026 calendar; FOMC meeting calendar via MNI.
- Energy Institute, Statistical Review of World Energy 2026, via Rigzone (3 July 2026); Wikipedia, “List of countries by oil consumption” (retrieved October 2026), for approximate consumption in four countries.
- IMF World Economic Outlook database, October 2026 (NGDPD, NGDP_RPCH).
- Global Strategy Files: Decoded No. 3, 4, 13, 16 and 17 (cross-references only). Data retrieved 20 to 24 October 2026.
Books from Global Strategy Files
Go further on this topic
The Tariff GambleHow America’s trade war is reshaping power, prices and prosperity.24.99 USD, see the book Future-Proofing AmericaEconomic challenges and the road to reform.20 USD, see the book
 Kill KennedyWhat the 2025 declassified files reveal about the machinery of American power.20 USD, see the book
