
The War Premium on Trade: What Hormuz, the Red Sea and the Black Sea Add to Freight, Insurance and Prices

Driss EFFINA, PhD Independent Researcher, Global Strategy Files Decoded, analysis note No. 23, 24 October 2026. Reading time: about 55 minutes
Key takeaways
- The war premium sits in tankers and insurance: VLCC earnings reached 805,000 dollars a day in October, Gulf-Far East crude freight rose from 1.73 to about 33 dollars a barrel, and Hormuz war cover costs about 6 dollars a barrel at mid-point quotes.
- In containers, direct war costs (mostly fuel) explain 38 percent of the 1,580 dollar rise in Shanghai-Rotterdam rates since 5 March and only 4 to 6 percent of the transpacific surge, which reflects capacity management, Panama restrictions and demand timing.
- War-risk premiums are regressive: the same quote is 0.13 percent of a mid-value container cargo through Bab el-Mandeb but 16 percent of a grain cargo calling in the Gulf; the Cape detour costs carriers about the same as Suez but costs cargo owners up to 1,364 dollars per box.
- Freight adds 0.2 to 0.6 percentage points to 2027 consumer price inflation in the five economies on the author’s model, peaking in mid to late 2027, and 67 to 87 percent of that effect is locked in even if rates collapse.
Abstract
Eight months after the war involving Iran began, moving goods by sea carries a premium that did not exist in February. Hormuz saw 13 crossings on 4 October against 130 to 135 a day before the war; insurers quote 6 to 10 percent of hull value per transit, about forty times the pre-war rate; Saudi-linked ships face a Houthi blockade in the Red Sea; Black Sea tanker earnings hit their highest since 2008; and sanctions cover 1,226 tankers. This note measures what the premium costs, where it lands and how much reaches consumer prices in the United States, the United Kingdom, France, Germany and Canada. It builds five tools: a cost-build model that splits container rate increases into fuel, insurance, routing and a residual; an insurance calculator per barrel, per container and per unit of cargo value; a Suez versus Cape comparison; a calibration of freight into import prices; and a lagged pass-through model of consumer prices, run under four scenarios to the end of 2027. The central result is that the war premium is large, but it is not where the headlines put it. It sits in tankers, bulk and insurance, where long-haul crude freight now equals about a quarter of the crude price. In containers, direct war costs explain about two-fifths of the rise in Asia-Europe rates and less than a tenth of the transpacific surge, which is driven by capacity management, the Panama Canal and the timing of demand. For consumers, the effect of freight is mostly a 2027 story, and most of it is already locked in.
Keywords: shipping costs, war-risk insurance, freight rates, Strait of Hormuz, Red Sea, Black Sea, Suez Canal, Cape of Good Hope, tanker rates, container rates, import prices, inflation pass-through, sanctions
JEL codes: F14, R41, E31, G22, Q43
Key findings
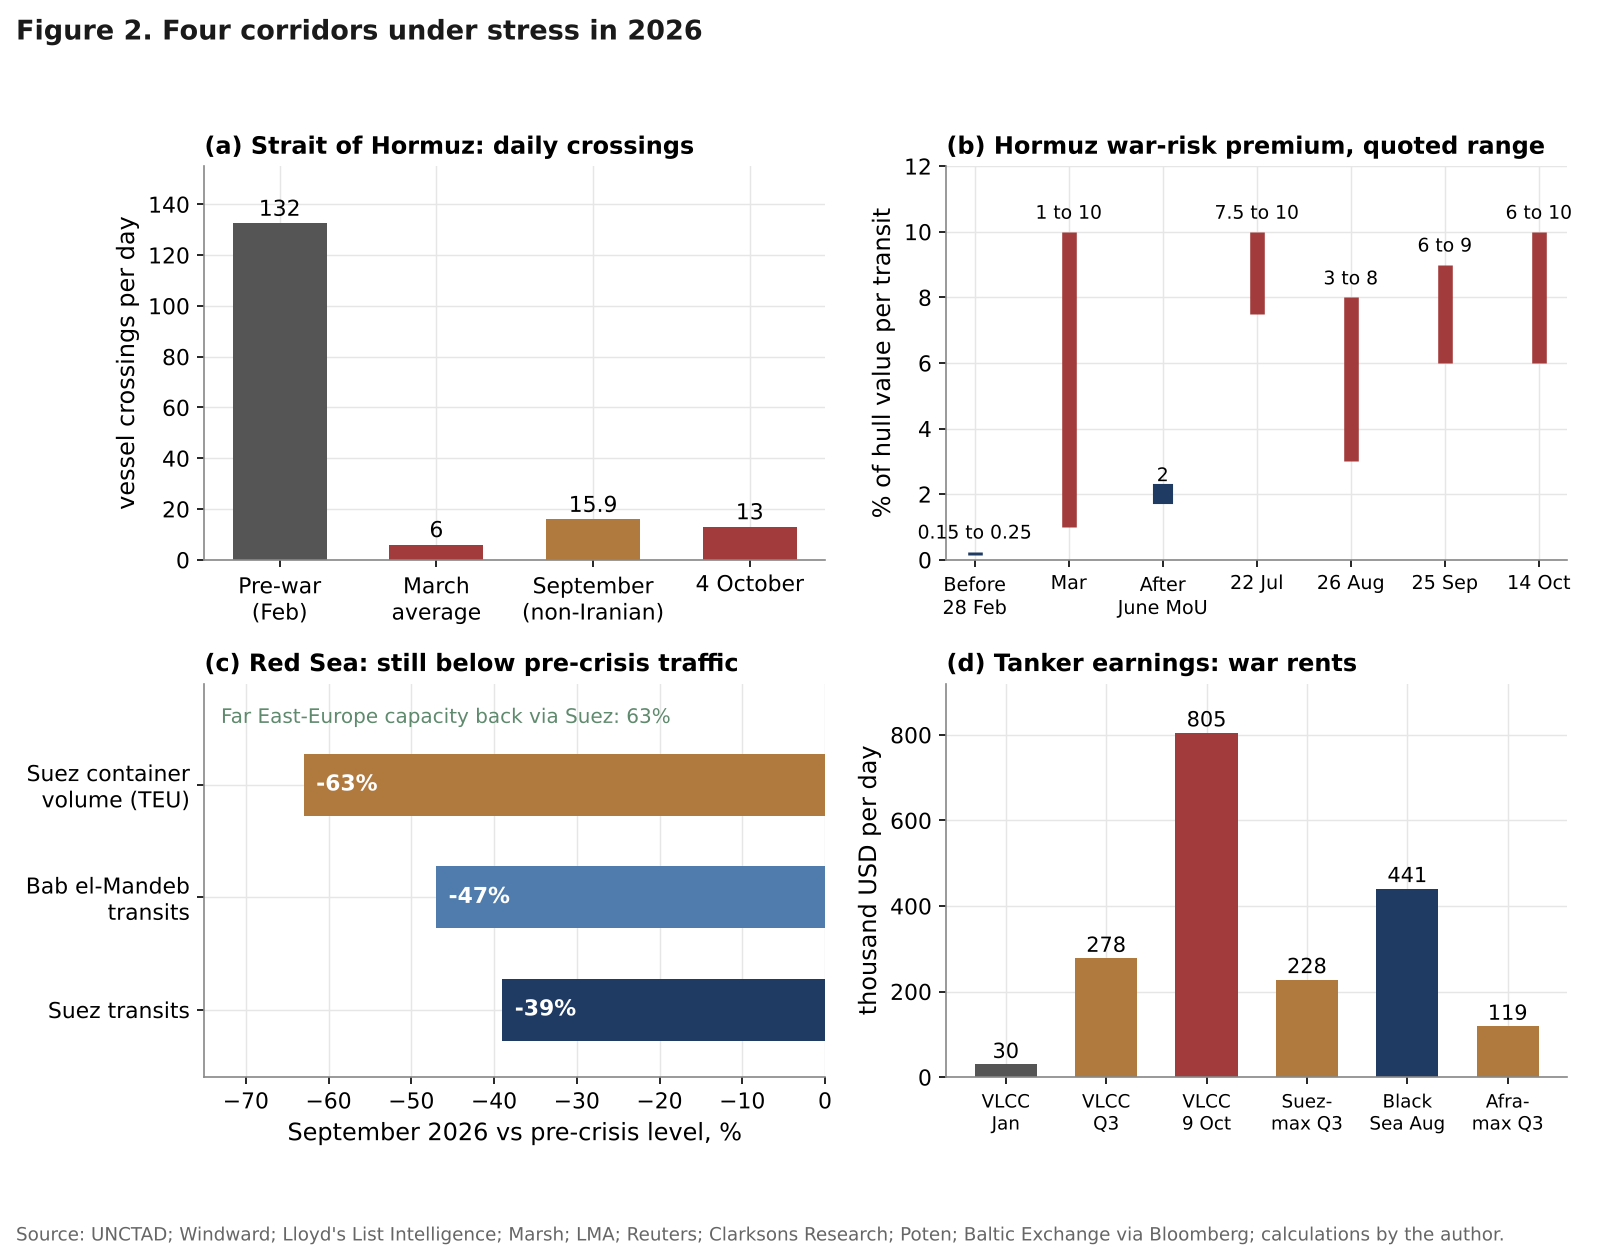
1. The war premium is concentrated in tankers, bulk and insurance, not in containers. Global VLCC spot earnings reached 805,000 dollars a day on 9 October, about 27 times the 30,000 dollars a day earned on the benchmark Gulf to Far East route in early January. Crude freight from the Gulf to the Far East rose from 1.73 dollars a barrel, 2.6 percent of the January Brent price, to about 33 dollars, 26 percent of the October price; from the US Gulf to China it went from 5 to 37.5 dollars. At the mid-point of quoted rates, Hormuz war-risk cover alone costs about 6 dollars per barrel on a VLCC, 4.7 percent of the cargo’s value, against 0.11 to 0.19 dollars before the war.
2. Direct war costs explain 38 percent of the rise in Asia-Europe container rates and only 4 to 6 percent of the transpacific surge. Between 5 March and 22 October, Shanghai-Rotterdam rose by 1,580 dollars per 40-foot container (FEU), of which the author’s cost-build model attributes 474 dollars to bunker fuel and 120 dollars to insurance; Shanghai-New York rose by 7,189 dollars. The timing confirms it: the World Container Index rose 13 percent between March and early May, when Brent averaged 110 dollars, and 104 percent between May and late August, during the US-Iran memorandum, when Brent averaged 85 dollars and Hormuz premiums fell to about 2 percent.
3. Insurance is a regressive tax on cheap cargo, and the Cape detour now costs carriers about the same as Suez but costs cargo owners up to 1,364 dollars per box. The same premium is 0.13 percent of the value of a mid-value container through Bab el-Mandeb, 4.7 percent for crude on a VLCC through Hormuz and 16 percent for a grain cargo calling in the Gulf. At October bunker prices, the 8.3 extra days via the Cape add about 14 dollars per FEU to a carrier’s costs once Suez tolls and Red Sea insurance are netted out, but cost the owner of the goods 85 to 1,364 dollars per FEU in time.
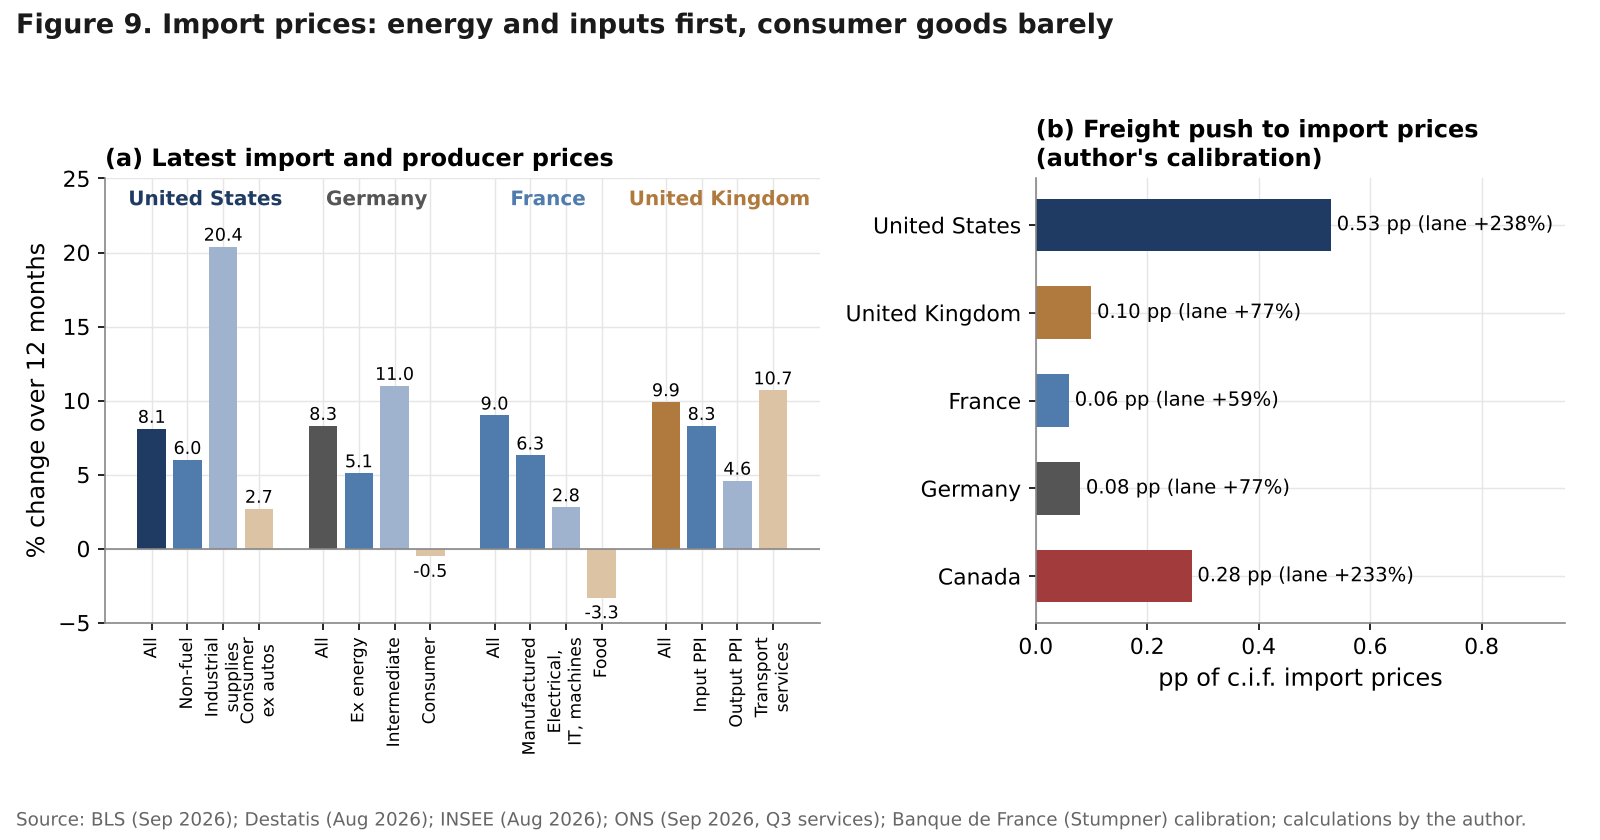
4. In consumer prices, freight is a 2027 story, and most of it is already in the pipeline. On the author’s model, container freight adds 0.08 to 0.12 percentage points to annual consumer price inflation in September 2026 and peaks in mid to late 2027 at 0.55 points in the United States, 0.64 in Canada, 0.37 in Germany, 0.32 in the United Kingdom and 0.23 in France (central elasticity; the plausible range is roughly 0.4 to 1.7 times these values). Even if rates fall to 1,700 dollars by the end of 2027, 67 to 87 percent of that 2027 effect still materialises. Direct war costs account for only 0.03 points at peak in North America and about 0.1 point in Europe.
5. The probability-weighted path leaves freight above pre-war norms at the end of 2027. In four scenarios with explicit probabilities, the expected World Container Index at the end of 2027 is 3,475 dollars, 22 percent above its ten-year average, with a 20 percent chance that it is higher than today and a 40 percent chance that it is below the ten-year average. Expected Gulf-Asia crude freight is 14.2 dollars a barrel, still several times the pre-war level.
1. Introduction: what is a war premium?
Most of the 2026 debate on the economic cost of the war involving Iran has been about the price of oil, and for good reason. Brent averaged 69.1 dollars a barrel in 2025 and 70.9 dollars in February 2026; it rose to 103.1 dollars in March and 117.3 in April, fell back to 85.4 in June and 83.8 in July, then climbed again to 114.2 dollars in September and 127.0 in October. This note looks at a different bill: what it costs to move goods, energy and food across seas where ships are attacked, and how that cost reaches importers and consumers.
The war premium on trade has four components (Figure 1). The first is insurance: a ship entering an area listed by the London market’s Joint War Committee needs additional war-risk cover, priced per transit as a percentage of hull value. The second is fuel, whose price follows crude and refining margins, so the oil shock raises the cost of every voyage, near a war zone or not. The third is distance and time: Cape detours, shuttles, ship-to-ship transfers and waiting at anchor. The fourth is scarcity: when ships are trapped or diverted, owners of the remaining ones earn a rent unrelated to the cost of sailing.
Each component reaches prices through freight rates, at different speeds and with different buffers: surcharges pass through within weeks, annual contracts delay spot moves by months, margins absorb part of the shock, and credible central banks keep it from feeding on itself. The literature puts the peak effect on consumer prices about twelve months after the shock.
Sections 2 and 3 describe the corridors and freight rates; Section 4 separates war costs from the rest; Sections 5 and 6 do the insurance and rerouting arithmetic; Sections 7 to 9 follow the shock into import and consumer prices; Section 10 sets out scenarios to the end of 2027. Decoded No. 13 covered North American truck freight and tariffs; this note deals with sea freight and insurance and does not repeat that analysis.
2. Four corridors in October 2026
Table 1 summarises the state of the four corridors that matter for the five economies in this note, with a pre-war reference and the latest reading available on 24 October.
Table 1. Four corridors: pre-war reference and latest readings. Sources: UNCTAD (7 April 2026); Windward and Kpler via Insurance Business (14 October 2026); Clarksons Research via Seatrade Maritime (6 October 2026); Lloyd’s List Intelligence (12 and 15 October 2026); Alphaliner via The Loadstar (21 October 2026); Marsh via S&P Global Platts (22 July 2026); Reuters (25 September 2026); Maritime Executive (15 January 2026); Bloomberg via gCaptain (12 August 2026); ChemAnalyst (24 August 2026). Retrieved 24 October 2026.
| Corridor | Indicator | Before the war | Latest | Change |
|---|---|---|---|---|
| Strait of Hormuz | Vessel crossings per day | 130 to 135 | 13 (4 Oct) | about -90% |
| Strait of Hormuz | Crude flows, million barrels a day | about 15 | 8.5 (week to 12 Oct) | about -40% |
| Strait of Hormuz | War-risk premium, % of hull per transit | 0.15 to 0.25 | 6 to 10 (14 Oct) | about 40 times |
| Red Sea | Suez Canal transits vs pre-crisis | 2023 level | -39% (Sep) | +21% y/y |
| Red Sea | Far East-Europe container capacity via Suez | about 100% (2023) | 63% (Oct) | recovering |
| Red Sea | Bab el-Mandeb premium, % of hull | 0.3 (before 20 Jul) | 0.5 (Jul); Yanbu about 3 | rising for Saudi-linked |
| Black Sea | War-risk premium for a port call, % of hull | 0.25 to 0.3 | up to 1 (Jan), doubled in Jul | 3 to 7 times |
| Black Sea | Novorossiysk-Augusta tanker earnings | n.a. | 440,948 USD/day (Aug) | highest since 2008 |
| Panama Canal | Daily transit slots | normal schedule | 34, then 32 from Sep | drought, not war |
2.1 Hormuz: from closure to an armed corridor
The Strait of Hormuz carried about one quarter of world seaborne oil trade, about a fifth of LNG trade and, according to the International Trade Centre, a third of globally traded urea. The Energy Information Administration described Iran’s actions of 2 March as an effective closure; UNCTAD counted 130 transits a day in February and 6 a day in March. A ceasefire in early April and a US-Iran memorandum of understanding signed on 17 June each produced a lull, and each lull was broken: attacks in early July, the expiry of the memorandum in August and renewed strikes from 2 September brought the corridor back into active conflict. US Central Command now enforces a blockade of Iranian ports.
Traffic has partly returned, as an armed corridor rather than a sea lane. Lloyd’s List Intelligence counted at least 477 transits by non-Iranian-linked ships in September, about 15.9 a day, and Clarksons estimates that crude flows reached about 12 million barrels a day at the end of the third quarter, against about 15 million before the war and less than 2 million at the low point. October has been worse: more than 20 vessels were attacked between 1 and 14 October, a 2,824-TEU containership sank, Windward counted 13 crossings on 4 October and Kpler put crude flows at 8.5 million barrels a day in the week to 12 October. The International Maritime Organization has recorded 106 confirmed incidents and 24 seafarer deaths since February.
The war-risk market has tracked each phase (Figure 2, panel b). Before the war, additional premiums for the Gulf were 0.15 to 0.25 percent of hull value. Within weeks they were quoted between 1 and 10 percent, with quotes valid for 12 hours instead of 24. The June memorandum brought them down to about 2 percent; by late July Marsh quoted 7.5 to 10 percent, by late August 3 to 8 percent and in mid-October 6 to 10 percent. Cover is available “for a price”, and the price reflects real losses: Howden Re estimated claims of 2 to 3 billion dollars in war and political violence lines, against annual premiums of 1.5 to 2 billion. A 40 billion dollar reinsurance facility backed by the US Development Finance Corporation had written no business as of May.
2.2 The Red Sea: a slow return, with a new Saudi risk
The Red Sea is moving in the opposite direction. After the Houthi attacks of late 2023, most container lines sent Asia-Europe services around the Cape for more than two years. In 2026 they have been coming back: the Gemini cooperation of Maersk and Hapag-Lloyd from February, MSC from August, COSCO from September. According to Alphaliner, 63 percent of deployed Far East-Europe capacity now uses the Red Sea, 70 percent on Mediterranean trades and 58 percent to North Europe.
Traffic is still below its pre-crisis level: 1,228 Suez transits in September, 21 percent more than a year earlier but 39 percent fewer than before the Houthi attacks, and 2.19 million TEU of containership volume against 5.9 million in September 2023. The risk has also changed shape. On 20 July the Houthis declared a naval blockade on Saudi Arabia. Reuters reported premiums of about 3 percent for Saudi-linked tankers loading at Yanbu, where crude piped across the kingdom bypasses Hormuz, against less than 1 percent in early July, and more than 7 percent south of Yanbu, while tankers without Saudi links paid 0.2 to 0.3 percent.
2.3 The Black Sea: tankers in the line of fire
The Black Sea is a smaller corridor for these five economies, but a revealing one. Marsh put war-risk premiums for port calls at 0.25 to 0.3 percent of hull value before attacks on tankers in late 2025; by January 2026 underwriters charged up to 1 percent, about 800,000 dollars per voyage for a newer Suezmax, and new drone strikes from early July led insurers to double premiums again, according to the International Energy Agency. Earnings on the Novorossiysk to Augusta route reached 440,948 dollars a day on 12 August, the highest in Baltic Exchange data since July 2008, and the Kazakh CPC Blend fell to 4.60 dollars a barrel below Dated Brent.
2.4 Sanctions and the Panama Canal
Two further frictions complete the picture. The first is sanctions. Western authorities had sanctioned 1,226 oil and LPG tankers by the end of August, according to S&P Global; BRS counted 148 deep-sea tankers sanctioned by the US Treasury alone, about 2.5 percent of the world fleet. These ships form a parallel fleet that cannot serve mainstream trades, which tightens the market for compliant tonnage. In August the Office of Foreign Assets Control warned that paying “tolls” or “donations” to Iranian bodies for safe passage through Hormuz, or accepting their insurance, exposes shipowners to sanctions; P&I clubs said such voyages would not be covered.
The second friction has nothing to do with war. Below-average rainfall linked to a strengthening El Niño led the Panama Canal Authority to cut daily transit capacity to 34 vessels from September, then to 32. Carriers imposed Panama surcharges on Asia-US East Coast and Gulf Coast services and cut Asia-East Coast capacity by 9 percent in August. This matters for the interpretation of container rates in Section 4: a large part of the 2026 surge on the transpacific is a canal and capacity story, not a war story.
A first look at the results
The full note goes much further, with original models, scenarios and a dashboard of leading indicators. Two of its 14 charts and diagrams are shown below.
Continue reading
Get the full note: 25 pages, 14 charts and diagrams, 10 tables
This page shows the first part of the note. The full PDF adds: freight rates: containers and tankers; decomposing the container rate: how much is war?; the insurance arithmetic; rerouting arithmetic: Suez versus the Cape; from freight to import prices; who and what is exposed; from import prices to consumer prices; scenarios to the end of 2027; leading indicators dashboard.
29 USD, instant PDF download, secure card payment.
Buy the full noteNeed this analysis for your organisation?
We prepare confidential briefings, executive talks and studies on countries, markets and policies, built on the same method as this article.
Request a briefingSupport independent analysis
Our studies are free to read and carry no advertising. If this one was useful, a small contribution helps us publish the next.
Support our workGo further: books by Global Strategy Files

Frequently asked questions
How much has the 2026 war raised shipping insurance costs?
Very sharply in the Gulf. Before the war began in late February 2026, additional war-risk premiums for a Hormuz transit were 0.15 to 0.25 percent of a ship’s hull value. In mid-October 2026 brokers quoted 6 to 10 percent, about forty times more. For a VLCC carrying 2 million barrels, that is 9 to 15 million dollars per transit, or 4.50 to 7.50 dollars per barrel. Red Sea premiums for most ships stay near 0.2 to 0.5 percent.
Did the Iran war cause the 2026 surge in container freight rates?
Only in part. The Drewry World Container Index rose 134 percent between 5 March and 22 October 2026 to 4,585 dollars per 40-foot container, but most of the rise came from May to August, during a US-Iran truce. A cost-build model attributes 38 percent of the Asia-Europe increase to fuel and insurance, and only 4 to 6 percent of the transpacific surge, which reflects Panama Canal limits, capacity cuts and front-loaded imports.
Is it cheaper to sail around the Cape of Good Hope or through Suez in 2026?
For carriers the two are now close. The Cape adds 3,200 nautical miles and about 8.3 days between Shanghai and Rotterdam, raising fuel and ship-time costs, but avoids Suez tolls and Red Sea war insurance. At October 2026 bunker prices the author estimates carrier costs within about 14 dollars per container. Cargo owners pay more for the extra time: 85 to 1,364 dollars per container depending on the value of the goods.
How much will higher shipping costs add to inflation in 2027?
On the author’s model, container freight adds 0.08 to 0.12 percentage points to annual consumer price inflation in September 2026 and peaks in 2027 at about 0.55 points in the United States, 0.64 in Canada, 0.37 in Germany, 0.32 in the United Kingdom and 0.23 in France. Most of the 2027 effect is already locked in because pass-through takes about a year, and only a small part reflects direct war costs.
Sources
- Alphaliner, survey of the ten largest carriers’ networks, as reported by The Loadstar, “Nearly two-thirds of Far East-Europe capacity now back to Suez Canal” (21 October 2026).
- Al-Monitor, “Ship insurers juggle war risks on perilous Gulf route” (28 March 2026).
- Attinasi, M. G., Bobasu, A. and Gerinovics, R., “What is driving the recent surge in shipping costs?”, ECB Economic Bulletin, Issue 3/2021.
- Banque de France, Stumpner, S., “How much have rising transport costs affected US import prices?”, Bloc-notes Eco No. 268 (11 May 2022).
- Bloomberg via gCaptain, “Black Sea oil tanker rates surge to record on drones barrage” (12 August 2026).
- Bureau of Labor Statistics, “U.S. Import and Export Price Indexes, September 2026” (16 October 2026); Handbook of Methods, International Price Program concepts; Inbound Ocean Liner Freight Index methodology.
- Carriere-Swallow, Y., Deb, P., Furceri, D., Jimenez, D. and Ostry, J. D., “Shipping costs are an important and understudied driver of global inflation”, VoxEU/CEPR (8 November 2022).
- ChemAnalyst, “Asia-US container rates rise as Panama Canal cuts September transit capacity” (24 August 2026) and “Red Sea routing hits 27% normalization as Gemini adds four more services back to Suez” (18 September 2026).
- Clarksons Research, weekly recap (9 October 2026) via Cyprus Shipping News, “Global VLCC spot earnings rise to 805,000 USD/day” (14 October 2026); Seatrade Maritime, “ClarkSea Index breaks 2008 record to reach all-time high” (6 October 2026).
- Destatis, “Importpreise im August 2026: +8,3 % gegenueber August 2025”, press release (30 September 2026).
- Drewry, World Container Index, weekly assessments, via Drewry, The DCN, Hellenic Shipping News, AJOT, Home Textiles Today, Maritime Magazine, IndexBox, gCaptain and the SplyLine tracker (2024 to 22 October 2026).
- European Central Bank, Economic Bulletin, Issue 2/2024.
- Federal Reserve Bank of Boston, Shen, L. S. and Stein, H., “The impact of global shipping cost surges on US import price inflation”, Current Policy Perspectives 24-6 (14 November 2024).
- Federal Reserve Bank of Dallas, Reyes-Heroles, R. and Aanenson, T., “Hormuz closure offsets tariff reversal; U.S. left with upside inflation risk” (2 June 2026).
- French customs, annual foreign trade results for 2022, via Le Moci (February 2023); Direction generale du Tresor, bilateral trade between France and China.
- Gulf News, “Tanker costs soar 43-fold as Hormuz tensions reshape global oil trade”, citing Poten and Clarksons (5 October 2026).
- INSEE, “Prix de production et d’importation de l’industrie, aout 2026”, Informations rapides (30 September 2026).
- Insurance Business, “Hormuz war-risk rates face fresh pressure as Iran-US clashes resume” (2 September 2026), “Trump says Hormuz is clear. The insurance market disagrees” (26 August 2026) and “Hormuz sinking hands marine war underwriters another total loss as attacks surge” (14 October 2026).
- Reuters (J. Saul), report on war-risk premiums for Saudi-linked tankers in the Red Sea and for Hormuz, republished by Insurance Journal (25 September 2026).
- UN News, report on International Trade Centre analysis of Gulf exports through Hormuz in April 2026 (August 2026).
- Li, V., “How do changes in global shipping costs affect Australian inflation?”, Reserve Bank of Australia Bulletin (24 July 2025).
- Lloyd’s List Intelligence, “Strait of Hormuz Brief” (8 and 12 October 2026) and “Red Sea Brief” (27 August and 15 October 2026).
- Maritime Executive, “Russian and Ukrainian strikes are raising war risk insurance costs” (15 January 2026); India Seatrade News citing Marsh (4 December 2025).
- Notteboom, T., Pallis, A. and Rodrigue, J.-P., Port Economics, Management and Policy, “Routing options between Shanghai, Rotterdam and New York”.
- OECD, Economic Outlook, Interim Report (February 2024), as reported by CNBC (5 February 2024).
- Office for National Statistics, “Producer price inflation, UK: September 2026, including services, July to September 2026” and “Consumer price inflation, UK: September 2026” (October 2026).
- Office of Foreign Assets Control, alert on sanctions risks of Iranian demands for Strait of Hormuz passage (August 2026), via West of England P&I Club (25 August 2026).
- S&P Global Energy (Platts), “Middle East shipping insurance costs rise on Hormuz risks: Marsh” (22 July 2026) and “US sanctions relief could lift tanker rates in Russia, inject capacity to Gulf shuttles: analysts” (20 October 2026).
- Seatrade Maritime, “March VLCC outlook: historic shockwaves through the market” (9 April 2026); “Full Suez return for container carriers expected by Q1 2027” (headline, 2026).
- Statistics Canada, Industrial Product and Raw Materials Price Indexes, August 2026, via SteelOrbis (1 October 2026).
- The National, “Shipping insurance surges again as attacks intensify over Strait of Hormuz” (17 July 2026).
- TrendEconomy, merchandise imports by partner country, 2023 (UN Comtrade data) for the United States, Canada, the United Kingdom, France and Germany.
- UNCTAD, second rapid assessment of the Strait of Hormuz disruption (7 April 2026), via Shipping Telegraph.
- US Energy Information Administration, “Middle East crude oil tanker rates reached a multi-decade high in March”, Today in Energy (26 March 2026).
- gCaptain, “Hormuz on a knife edge: shipping pays the price as the Iran-U.S. ceasefire unravels” (July 2026).
- Data series: FRED DCOILBRENTEU, CPIAUCSL, CPILFESL, FEDFUNDS, ECBDFR; Bank of England IUMABEDR; Bank of Canada V39079, STATIC_TOTALCPICHANGE, CPI_TRIM; Eurostat HICP; ONS D7G7, DKO8; IMF WEO October 2026 (NGDPD). Web sources retrieved 24 October 2026.
Books from Global Strategy Files
Go further on this topic


