Workers Wanted: Labour Shortages and Migration Scenarios to 2035

Driss EFFINA, PhD Independent Researcher, Global Strategy Files Foresight, prospective note No. 20, 24 October 2026. Reading time: about 55 minutes
Key takeaways
- Demography alone would shrink the labour forces of the United States, United Kingdom, France, Germany and Canada by 8.3 million by 2035; official central migration paths turn that into growth of 3.4 million, but Germany’s labour force falls in all 24 combinations of migration and participation tested.
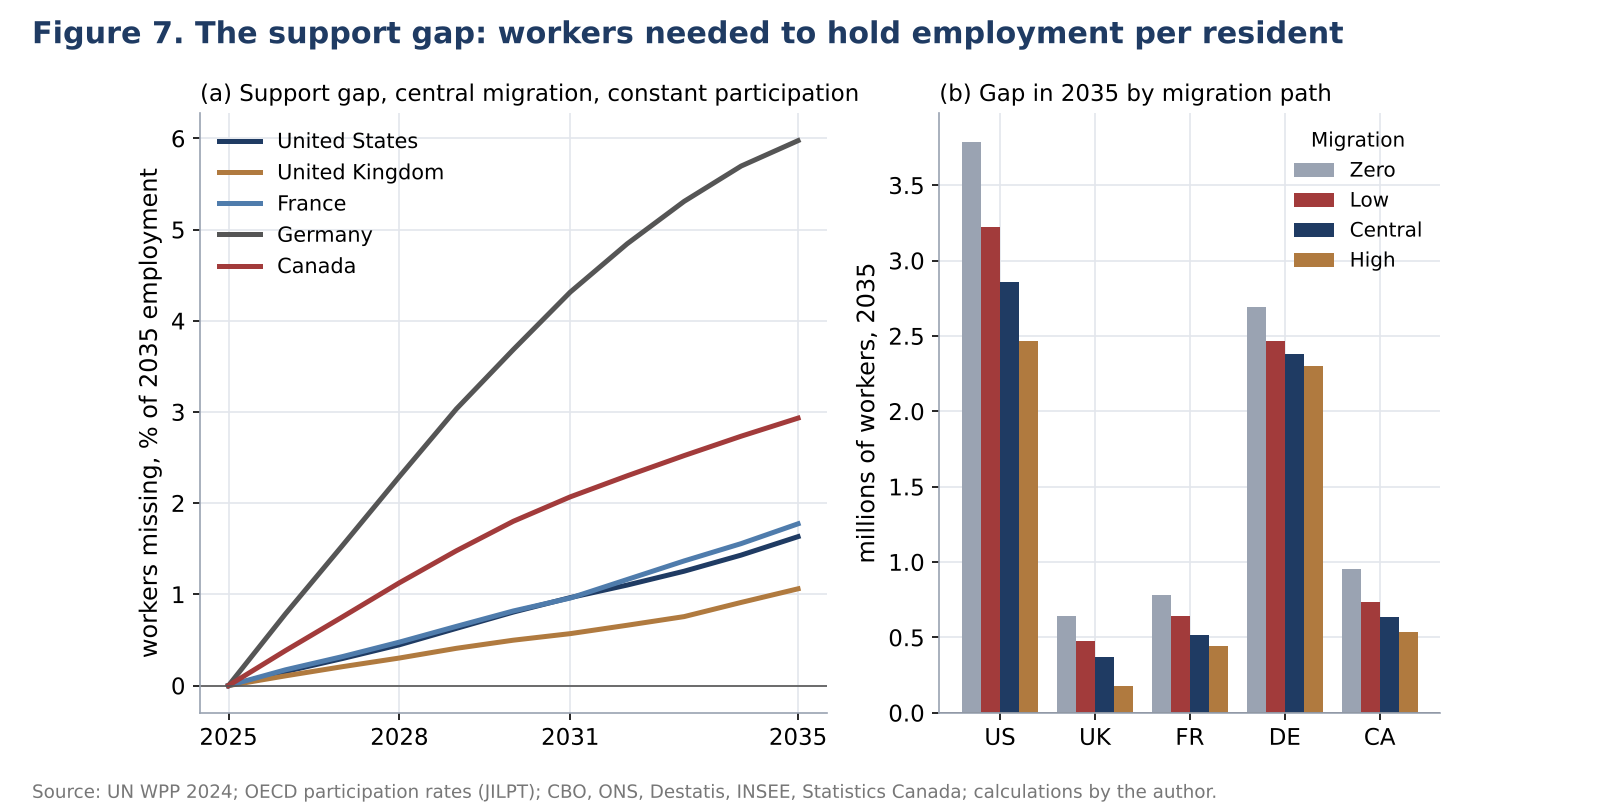
- Holding employment per resident at its 2025 level needs 6.8 million more workers in 2035: 2.86 million in the United States, 2.38 million in Germany (6.0 percent of employment), 0.64 million in Canada, 0.51 million in France and 0.37 million in the United Kingdom.
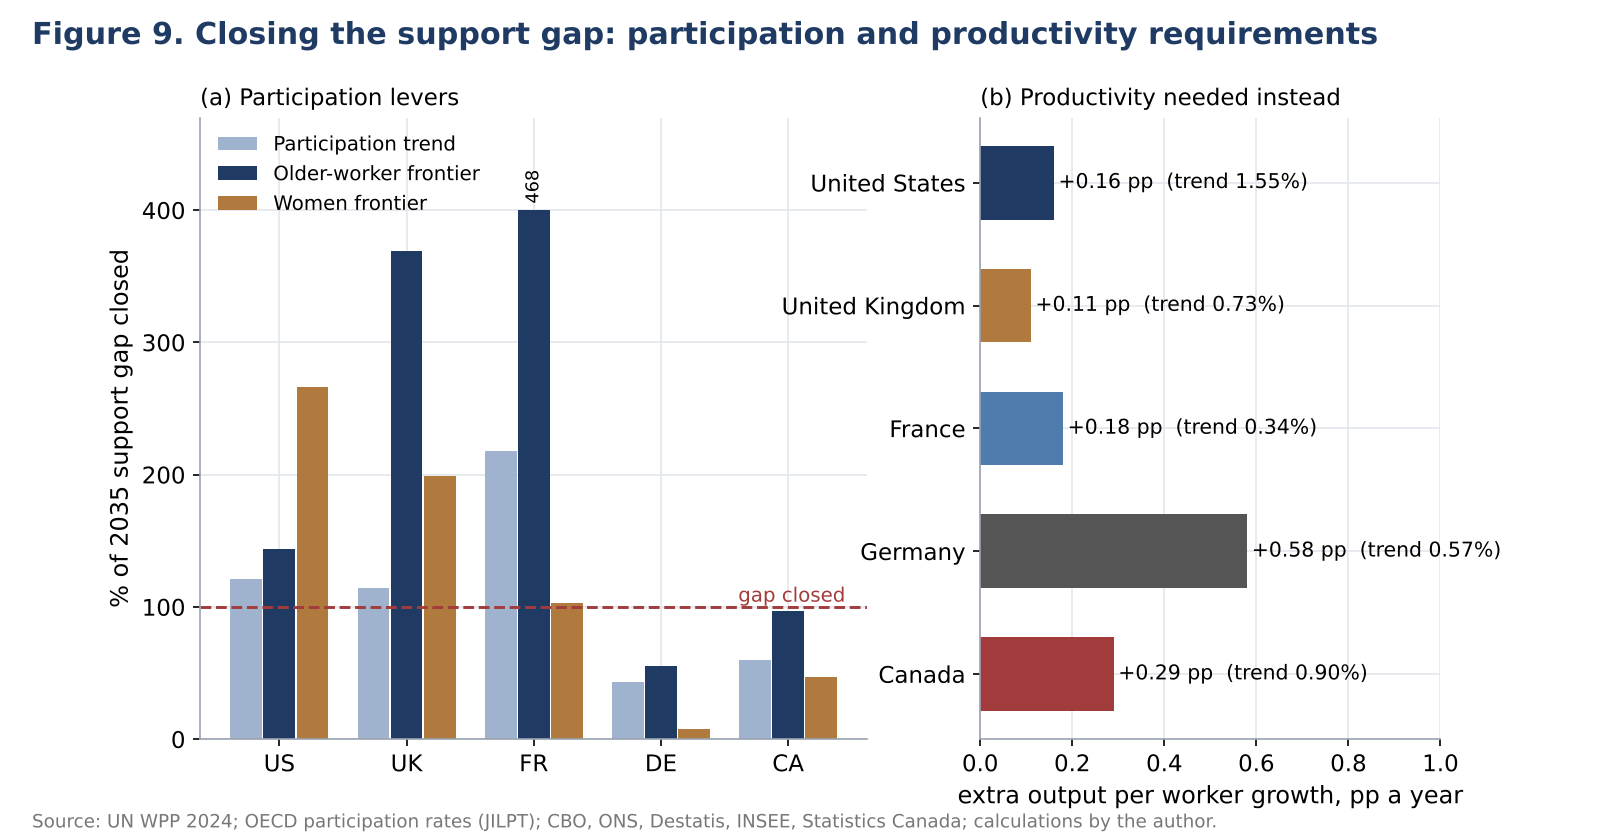
- Each extra 100,000 net migrants a year closes only 70,000 to 113,000 of that gap, because migrants also need support; continuing recent participation trends closes 95 percent of it, and older workers at the best rates among the five close 145 percent.
- Care, health, construction and information and communication need 12.7 million more workers by 2035, 3.3 times the rise in total employment; long-term care needs rise by 69 percent in the United States and Canada and 54 percent in France.
Abstract
In 2025 net migration broke downwards in four of the five largest Western labour markets. US net immigration fell from 2.3 million in 2024 to 410,000, British net migration from 331,000 to 171,000 and German net migration from 430,000 to 235,000, while Canada’s population growth slowed to 0.5 percent in the year to July 2026. At the same time the baby-boom generation is leaving work, and the number of people aged 80 and over in the five countries is set to rise by about half by 2035. Employers and governments now ask the same question in different words: where will the workers come from?
This note answers it for the United States, the United Kingdom, France, Germany and Canada to 2035. It builds a cohort-component projection of each population by single year of age from the UN World Population Prospects 2024, runs it under four net migration paths anchored on the official projections of the CBO, the ONS, Destatis, INSEE and Statistics Canada, and applies participation rates by age and sex under six behavioural scenarios: 24 labour supply paths per country. It then measures the labour gap in three ways (workers needed to keep employment per resident constant, workers needed to deliver the IMF’s medium-term growth, and sector needs in long-term care, health, construction and information technology), computes what migration, participation and productivity would each have to deliver to close it, prices their fiscal effects, and sets out four scenarios with probabilities, a dashboard of twelve indicators and a dated calendar. Current labour-market divergence (Decoded No. 11) and the pension and debt cost of ageing (Foresight No. 1) are not repeated: the subject here is the supply of workers to 2035. All projections and probabilities are the author’s.
Keywords: labour shortage, labour supply, migration scenarios, working-age population, participation, older workers, women’s employment, long-term care, construction workforce, ICT specialists, productivity, fiscal impact of migration, United States, United Kingdom, France, Germany, Canada
JEL codes: J11, J21, J23, J61, H68, O47
Key findings
1. Demography alone would shrink the five labour forces by 8.3 million people by 2035; official migration paths turn that into modest growth, except in Germany. At constant participation and zero migration the combined labour force falls by 2.7 percent. Under the central migration paths it rises by 1.1 percent (3.4 million). Germany’s labour force falls in all 24 combinations of migration and participation tested, by 6.8 percent (3.0 million) in the central case. 2. Holding employment per resident at its 2025 level would require 6.8 million more workers in 2035 than central migration and current behaviour provide, 2.3 percent of employment. The gap is 2.86 million in the United States (1.6 percent), 2.38 million in Germany (6.0 percent), 0.64 million in Canada (2.9 percent), 0.51 million in France (1.8 percent) and 0.37 million in the United Kingdom (1.1 percent). Unfilled, it subtracts 0.11 to 0.58 percentage point a year from growth in GDP per head. 3. Migration is the least efficient way to close this gap. Because migrants arrive with dependants and add to the population to be supported, each additional 100,000 net migrants a year from 2026 (900,000 people by 2035) reduces the 2035 gap by only 70,000 to 113,000. Migration alone would require net inflows of 5.1 million a year in the United States and 2.9 million in Germany, each 12.5 times the 2025 outturn. Per worker added, the net fiscal return of migration is 38 to 52 percent of that of an extra older worker. 4. Participation is the strongest lever everywhere except Germany. Continuing half of the 2015 to 2024 rise in participation by age closes 95 percent of the five-country gap (121 percent in the United States, 114 percent in the United Kingdom, 218 percent in France). Raising older workers to the best rates observed among the five closes 145 percent; raising American women’s participation to the best rates among the five (they trail Canadian women by 6 to 8 points at ages 25 to 54) closes 266 percent of the US gap. In Germany the same levers close only 63 percent, and the remainder requires output per worker to grow 0.58 point a year faster, double its 2015 to 2025 trend. 5. The real shortage is sectoral. By 2035 long-term care, health, construction and information and communication need 12.7 million more workers across the five countries, 3.3 times the 3.9 million rise in total employment in the central case. Against a proportional share of labour supply, the gaps are 3.1 million in long-term care (where need rises by 69 percent in the United States and Canada and 54 percent in France), 3.3 million in health, 3.3 million in construction and 1.9 million in information and communication: 11.6 million in all. 6. The IMF’s medium-term growth forecasts quietly assume a productivity revival. At central migration and constant participation, the IMF’s growth paths require output per worker to rise by 1.19 percent a year in the United Kingdom (0.73 percent in 2015 to 2025), 0.90 percent in France (0.34), 1.53 percent in Germany (0.57) and 1.22 percent in Canada (0.90). In the author’s four scenarios the probability-weighted support gap in 2035 is 0.9 million workers: a surplus in the United States, the United Kingdom and France, a gap of 1.5 million in Germany and 0.3 million in Canada.
1. Introduction: the question after the migration break
For a decade, labour shortages in rich economies were answered largely by migration. Between 2022 and 2024 the five economies in this note absorbed one of the largest migration waves in their modern history: US net immigration reached 2.3 million in 2024 on the CBO’s estimate, British net migration peaked at 944,000 in the year to March 2023, German net migration was still 430,000 in 2024, and Canada’s population grew by 3.0 percent in the year to July 2024. That answer has now been withdrawn, by voters and by governments, at the very moment when the largest cohorts born after the Second World War leave work.
The 2025 to 2026 break is described in Decoded No. 11, which showed how lower migration kept the US unemployment rate down while Europe’s labour markets loosened. This note looks ten years ahead and asks three questions. How many workers will the five economies have in 2035 under plausible migration paths and participation behaviour? How large is the gap between that supply and what their economies and their ageing populations will need? And what would migration, older workers, women and productivity each have to deliver to close it, at what cost to public finances?
Figure 1 sets out the framework. Labour supply is built from three blocks: the population by age and sex, which ages one year at a time; net migration, which adds people with a characteristic age profile, including children; and participation by age and sex. Labour needs are measured in three ways, because “shortage” means different things to different people: the number of workers needed to keep employment per resident at its 2025 level (the support need), the number needed to deliver the IMF’s medium-term growth at past productivity (the growth need), and the needs of four sectors where demand is driven by demography, housing and digitalisation. The gap between needs and supply can be closed by three levers, each with its own costs and fiscal effects.
Sections 2 to 4 cover the starting point, population and labour supply; Sections 5 to 8 the gaps, the levers, the sectors and the fiscal effects; Sections 9 to 12 the scenarios, a dashboard, implications and a calendar.
2. The starting point: the 2025 break and the policies of 2026
2.1 Five breaks in one year
Table 1 summarises the latest official figures. The common thread is a sharp fall in 2025 from the peaks of 2022 to 2024, driven mostly by policy rather than by weaker labour demand.
Table 1. Net migration and policy, 2024 to 2026. Sources: CBO, The Demographic Outlook: 2026 to 2056 (January 2026); ONS, long-term international migration, year ending December 2025 (21 May 2026); Destatis, press release of 1 June 2026; INSEE, Bilan démographique 2025 (13 January 2026); Statistics Canada (September 2025 and September 2026 estimates); IRCC; official policy texts cited in Sources.
| United States | United Kingdom | France | Germany | Canada | |
|---|---|---|---|---|---|
| Net migration, 2024 | 2.3 million | 331,000 | 176,000 | 430,000 | about 370,000 (year to July 2025) |
| Net migration, 2025 | 410,000 | 171,000 | 176,000 (provisional) | 235,000 | about 170,000 (year to July 2026) |
| Official near-term path | 570,000 in 2026; 2.9 million in 2028 to 2030; 1.2 million in 2035 (CBO) | 138,000 in 2026; 230,000 from mid-2027 (ONS principal) | +70,000 a year (INSEE central, 2021 projections) | 150,000 / 250,000 / 350,000 (Destatis W1 / W2 / W3) | 380,000 permanent admissions a year; temporary residents below 5 percent of population by end-2027 |
| Main 2025 to 2026 measures | 100,000 dollar fee on new H-1B petitions (21 September 2025); immigrant visas paused for nationals of 75 countries (21 January 2026); TPS terminations | Care worker visa closed to overseas recruitment (22 July 2025); skills charge up 32 percent (December 2025); B2 English (January 2026); 10-year settlement proposed | 2026 social security law slows the rise in the pension age for the 1964 to 1968 cohorts | Aktivrente: 2,000 euros a month tax-free for employees working past pension age (1 January 2026) | 2026 to 2028 Levels Plan: temporary arrivals cut to 385,000 in 2026 and 370,000 in 2027 |
Figure 2 places these outturns against the paths used in this note. First, the US break is the largest: the CBO now projects net immigration of 570,000 in 2026 against 1.6 million in its January 2025 projection, with 330,000 more departures than arrivals among other foreign nationals in 2026 and 2027. Second, official long-term assumptions have been cut: the ONS principal assumption fell from 340,000 (2022-based) to 230,000 (2024-based, 28 April 2026), and Destatis’s 16th coordinated projection (11 December 2025) runs from 150,000 to 350,000 a year. Third, France is the exception: its net migration has been stable at about 176,000, far above the 70,000 a year assumed in INSEE’s central projection, which predates the recent rise.
2.2 Participation policy is moving too
Retirement policy moved in both directions. France’s 2026 social security financing law, adopted on 16 December 2025, slowed the rise in the legal retirement age decided in 2023: people born in 1964 can retire at 62 years and 9 months, and 64 now applies from the 1969 cohort. The British state pension age begins rising from 66 to 67 in 2026, a change completed by 2028. Germany’s Aktivrente, in force since 1 January 2026, lets employees past the statutory pension age earn up to 2,000 euros a month tax-free. The US full retirement age reaches 67 for people born in 1960, in 2027.
A first look at the results
The full note goes much further, with original models, scenarios and a dashboard of leading indicators. Two of its 14 charts and diagrams are shown below.
Continue reading
Get the full note: 29 pages, 14 charts and diagrams, 17 tables
This page shows the first part of the note. The full PDF adds: demography to 2035: four migration paths; labour supply: participation and 24 combinations; how big is the gap?; what each lever would have to deliver; sector gaps: care, health, construction and digital; costs and fiscal effects; four scenarios to 2035; leading-indicators dashboard; implications for policy and for businesses and investors.
29 USD, instant PDF download, secure card payment.
Buy the full noteNeed this analysis for your organisation?
We prepare confidential briefings, executive talks and studies on countries, markets and policies, built on the same method as this article.
Request a briefingSupport independent analysis
Our studies are free to read and carry no advertising. If this one was useful, a small contribution helps us publish the next.
Support our workGo further: books by Global Strategy Files

Frequently asked questions
How big will labour shortages be in 2035?
On the author’s projections, keeping employment per resident at its 2025 level in the United States, United Kingdom, France, Germany and Canada would require 6.8 million more workers in 2035 than central migration paths and current participation provide, 2.3 percent of employment. The gap is largest in Germany, at 6.0 percent of employment, and smallest in the United Kingdom, at 1.1 percent. Sector shortages are larger still: 11.6 million workers across long-term care, health, construction and information and communication.
Can migration solve labour shortages?
Only slowly. Migrants arrive with dependants and add to the population that workers must support, so each additional 100,000 net migrants a year from 2026 reduces the 2035 support gap by only 70,000 to 113,000. Closing the gap by migration alone would need net migration of 5.1 million a year in the United States and 2.9 million in Germany, 12.5 times their 2025 levels. Adult labour migration targeted at sectors is two to three times more effective per person.
Which lever closes the labour gap fastest?
Participation. It adds workers without adding residents. Continuing half of the 2015 to 2024 rise in participation by age closes 95 percent of the five-country gap, and raising older workers to the best rates among the five closes 145 percent. In the United States, bringing women’s participation to Canadian levels is the single largest lever. Germany is the exception: participation closes only about 63 percent of its gap and productivity must do the rest.
Which sectors will face the worst worker shortages by 2035?
Long-term care, because the population aged 80 and over in the five countries rises from 31.3 million to 46.3 million. Care needs grow by about 69 percent in the United States and Canada and 54 percent in France. Construction gaps are largest in the United Kingdom and Germany, at about a third of current employment, and digital gaps in Germany, at 37 percent. In total these four sectors need 12.7 million more workers by 2035.
Sources
- Congressional Budget Office, “The Demographic Outlook: 2026 to 2056”, January 2026 (publication 61879 and report PDF).
- Congressional Budget Office, “Effects of the Immigration Surge on the Federal Budget and the Economy”, 23 July 2024.
- US Bureau of Labor Statistics, “Employment Projections: 2025 to 2035”, news release of 27 August 2026; Career Outlook, “Data on display: economy, labor force and productivity”, 2026.
- US Bureau of Labor Statistics, “Foreign-born workers: labor force characteristics, 2025”, USDL-26-0760, 19 May 2026.
- US Census Bureau, 2023 National Population Projections, press kit and alternative scenario tables; Baltimore Metropolitan Council, presentation on the Census Bureau’s 2023 national projections, 28 February 2024.
- Centers for Medicare and Medicaid Services, “Age and Gender Highlights”, National Health Expenditure data (2020).
- WilmerHale, client alert on the H-1B proclamation and fee, 20 September 2025; Hodgson Russ, “Recent U.S. immigration updates”, 2026.
- Associated Builders and Contractors, workforce shortage estimate for 2026 and 2027, as reported by Construction Executive, 15 January 2026.
- Office for National Statistics, “Long-term international migration, provisional: year ending December 2025”, 21 May 2026; “National population projections, migration assumptions: 2024-based”, 28 April 2026; release calendar entry for the year ending June 2026.
- Office for Budget Responsibility, analysis of the fiscal impact of migration, as summarised in Migration Observatory, “The fiscal impact of immigration to the UK”, briefing of 23 June 2026.
- Skills for Care, “The state of the adult social care sector and workforce in England, 2026”, as reported by LocalGov, 24 June 2026.
- NHS England, “NHS Long Term Workforce Plan”, June 2023; Pulse, “Refreshed NHS workforce plan to include fewer staff than projected”, 7 July 2025.
- Bird and Bird, “UK Immigration Law: Key Changes in 2025 and What to Expect in 2026”; Davidson Morris, “UK ILR debate update”, February 2026; Royal London, guide to the State Pension age increase.
- Destatis, “Nettozuwanderung 2025 mit 235 000 Personen deutlich gesunken”, press release No. 184 of 1 June 2026; “16. koordinierte Bevölkerungsvorausberechnung: Annahmen und Ergebnisse”, 11 December 2025; “Bis 2049 werden voraussichtlich mindestens 280 000 zusätzliche Pflegekräfte benötigt”, press release No. 033 of 24 January 2024.
- Federal Ministry for Economic Affairs, “Ergebnisse der Bevölkerungsvorausberechnungen”, Schlaglichter der Wirtschaftspolitik, February 2026.
- IHK Koblenz, “Aktivrente” (in force since 1 January 2026).
- Bitkom, “Mangel an IT-Fachkräften droht sich zu verschärfen”, press release of 11 April 2024.
- INSEE, “Bilan démographique 2025”, Insee Première No. 2087, 13 January 2026; INSEE Références 2023, labour force projections and the 2023 pension reform variant.
- Malakoff Humanis, note on the suspension of the pension reform (2025); Quelles Aides, on the suspension’s application from 1 September 2026.
- Banque des Territoires (Localtis), “La Dares et France Stratégie identifient les métiers les plus demandés en 2030”, 10 March 2022.
- LCP, “Présidentielle 2027: les dates du premier et du second tour fixées”, 30 June 2026.
- Statistics Canada, population estimates, The Daily, 24 September 2025; “Population Projections for Canada (2025 to 2075)”, 27 January 2026 (catalogue 17-20-0003); Daily Hive on the September 2026 revisions, 2 October 2026.
- Immigration, Refugees and Citizenship Canada, “CIMM: Immigration Levels Plan”, 4 May 2026.
- Employment and Social Development Canada, Canadian Occupational Projection System 2024 to 2033, as reported by HCAMag, 24 February 2025.
- Innovation, Science and Economic Development Canada, “Canadian ICT Sector Profile 2024”.
- Eurostat, EUROPOP2023 and EUROPOP2025 metadata (proj_23n, proj_25n); ICT specialists in employment 2025, as reported by Eunews, 27 May 2026.
- OECD, Health at a Glance 2023, Figure 10.18 (long-term care workers per 100 people aged 65 and over), as reported by the A-Mark Foundation; OECD, “Taxing Wages 2025”.
- Japan Institute for Labour Policy and Training, Databook of International Labour Statistics 2017 (Table 2-11) and 2026 (Tables 2-11-2 and 3-1), from OECD and ILOSTAT data.
- United Nations, World Population Prospects 2024 (wpp2024 data package: popAge1dt, popprojAge1dt, mx1dt, migproj1dt, misc1dt).
- IMF, World Economic Outlook database, October 2026: NGDP_RPCH, LUR, GGR_G01_GDP_PT, G_X_G01_GDP_PT; IMF Public Finances in Modern History (interest expense).
- Data series: FRED JTSJOL; ONS AP2Y; Statistics Canada v2062815.
- Global Strategy Files, Decoded No. 11 “The Great Labour Divergence”, Foresight No. 1 “The Ageing Bill”, Foresight No. 9 “The AI Dividend” and Foresight No. 19 “The Housing Shortfall to 2035”.
- Data retrieved on or before 24 October 2026.
Books from Global Strategy Files
Go further on this topic