
The Bank of Canada’s Silent Trap: Rising Unemployment, Inflation Near 3 Percent and a Weak Canadian Dollar

Driss EFFINA, PhD Independent Researcher, Global Strategy Files Decoded, analysis note No. 8, 24 October 2026. Reading time: about 55 minutes
Key takeaways
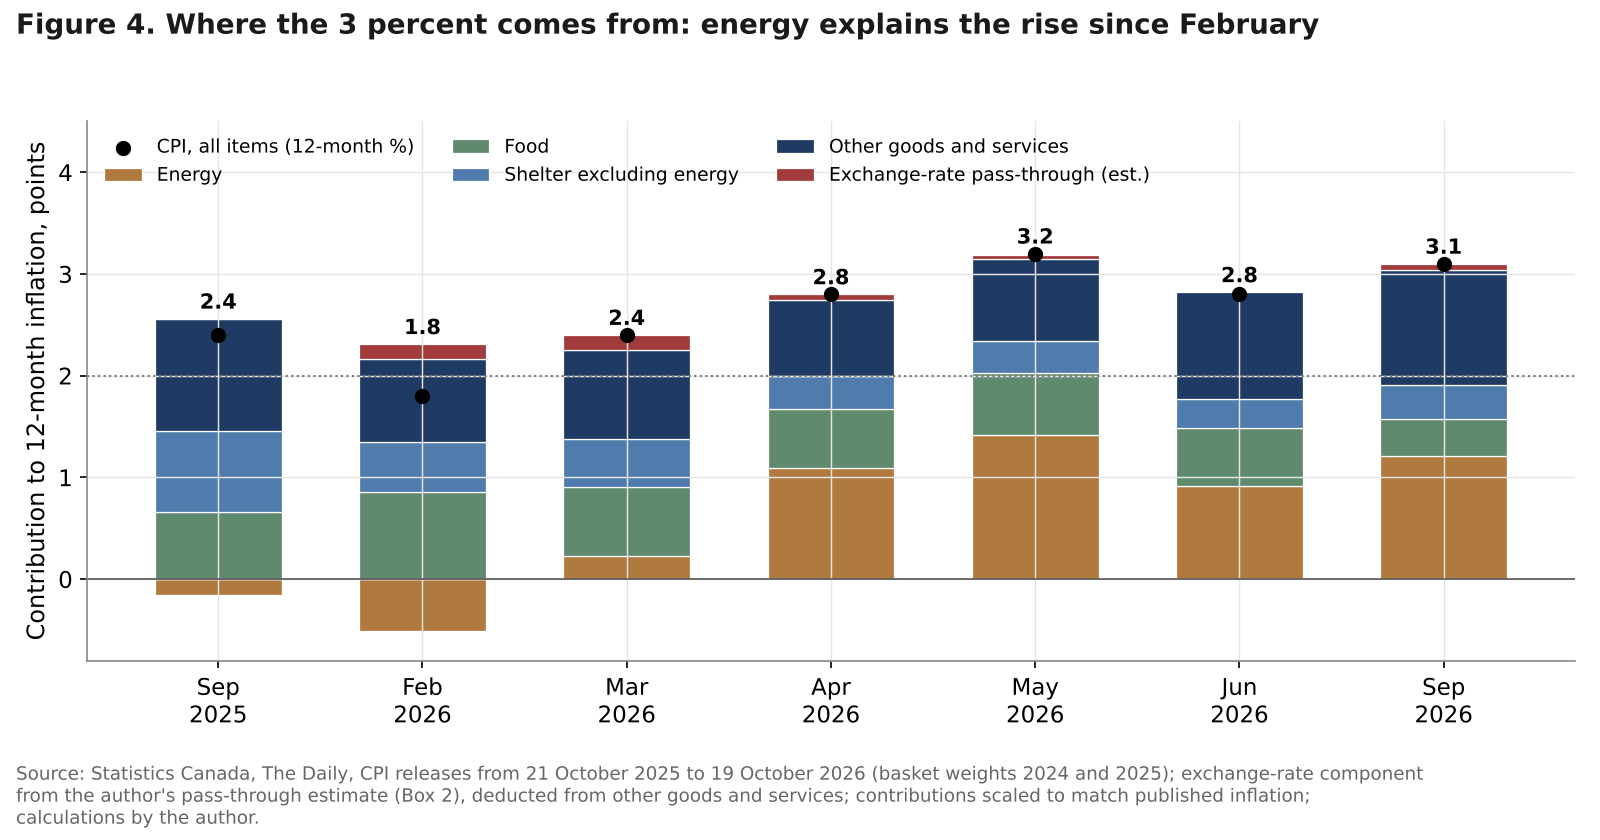
- Energy contributes 1.21 points of Canada’s 3.1 percent inflation and explains all of its rise since February; core inflation (trim and median) is 1.8 to 1.9 percent, the lowest since 2020.
- The loonie averaged 70.5 US cents in October, about 5 cents below the level implied by its historical link with oil; about 3 points of the depreciation since February are a trade-risk premium, not a rate effect.
- On weights revealed by its own decisions since 2015, the Bank’s loss is minimised near 1.70 percent; holding at 2.25 percent is optimal only if it weighs headline inflation 3.4 times more than in the past.
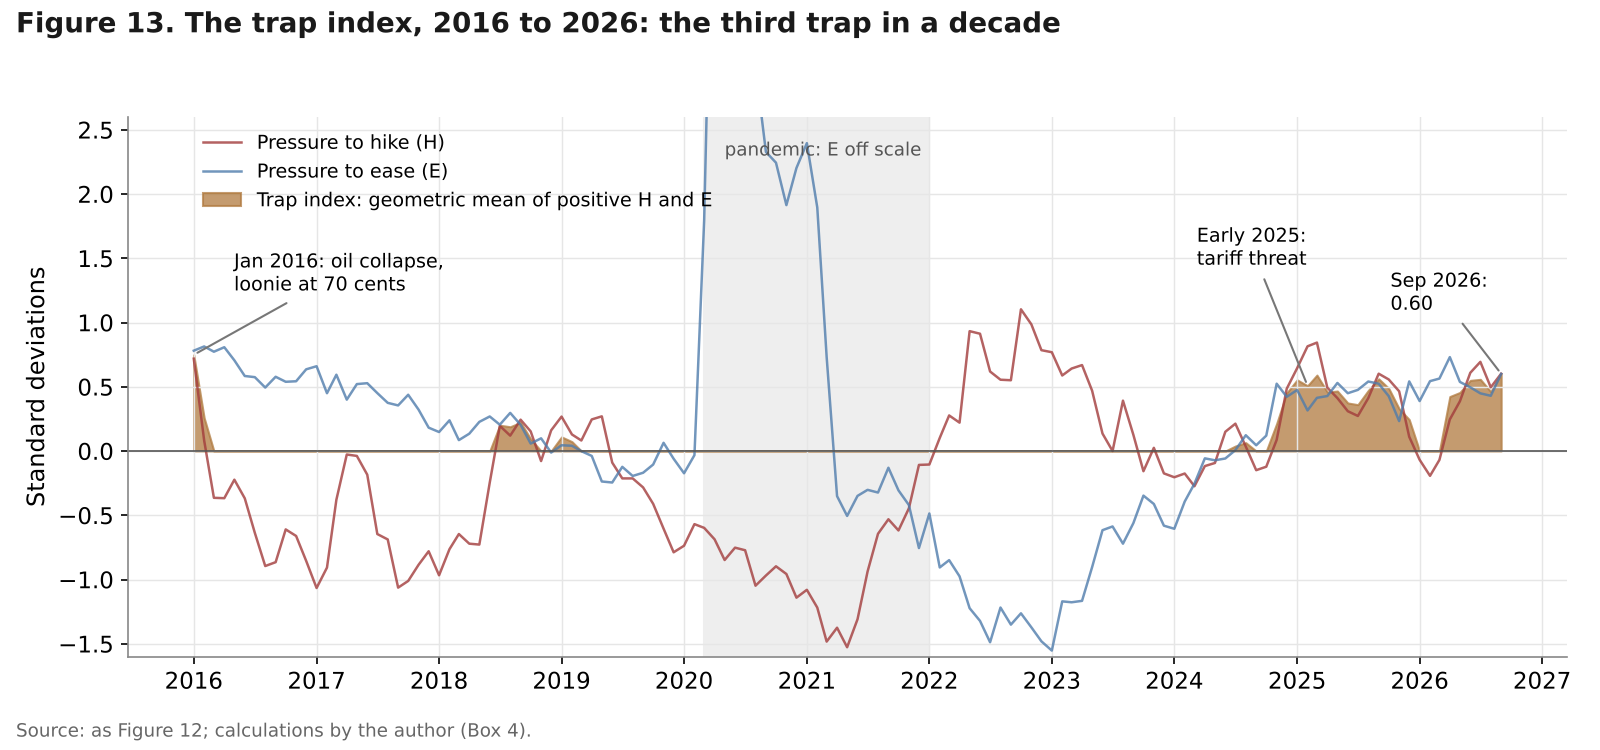
- The author’s trap index is at 0.60 in September and about 0.65 in October (98th percentile since 2016); a long hold is the most likely path (45 percent), and a cut into a weak loonie would deepen the trap.
Abstract
The Bank of Canada has held its policy rate at 2.25 percent at every decision since October 2025, and on 28 October 2026 it must decide again, with a new Monetary Policy Report. Headline inflation is 3.1 percent, core inflation 1.8 to 1.9 percent and unemployment 6.5 percent, and the Bank is caught between forces it does not control: oil up 79 percent since February, a Fed hike on 16 September, US tariffs of 50 percent on about 20 billion US dollars of Canadian goods from 22 August, the non-renewal of CUSMA on 1 July, and a Canadian dollar down to 70.5 US cents in October even though oil, which used to lift it, has soared. This note measures the trap with five original tools built on official data: a trade-off map of unemployment and inflation gaps across five economies; a decomposition of Canadian inflation into energy, food, shelter, other goods and services and exchange-rate pass-through; new estimates of pass-through and of the loonie’s fundamentals; a loss function whose weights are revealed by the Bank’s own reaction function since 2015; and a monthly trap index that is high only when the pressures to hike and to ease are high at the same time. Scenarios for the next four decisions, a dashboard and a dated watch list complete the note. The conclusion is that the Bank is not paralysed by indecision but by arithmetic: no rate setting can remove most of today’s loss, and the door that looks most attractive on domestic data, a cut, is the one most likely to deepen the trap.
Keywords: Bank of Canada, monetary policy trade-off, loss function, exchange-rate pass-through, Canadian dollar, oil shock, tariffs, CUSMA, policy divergence, household debt
JEL codes: E31, E52, E58, F31, F41, Q43
Key findings
1. The 3 percent is an oil number. Energy contributes 1.21 points of September’s 3.1 percent inflation, and its contribution has risen by 1.72 points since February, more than the 1.3-point rise in headline inflation. Shelter excluding energy adds only 0.34 point, against 0.80 a year earlier, and the average of CPI-trim and CPI-median, 1.85 percent, is the lowest since September 2020. On the trade-off map, Canada and France are the only two of five economies with headline inflation above target, core inflation below it and unemployment above its medium-term rate.
2. The loonie is weak for reasons the Bank did not cause. On its 2015 to 2025 relationship with oil, a 79 percent rise in Brent should have lifted the Canadian dollar by about 3.2 percent between February and October, to 75.7 US cents. It averaged 70.5 cents in October. Of the 2.3 percent depreciation between February and September, the rate gap with the Fed explains 0.2 point and broad dollar strength 0.8 point; 3.3 points are unexplained, a premium that coincides with the non-renewal of CUSMA and the August tariffs. Pass-through is small: 0.41 point of inflation per 10 percent depreciation, so the fall since February adds about 0.16 point over a year.
3. By its own history, the Bank should be lower, and that is the trap. A reaction function estimated on 2015 to 2026 puts the rate consistent with today’s gaps at 2.05 percent, and a loss function with the weights that this behaviour reveals reaches its minimum at 1.70 percent: a 25 basis point cut would lower the expected loss by 12 percent. Holding at 2.25 percent is optimal only if the Bank now weighs headline inflation 3.4 times more than in the past, which is what a central bank does when firms expect 3.7 percent inflation a year ahead. Even at the best setting, the loss that no rate can remove is 2.1 times its 2017 to 2019 average, and 98 percent of it comes from the conflict between headline inflation and jobs.
4. The trap index is at the 98th percentile, and markets are tightening for the Bank. The author’s trap index, the geometric mean of the pressures to hike and to ease, stands at 0.60 in September and about 0.65 in October; it has exceeded 0.5 in only 8 of 129 months since 2016, in January 2016, in 2025 and now. The pressures are exactly balanced. Meanwhile the 5-year yield has risen 0.76 point since February while the policy rate stayed put, and each 25 basis point hike would add about 0.15 percent of disposable income to mortgage interest within a year.
5. The most likely path is a long hold, and a cut would not release the trap. In the author’s scenarios, the Bank holds through March 2027 with probability 45 percent, hikes once or twice with probability 35 percent and cuts twice in 2027 with probability 20 percent; the probability-weighted policy rate is 2.34 percent after 28 October and 2.26 percent after 3 March. Headline inflation peaks at about 3.4 percent in the fourth quarter of 2026 on oil base effects and returns to about 2.1 percent by the third quarter of 2027. A cut into a weak loonie raises the trap index to about 1.0 by early 2027 instead of lowering it.
1. Introduction: a trap that makes no noise
A central bank is trapped when every available action makes at least one of its problems worse, and inaction makes none of them better. The Bank of Canada has been in that position for most of 2026, and it has attracted little attention because its visible decision, a hold at 2.25 percent, looks like calm. Behind the hold, four shocks from outside Canada have pulled its objectives in opposite directions.
The first is oil. The war involving Iran that began around the end of February disrupted the Strait of Hormuz. Brent averaged 70.9 US dollars a barrel in February, 117.3 in April, 83.8 in July and 127.0 in the first weeks of October. Canadian gasoline prices were 27.8 percent higher in September than a year earlier, and headline inflation rose from 1.8 percent in February to 3.1 percent. The second is trade. The United States declined to renew the Canada-United States-Mexico Agreement (CUSMA) at its first joint review on 1 July, which turns the six-yearly review into an annual one; talks on sectoral tariffs collapsed on 21 August, 50 percent tariffs on about 20 billion US dollars of Canadian goods took effect the next day, and Canada answered with counter-tariffs from 8 September. The third is the Federal Reserve, which raised its target range by 25 basis points to 3.75 to 4.00 percent on 16 September, its first increase since 2023. The fourth is the bond market: Canadian 5-year yields rose from 2.82 percent in February to 3.58 percent in October.
Each shock has a domestic signature: inflation near 3 percent, a Canadian dollar that fell while crude soared, 110,000 jobs lost in August and September, and a 5-year yield that now matters more to borrowers than the policy rate. The Bank said on 2 September that upside risks to inflation had increased and that the economy still had excess supply. Both statements are true, and that is the problem.
This note asks why the choice is so hard, and how hard. Section 3 draws a trade-off map, Section 4 decomposes the 3 percent, Section 5 estimates exchange-rate pass-through and Section 6 asks why the loonie is weak. Section 7 sets out the household debt constraint, building on Decoded No. 2. Section 8 estimates a loss function from the Bank’s own past decisions, Section 9 combines the pressures into a trap index and Section 10 gives scenarios for the next four decisions.
2. The setting in numbers
2.1 A year of holds
The Bank of Canada cut its target for the overnight rate to 2.50 percent on 17 September 2025 and to 2.25 percent on 29 October 2025, and has held it there since, at the decisions of 10 December 2025 and of 28 January, 18 March, 29 April, 10 June, 15 July and 2 September 2026. The next announcements are on 28 October and 9 December 2026; a Monetary Policy Report accompanies the January, April, July and October decisions.
The July 2026 Report projected real GDP growth of 0.7 percent in 2026 and 1.8 percent in 2027, and CPI inflation of 2.5 percent in 2026 and 2.0 percent in 2027, with inflation easing to about 2.5 percent in the second half of 2026 and reaching the target early in 2027. The economy then grew at a 3.3 percent annualised rate in the second quarter, after very weak growth in the first. The IMF’s October 2026 World Economic Outlook projects growth of 1.1 percent in 2026 and 1.7 percent in 2027, inflation of 2.8 and 2.4 percent, and unemployment of 6.5 and 6.3 percent.
Table 1. Canada at three dates. Core: average of CPI-trim and CPI-median. Term spread: 5-year benchmark yield minus the overnight target. Fed funds: effective rate, monthly average. Sources: Bank of Canada (Valet), Statistics Canada, FRED, ECB reference rates and market mids; calculations by the author.
| Indicator | September 2025 | February 2026 | September 2026 |
|---|---|---|---|
| Policy rate, % | 2.65 (average; cut on 17 Sep) | 2.25 | 2.25 |
| Fed funds, % | 4.22 | 3.64 | 3.75 |
| Fed minus Bank of Canada, points | 1.57 | 1.39 | 1.50 (1.625 on target midpoints in October) |
| CPI inflation, % | 2.4 | 1.8 | 3.1 |
| Core (trim and median average), % | 3.1 | 2.3 | 1.85 |
| CPI-common, % | 2.8 | 2.5 | 2.4 |
| Unemployment rate, % | 7.1 | 6.7 | 6.5 |
| 5-year yield, % | 2.77 | 2.81 | 3.57 (3.58 in October) |
| Term spread, points | 0.12 | 0.56 | 1.32 (1.33 in October) |
| USD/CAD, monthly average | 1.3831 | 1.3651 | 1.3963 (1.4184 in October) |
| Brent, USD a barrel | 68.0 | 70.9 | 114.2 (127.0 in October) |
| Real policy rate on core, points | -0.45 | -0.05 | +0.40 |
Three features of Table 1 matter for what follows. First, the real policy rate measured against core inflation has turned positive, +0.40 point against -0.45 a year earlier: the Bank has tightened in real terms without moving, because core inflation fell. Measured against headline inflation, the real rate is -0.85 point. Second, the Fed-Bank of Canada gap is back at its widest since 2015. On target midpoints it is 1.625 points in October, matching the 1.63 points of November 2025; the average from 2015 to 2019 was 0.10 point. Third, the term spread has almost tripled since February.
2.2 A labour market weaker than its unemployment rate
The unemployment rate peaked at 6.9 percent in April 2026 and was 6.5 percent in September, below the 7.1 percent of September 2025. Taken alone, that is not a picture of rising unemployment. But employment fell by 42,000 in August and 68,000 in September, the participation rate fell to 64.8 percent, its lowest since December 1997 outside 2020, and the job-finding rate was 30.6 percent against 36.5 percent in 2017 to 2019. The rate appears to be held down by people leaving the labour force. Unemployment is 1.7 points above its 2022 low of 4.8 percent and 0.54 point above the medium-term rate implied by the IMF’s projection for 2031, adjusted to the Labour Force Survey definition (5.96 percent). Average hourly wages rose 2.3 percent in the year to September.
2.3 Trade: from a review to a rupture
On 1 July, at the first joint review under Article 34.7 of CUSMA, the United States did not confirm a 16-year extension, which Canada and Mexico supported. The agreement remains in force, but annual joint reviews now apply until the parties agree to extend it or it expires on 1 July 2036. On 21 August talks on US sectoral tariffs broke down; US tariffs of 50 percent on about 20 billion US dollars of Canadian goods, including plywood, liquor, cement, dairy products and hockey equipment, took effect on 22 August. These come on top of earlier US tariffs of up to 50 percent on steel and aluminum, 25 percent on autos and up to 50 percent on softwood lumber. Canada announced counter-tariffs on about 20 billion dollars of US goods from 8 September, a “dollar for dollar” response in the Prime Minister’s words.
Counter-tariffs raise Canadian prices directly. A Bank of Canada staff study of the 2018 counter-tariffs (Lam, 2025) found pass-through of about 60 percent after six quarters, on items that made up less than 1 percent of the CPI basket. The 2026 counter-tariffs are an additional, slow-moving upside risk to prices that this note does not quantify item by item.
A first look at the results
The full note goes much further, with original models, scenarios and a dashboard of leading indicators. Two of its 15 charts and diagrams are shown below.
Continue reading
Get the full note: 26 pages, 15 charts and diagrams, 9 tables
This page shows the first part of the note. The full PDF adds: the trade-off map; decomposing the 3 percent; exchange-rate pass-through: real, but small; the loonie and the Fed: a petro-currency that did not rise; the debt constraint: why a hike is expensive; the loss function: why the Bank is trapped; the trap index; scenarios for the next four decisions; leading-indicators dashboard.
29 USD, instant PDF download, secure card payment.
Buy the full noteNeed this analysis for your organisation?
We prepare confidential briefings, executive talks and studies on countries, markets and policies, built on the same method as this article.
Request a briefingSupport independent analysis
Our studies are free to read and carry no advertising. If this one was useful, a small contribution helps us publish the next.
Support our workGo further: books by Global Strategy Files

Frequently asked questions
Why is the Bank of Canada not cutting rates with unemployment at 6.5 percent?
Because headline inflation is 3.1 percent and firms expect about 3.7 percent a year ahead. Core inflation is only 1.8 to 1.9 percent and the Bank’s own past behaviour would put its rate near 2.05 percent, but a cut would widen the gap with the Fed and weaken a loonie already at about 70 US cents. Holding is optimal only if the Bank weighs headline inflation 3.4 times more than in the past.
Why has the Canadian dollar fallen while oil prices rose in 2026?
Brent rose 79 percent between February and October 2026, which on the 2015 to 2025 relationship should have lifted the loonie to about 75.7 US cents. It averaged 70.5 cents in October. A model with rate gaps, oil and the broad dollar explains little of the fall: about 3 points are unexplained, a premium that coincides with the non-renewal of CUSMA on 1 July and the US tariffs of August 2026.
How much does a weaker Canadian dollar add to inflation?
The author’s estimates, on 2016 to early 2020 data, are about 0.27 point on core (CPIX) inflation and 0.41 point on total inflation for a 10 percent depreciation, close to the Bank of Canada’s benchmark of 0.3 and 0.6 point. The 3.8 percent fall from February to October 2026 therefore adds about 0.16 point to inflation over a year, far less than the 1.2 points contributed by energy.
Will the Bank of Canada raise rates on 28 October 2026?
In the author’s scenarios, the probability of a hike on 28 October is 35 percent and of a hold 65 percent. Over the next four decisions, to 3 March 2027, a long hold has a 45 percent probability, one or two hikes 35 percent and two cuts in 2027 20 percent. The probability-weighted policy rate is 2.34 percent after October and 2.26 percent after March 2027.
Sources
- Bank of Canada, “Bank of Canada maintains the policy rate at 2 1/4%”, press release, 2 September 2026.
- Bank of Canada, Monetary Policy Report, July 2026 (Overview; Projections).
- Bank of Canada, schedules of policy interest rate announcements for 2026 (August 2025) and 2027 (July 2026).
- Bank of Canada, Staff Analytical Paper 2026-21, “Assessing the US and Canadian neutral rates: 2026 update”, May 2026.
- Bank of Canada, Business Outlook Survey, Third Quarter of 2026, 19 October 2026, as summarised by ATB Financial and Mortgage Professional Canada, 20 October 2026.
- Savoie-Chabot, L. and Khan, M. (2015), “Exchange Rate Pass-Through to Consumer Prices: Theory and Recent Evidence”, Bank of Canada Discussion Paper 2015-9.
- Lam, A. (2025), “Assessing tariff pass-through to consumer prices in Canada: Lessons from 2018”, Bank of Canada Staff Analytical Note 2025-18.
- Bank of Canada Valet API: V39079, V80691335, V80691311, BD.CDN.5YR.DQ.YLD, STATIC_TOTALCPICHANGE, CPI_TRIM, CPI_MEDIAN, CPI_COMMON, CPIW, V41690973, V41693242.
- Statistics Canada, The Daily, “Consumer Price Index”, Table 1, releases of 21 October 2025 and 16 March, 20 April, 19 May, 22 June, 20 July and 19 October 2026; Nova Scotia Department of Finance, “Consumer Price Index, September 2026”.
- Statistics Canada, Labour Force Survey, September 2026 (as reported by The Hub, 9 October 2026), series v2062815 and v79311153; National balance sheet accounts, second quarter 2026 (as reported by BNN Bloomberg, 11 September 2026); 2026 release schedule.
- Federal Reserve Board, FOMC meeting calendars for 2026 and 2027; reports of the 16 September 2026 decision.
- FRED: FEDFUNDS, DCOILBRENTEU, CPIAUCSL, CPILFESL, UNRATE, QCAHAM770A, QUSHAM770A, QGBHAM770A, QFRHAM770A, QDEHAM770A.
- European Central Bank, euro foreign exchange reference rates (USD, CAD), to 14 September 2026; USD/CAD daily mid rates for September and October 2026 (Pound Sterling Live).
- IMF, World Economic Outlook, October 2026; ONS (D7G7, DKO8, MGSX); Eurostat HICP; ECB unemployment statistics.
- White and Case, “USMCA 2026 Joint Review: United States declines to extend Agreement, triggering annual reviews”, 2026.
- NPR, “Hours after U.S. imposes tariffs, Canada says it’ll strike back starting Sept. 8”, 21 August 2026; Bloomberg Government, 22 August 2026; Associated Press, 21 August 2026.
- The Canadian Press, “Is a Bank of Canada interest rate hike coming in October?”, 21 September 2026; CREA, 9 September 2026.
- Global Strategy Files, Decoded No. 2, “The Mortgage Reset Clock”, and Decoded No. 3, “Oil Shock, Not Yet a Wage Shock”, October 2026.
- Data retrieved on or before 24 October 2026; data files fetched on 20 October 2026.
Books from Global Strategy Files
Go further on this topic


