
Fighting Oil or the Deficit? Decoding the Fed’s First Hike of the Cycle

Driss EFFINA, PhD Independent Researcher, Global Strategy Files Decoded, analysis note No. 7, 24 October 2026. Reading time: about 60 minutes
Key takeaways
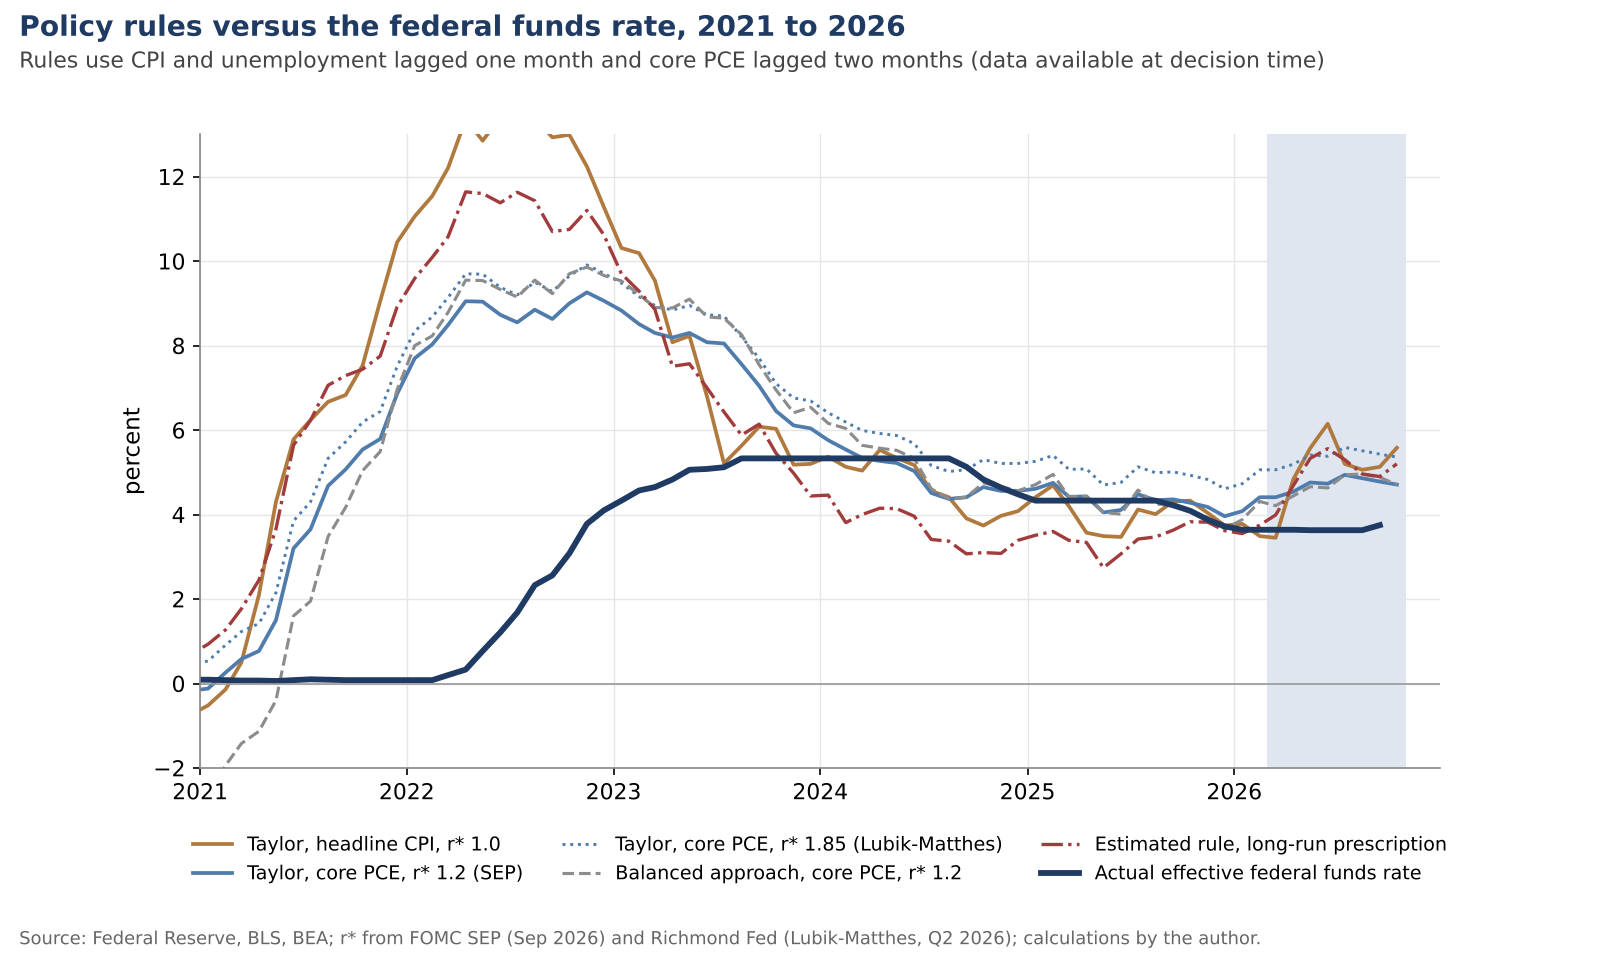
- The Fed is not fighting oil: rules on headline inflation miss the 2026 decisions by 1.1 to 1.4 points, and the 0.7-point rise in the 2026 median dot between March and September came entirely from core inflation, unemployment and the neutral rate, with zero weight on a 1-point jump in headline inflation.
- A Taylor rule built on the FOMC’s own next-year core PCE and unemployment projections reproduces the March, June and September dots within 0.07 point; on realised data an inertial core rule prescribes 4.00 percent for October, pointing to a December hike.
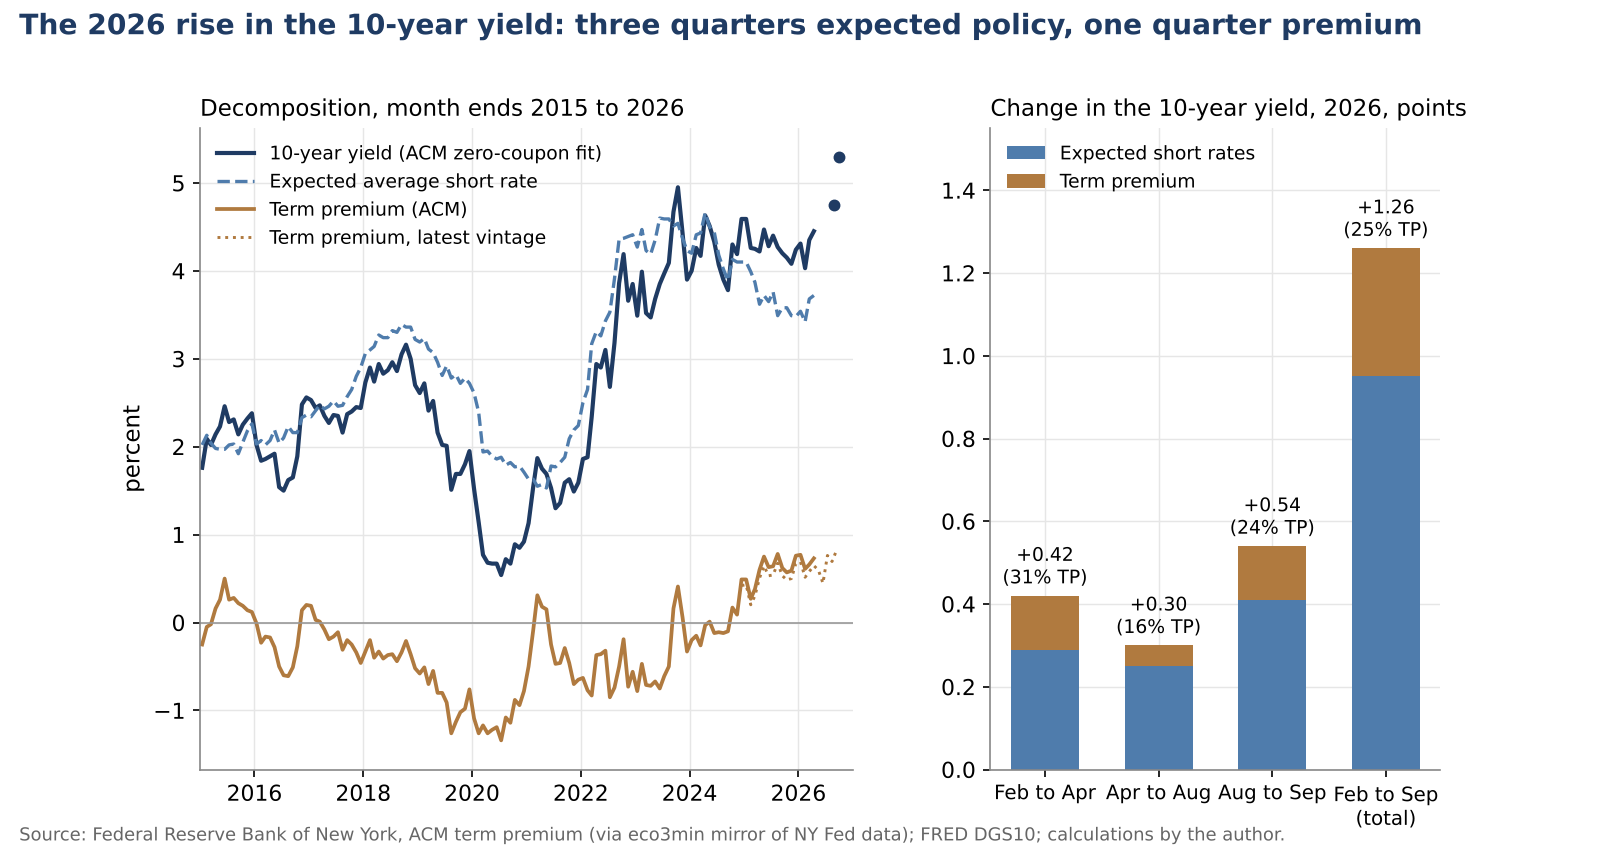
- The deficit sits in the level of rates, not in the hike: the FOMC’s neutral rate has risen 0.7 point since 2023, 81 percent of what deficit research implies, while markets price a neutral rate of 4.2 to 4.7 percent against the Fed’s 3.2.
- Fiscal dominance pressure is building (4.0 standard deviations above normal, net interest 21.2 percent of receipts) but the Fed has cut bill purchases to 10 billion dollars a month; the long end exports the tightening to Canada, the United Kingdom and the euro area.
Abstract
On 16 September 2026 the Federal Open Market Committee raised the federal funds target range by a quarter point, to 3.75 to 4.00 percent, its first increase since July 2023 and the first of the cycle under Chair Kevin Warsh. The move came as Brent crude climbed back above 110 dollars a barrel, headline inflation returned to 3.7 percent and the 10-year Treasury yield crossed 5 percent with the federal deficit at about 2.0 trillion dollars. Was the Fed fighting an oil shock it cannot control, or leaning against the inflationary consequences of fiscal policy? This note tests both readings. It decomposes the stance into energy, core and demand, and fiscal components; compares the 2026 decisions and projections with nine policy rules and an estimated reaction function; splits the rise in the 10-year yield into expected policy and term premium; builds an original fiscal dominance pressure indicator; and measures spillovers to Canada, the United Kingdom and the euro area. The answer is that the Fed is fighting neither oil nor the deficit directly. It is fighting core inflation and the demand that fiscal policy helps to sustain, and it has absorbed the deficit into a higher neutral rate rather than into the hike. Markets go further: they price a neutral rate 1 to 1.5 points above the FOMC’s 3.2 percent. Scenarios for the next four meetings, a dashboard of twelve indicators and a calendar to mid-2027 complete the analysis.
Keywords: Federal Reserve, FOMC, Kevin Warsh, rate hike, oil shock, Taylor rule, neutral rate, term premium, fiscal dominance, Treasury yields, spillovers, Bank of Canada, Bank of England, ECB
JEL codes: E43, E52, E58, E62, F42, Q43
Key findings
1. Not oil. Rules that respond to headline inflation miss the six 2026 decisions by 1.07 to 1.41 points (root mean squared error). Between March and September the FOMC raised its 2026 headline PCE projection by 1.0 point, yet the end-2026 median dot rose by only 0.7 point, all of it explained by next year’s core inflation (+0.45), lower unemployment (+0.20) and a higher neutral rate (+0.10). A headline rule would have added 1.5 points; energy received zero weight. 2. A forward-looking core rule fits the Committee almost exactly. A Taylor rule fed with the FOMC’s own next-year core PCE and unemployment projections reproduces the March, June and September median dots with an error of 0.07 point. On realised data, an inertial core rule (RMSE 0.13) tracks the decisions and prescribes 4.00 percent for October: half a step, pointing to December rather than October. 3. The deficit sits in the level, not in the move. The FOMC’s longer-run rate has risen from 2.5 to 3.2 percent since 2023, 81 percent of the 0.86 point that Laubach’s estimate of deficit effects implies for the projected rise in deficits (from 4.8 to 8.2 percent of GDP). This fiscal and structural component accounts for half of the 1.375 points by which the 3.875 percent midpoint exceeds the pre-2024 neutral rate; on core inflation the real policy rate (0.87 percent) is still below the Committee’s own neutral. 4. Markets price more deficit than the Fed. Of the 1.26-point rise in the 10-year yield between the end of February and the end of September, 75 percent was expected short rates and 25 percent term premium (ACM, 0.52 to 0.82 percent). The market’s expected average short rate over ten years exceeds the FOMC’s projected path by 0.65 to 1.04 points, implying a market neutral rate of 4.2 to 4.7 percent against the Committee’s 3.2 percent. 5. Fiscal dominance pressure is building, not binding. The author’s six-component indicator stands 4.0 standard deviations above its 2015 to 2019 baseline in 2026 and rises to 7.3 by 2031 on IMF projections; net interest took 21.2 percent of federal receipts in fiscal 2026. Yet the Fed cut its bill purchases from 40 to 10 billion dollars a month, and net of mortgage-backed securities run-off its holdings rose by only 9.3 percent of the deficit. 6. The long end exports the tightening. In 2026 a 1-point move in the US 10-year yield has passed through 0.78 point to Canadian 5-year yields and 0.71 and 1.06 to German and French 10-year yields; Canadian 5-year yields are up 0.75 point since February with the Bank of Canada on hold. In the author’s scenarios the probability-weighted midpoint reaches 4.04 percent after December and 4.06 percent in March 2027, with a 65 percent probability of a December hike, below the 76 to 80 percent priced by markets.
1. Introduction
A central bank that raises interest rates in the middle of an oil shock invites two suspicions. The first is that it is trying to push down a price it does not set: monetary policy cannot pump oil through the Strait of Hormuz, and a hike aimed at energy prices only adds a demand squeeze to a supply squeeze. The second is subtler. With the federal deficit at about 2.0 trillion dollars, net interest above 1.1 trillion dollars and 10-year yields at their highest since 2007, a hike could be read as the Fed taking on the inflationary consequences of a fiscal policy that Congress and the Treasury will not address. In that reading, the Fed is fighting the deficit.
Both suspicions matter for what comes next. If the Fed is fighting oil, the hike will reverse when Brent falls. If it is fighting the deficit, rates will stay high regardless of oil, and the 2027 debate will be about who controls the long end of the curve. If it is doing neither, the path depends on wages, services prices and the labour market, and oil is a risk factor rather than a target.
This note answers the question with evidence rather than by inference from statements. Chair Warsh has said that he is “not in the forward guidance business”, and the September statement offered no explanation beyond a “timelier return” to 2 percent, so the reaction function must be reconstructed from what the Committee did and projected. Figure 1 sets out the three channels and the tests applied to each. Section 2 reviews the 2026 decisions, Section 3 decomposes the stance, Section 4 compares the decisions with policy rules, Section 5 turns to the term premium and Section 6 to fiscal dominance pressure. Section 7 gives the verdict, Section 8 measures spillovers to Canada, the United Kingdom and the euro area, and Sections 9 to 12 present scenarios, a dashboard, implications and a calendar.
The note complements Decoded No. 1, on who pays for the 2026 yield surge, and Decoded No. 3, on second-round wage effects. Its object is the central bank’s reaction function itself: which force moved the policy rate, and which moved the yield curve without the Fed’s help.
2. The 2026 record: six meetings, a new chair and a hike
2.1 From an easing bias to a hike
The Federal Reserve entered 2026 with its target range at 3.50 to 3.75 percent after three quarter-point cuts between September and December 2025. The January statement described activity as expanding “at a solid pace” and inflation as “somewhat elevated”, and two members, Stephen Miran and Christopher Waller, dissented in favour of a further cut. In March, less than three weeks after the war involving Iran began and oil supply through the Strait of Hormuz was disrupted, the Committee held again and noted that the implications of developments in the Middle East for the US economy were “uncertain”. It kept the language on “the extent and timing of additional adjustments”, which markets read as a residual easing bias.
The April meeting, Jerome Powell’s last as chair, marked the turn. Inflation was now “elevated” rather than “somewhat elevated”, with energy prices cited explicitly, and the vote was 8 to 4, the largest number of dissents since 1992: Governor Miran wanted a cut, while Beth Hammack, Neel Kashkari and Lorie Logan accepted the hold but objected to the easing bias. Kevin Warsh was confirmed by the Senate in mid-May and chaired his first meeting on 16 and 17 June. The June statement dropped forward guidance, attributed part of the overshoot to “supply shocks that have driven price increases in certain sectors, including energy”, and added a sentence that has stayed since: “The Committee will deliver price stability.” The vote was unanimous. In July the same three regional presidents dissented for an immediate quarter-point increase. In September the Committee moved, by 12 votes to none.
Table 1. The six FOMC decisions of 2026. Midpoint of the target range after each meeting. Sources: Federal Reserve Board, FOMC statements; Continuum Economics and CF Benchmarks meeting reviews for the composition of dissents.
| Meeting | Decision | Target range, % | Vote | Dissents | Key statement language |
|---|---|---|---|---|---|
| 28 Jan 2026 | Hold | 3.50 to 3.75 | 10-2 | Miran, Waller (cut) | Activity “solid”; inflation “somewhat elevated” |
| 18 Mar 2026 | Hold | 3.50 to 3.75 | 11-1 | Miran (cut) | Middle East implications “uncertain”; easing bias kept |
| 29 Apr 2026 | Hold | 3.50 to 3.75 | 8-4 | Miran (cut); Hammack, Kashkari, Logan (against easing bias) | Inflation “elevated”, energy cited; Powell’s last meeting as chair |
| 17 Jun 2026 | Hold | 3.50 to 3.75 | 12-0 | None | Supply shocks “including energy”; “will deliver price stability” |
| 29 Jul 2026 | Hold | 3.50 to 3.75 | 9-3 | Hammack, Kashkari, Logan (hike) | Inflation elevated “partly due to supply shocks” |
| 16 Sep 2026 | Hike 25 bp | 3.75 to 4.00 | 12-0 | None | “timelier return” to 2 percent |
Two features of this record matter. The hawkish pressure came from the Reserve Bank presidents before the Board: ten dissenting votes were cast in the first five meetings, and the three regional presidents moved from objecting to the easing bias in April to voting for a hike in July. And the statements never mentioned fiscal policy, the deficit or long-term yields. Whatever weight the Committee gives to the deficit, it has not put it in writing.
The implementation note of 16 September set interest on reserve balances at 3.90 percent, the overnight reverse repurchase rate at 3.75 percent and the standing repo and primary credit rates at 4.00 percent, effective 17 September. The balance sheet language was unchanged: the Committee continues to maintain ample reserves and to buy Treasury bills “as appropriate”.
2.2 What the Committee projected
The Summary of Economic Projections is the closest thing the FOMC now offers to a statement of intent. Warsh has declined to submit his own projections, citing his long-held reservations about the exercise “at least as currently structured”, but the other eighteen participants continue to submit. Table 2 shows how the projections moved through the year.
Table 2. FOMC median projections, March, June and September 2026. Real GDP and inflation: fourth quarter to fourth quarter; unemployment: fourth-quarter average; federal funds rate: year-end midpoint. Source: Federal Reserve Board, Summary of Economic Projections.
| Variable | March 2026 | June 2026 | September 2026 |
|---|---|---|---|
| Real GDP growth 2026, % | 2.4 | 2.2 | 2.3 |
| Unemployment rate end-2026, % | 4.4 | 4.3 | 4.1 |
| Unemployment rate end-2027, % | 4.3 | 4.3 | 4.1 |
| PCE inflation 2026, % | 2.7 | 3.6 | 3.7 |
| Core PCE inflation 2026, % | 2.7 | 3.3 | 3.4 |
| Core PCE inflation 2027, % | 2.2 | 2.5 | 2.5 |
| Federal funds rate end-2026, % | 3.4 | 3.8 | 4.1 |
| Federal funds rate end-2027, % | 3.1 | 3.6 | 4.1 |
| Federal funds rate, longer run, % | 3.1 | 3.1 | 3.2 |
| Participants submitting | 19 | 18 | 18 |
The September dot plot is unusually concentrated: twelve of eighteen participants placed the end-2026 rate at 4.125 percent, four at 4.375 percent and two at 3.875 percent. In June, eight had still pencilled in 3.625 percent, the pre-hike midpoint. The median participant expects core PCE inflation to return to 2.0 percent only in 2029, a point Warsh acknowledged at his press conference by describing these as “the forecasts of my 18 colleagues”.
Figure 2 places the decisions in context. Brent rose from 70.9 dollars a barrel in February to 117.3 dollars in April, fell to 83.8 dollars in July and climbed to 114.2 dollars in September and 127.0 dollars in early October. Headline CPI inflation went from 2.4 percent in February to 4.2 percent in May and 3.7 percent in September. Core inflation barely moved: core CPI was 2.5 percent in February and 2.6 percent in September, and core PCE inflation rose from 2.96 to 3.01 percent between February and August. Michigan one-year household expectations jumped from 3.4 to 4.8 percent between February and May before easing to 4.0 percent in August; the 5-year breakeven peaked at 2.62 percent in May and stood at 2.36 percent in October. Unemployment fell from 4.4 percent in February to 4.1 percent in August and was 4.2 percent in September.
A first look at the results
The full note goes much further, with original models, scenarios and a dashboard of leading indicators. Two of its 14 charts and diagrams are shown below.
Continue reading
Get the full note: 27 pages, 14 charts and diagrams, 9 tables
This page shows the first part of the note. The full PDF adds: decomposing the stance: oil, core and the deficit; which rule is the Fed following?; the long end: expected policy versus term premium; fiscal dominance pressure: building, not binding; the verdict: oil, core or the deficit?; international spillovers: Canada, the United Kingdom and the euro area; scenarios for the next four FOMC meetings; leading-indicators dashboard; implications for policy and for investors.
29 USD, instant PDF download, secure card payment.
Buy the full noteNeed this analysis for your organisation?
We prepare confidential briefings, executive talks and studies on countries, markets and policies, built on the same method as this article.
Request a briefingSupport independent analysis
Our studies are free to read and carry no advertising. If this one was useful, a small contribution helps us publish the next.
Support our workGo further: books by Global Strategy Files

Frequently asked questions
Why did the Federal Reserve raise rates in September 2026?
The FOMC raised its target range by a quarter point to 3.75 to 4.00 percent on 16 September 2026, its first increase since July 2023, to support a timelier return to 2 percent inflation. This note finds the decision tracks core inflation and the labour market: a rule based on the FOMC’s own next-year core PCE and unemployment projections reproduces its median dots within 0.07 point, while the oil-driven rise in headline inflation received no weight.
Is the Fed fighting the oil shock?
No. Policy rules that respond to headline inflation miss the six 2026 decisions by 1.1 to 1.4 percentage points. Between March and September the FOMC raised its 2026 headline PCE inflation projection by a full point, but the rise in its median rate projection is fully explained by next year’s core inflation, lower unemployment and a slightly higher neutral rate. The Fed is watching oil as a risk to expectations, not reacting to it.
Is the Fed fighting the US budget deficit?
Not directly. The deficit, about 2.0 trillion dollars in fiscal 2026, enters through a higher neutral rate: the FOMC’s longer-run rate rose from 2.5 to 3.2 percent since 2023, close to what research on deficits and interest rates predicts. Markets go further, pricing a neutral rate of 4.2 to 4.7 percent and a 10-year term premium near 1 percent. The Fed has not leaned against long yields and has cut its bill purchases.
What will the Fed do at its next meetings?
In the author’s scenarios, the most likely path (45 percent) is a hold on 28 October, a quarter-point hike in December to 4.00 to 4.25 percent and a pause through March 2027. The probability-weighted target midpoint is 4.04 percent after December and 4.06 percent in March 2027, with a 65 percent chance of a December hike, below market pricing of 76 to 80 percent. A disorderly rise in the term premium could force a cut instead.
Sources
- Federal Reserve Board, FOMC statements of 28 January, 18 March, 29 April, 17 June, 29 July and 16 September 2026, and implementation note of 16 September 2026.
- Federal Reserve Board, Summary of Economic Projections, 18 March, 17 June and 16 September 2026 (projection tables and dot plots).
- Federal Reserve Board, transcript of Chair Warsh’s press conference, 16 September 2026.
- Federal Reserve Board, “Meeting calendars, statements, and minutes (2021 to 2027)”, and press release “Federal Open Market Committee announces its tentative meeting schedule for 2027”, 5 September 2025.
- Federal Reserve Board, H.4.1 Factors Affecting Reserve Balances, release of 15 October 2026.
- Federal Reserve Bank of St. Louis, FRED: FEDFUNDS, CPIAUCSL, CPILFESL, PCEPILFE, UNRATE, MICH, T5YIE, DCOILBRENTEU, MORTGAGE30US, AHETPI, ECIWAG, JTSJOL, ECBDFR (retrieved 20 October 2026); FEDTARMDLR (FOMC longer-run median); THREEFYTP10 (Kim-Wright 10-year term premium, retrieved 20 October 2026); ALFRED GS10 (monthly 10-year yield, May to September 2026).
- YCharts, “10 Year Treasury Rate” (DGS10 daily values, August to October 2026) and “10 Year Real Treasury Rate” (TIPS, August to October 2026).
- Federal Reserve Bank of New York, Adrian-Crump-Moench Treasury term premia, monthly data via eco3min datasets “us-term-premium” and “ACM 10-year decomposition 1961 to 2026”.
- Eco3min, “Fed Funds and r-star: the natural rate as the FOMC’s implicit target” (summary of HLW, Lubik-Matthes and SEP estimates).
- Continuum Economics, FOMC meeting reviews of 28 January and 29 April 2026; CF Benchmarks, “Fed holds steady in Powell’s final meeting as chair” (April 2026); Investor Daily, “Warsh era: no dot plot, no dovishness” (June 2026); FX Leaders, report of Kevin Warsh’s Senate confirmation, 14 May 2026.
- OMFIF, “Jackson Hole 2026: Warsh avoids the elephant in the room”, 1 September 2026.
- Trading Economics, US 10-year Treasury yield news (30 September and 22 to 23 October 2026) and “Warsh comments boost bets on Fed rate hold in October” (16 October 2026); Crypto Briefing, “Market raises odds of a 25 bps Fed rate hike” (15 October 2026, CME FedWatch); KuCoin News, term premium report (9 October 2026).
- Congressional Budget Office, Monthly Budget Review: September 2026 (October 2026); The Budget and Economic Outlook: 2026 to 2036 (February 2026), as summarised by the Committee for a Responsible Federal Budget.
- US Department of the Treasury, Quarterly Refunding Statement, 5 August 2026 (as reported by Newsquawk).
- American Banker / Bloomberg, “Fed to maintain reserve management purchases at 10 billion dollars”, 11 June 2026.
- International Monetary Fund, World Economic Outlook and Fiscal Monitor databases, October 2026: GGXCNL_NGDP, GGXONLB_G01_GDP_PT, GGR_G01_GDP_PT, GGXWDG_NGDP, NGDPD (retrieved 20 October 2026).
- Laubach, T. (2009), “New Evidence on the Interest Rate Effects of Budget Deficits and Debt”, Journal of the European Economic Association 7(4), 858 to 885.
- Taylor, J. B. (1993), “Discretion versus policy rules in practice”, Carnegie-Rochester Conference Series on Public Policy 39, 195 to 214.
- European Central Bank, Data Portal: deposit facility rate; long-term interest rates for convergence purposes (10-year yields, France and Germany); Eurostat HICP (prc_hicp_minr) (retrieved 20 to 21 October 2026).
- Banco de Espana, “ECB raises rates by 25 basis points in June” (11 June 2026); Financial News (fnnews), ECB decision of 10 September 2026; ECB, schedules of Governing Council meetings.
- Bank of England, Bankstats: IUMABEDR, IUMBV34, IUMBV42 (retrieved 20 October 2026); MTS Insights, “Bank of England Monetary Policy Decision: September 2026”; Bank of England, “Monetary Policy Committee dates for 2026” and “MPC dates for 2027”.
- Office for National Statistics: D7G7, DKO8 (retrieved 20 October 2026).
- Bank of Canada, Valet data: V39079, BD.CDN.5YR.DQ.YLD, STATIC_TOTALCPICHANGE, CPI_TRIM, CPI_MEDIAN (retrieved 20 October 2026); Perch, “Bank of Canada interest rate announcement, September 2, 2026”; Storeys, “Bank of Canada rate announcements 2026”; Bank of Canada, “Bank of Canada publishes 2027 schedule for policy interest rate announcements” (July 2026).
- US Bureau of Labor Statistics, release schedules for the Consumer Price Index and the Employment Situation (October 2026 to June 2027); US Bureau of Economic Analysis, release schedule (October to December 2026).
Books from Global Strategy Files
Go further on this topic


