
Critical Minerals 2030: Who Stays Exposed. Export Controls, Allied Pipelines and the Time to Independence for the United States, United Kingdom, France, Germany and Canada

Driss EFFINA, PhD Independent Researcher, Global Strategy Files Foresight, prospective note No. 13, 24 October 2026. Reading time: about 55 minutes
Key takeaways
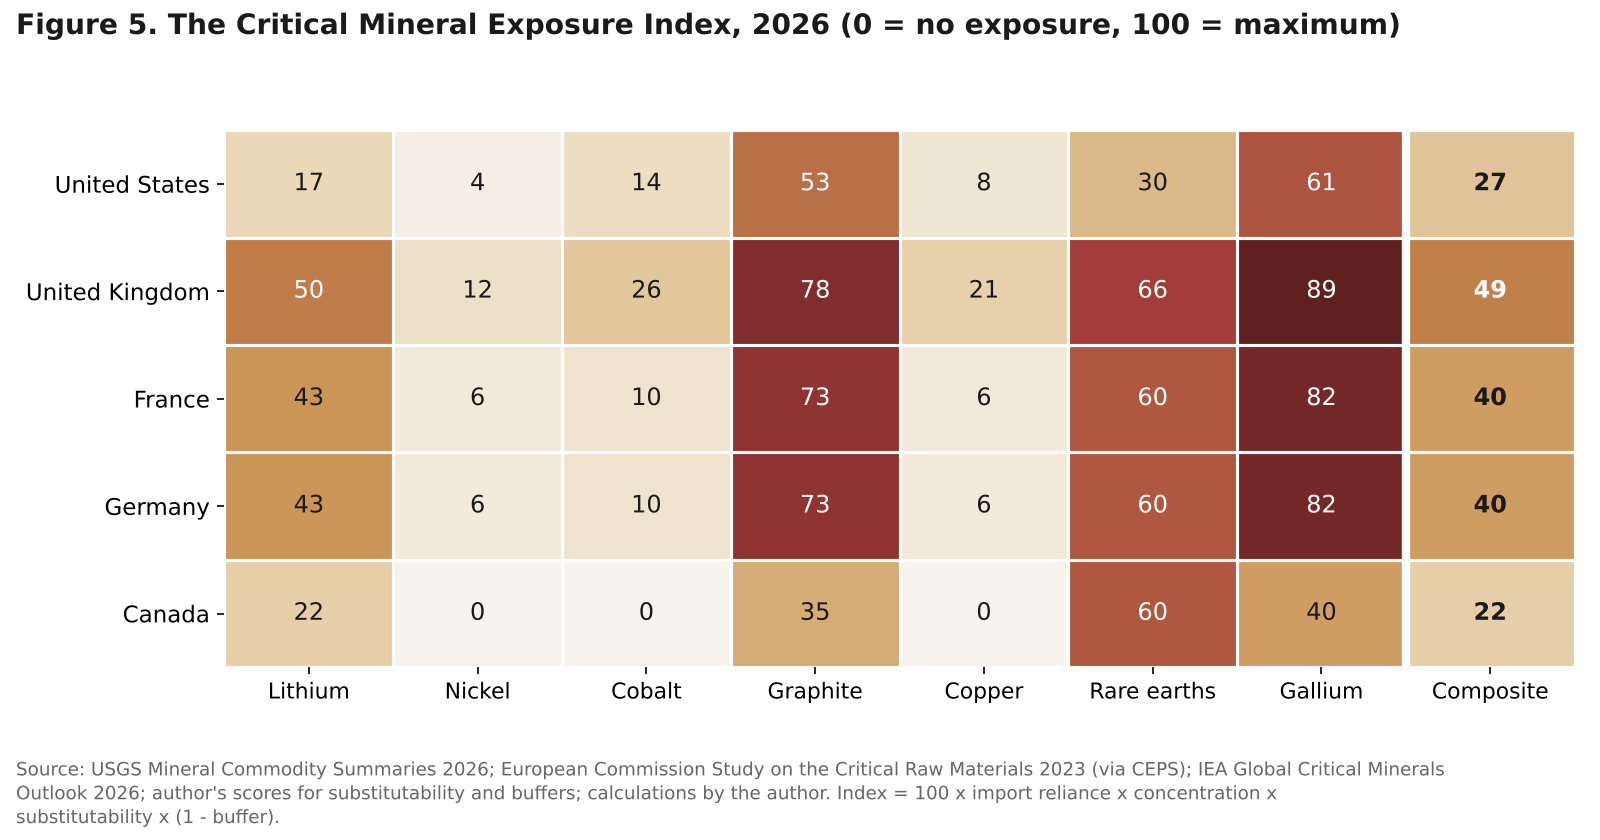
- On the author’s Critical Mineral Exposure Index, the United Kingdom scores 48.9, France and Germany 40.1, the United States 26.7 and Canada 22.3; weighted by exposed industry, Germany’s economic exposure is 2.8 times that of the next country.
- Buffers are the fastest lever: US stockpiles, price floors and equity stakes cut its exposure by 35 percent, while Germany holds no state stocks at all.
- By 2030 copper and cobalt face global deficits of about 16 and 22 percent of requirements, while graphite and rare earths remain a problem of where refining happens: China still refines about 89 and 80 percent.
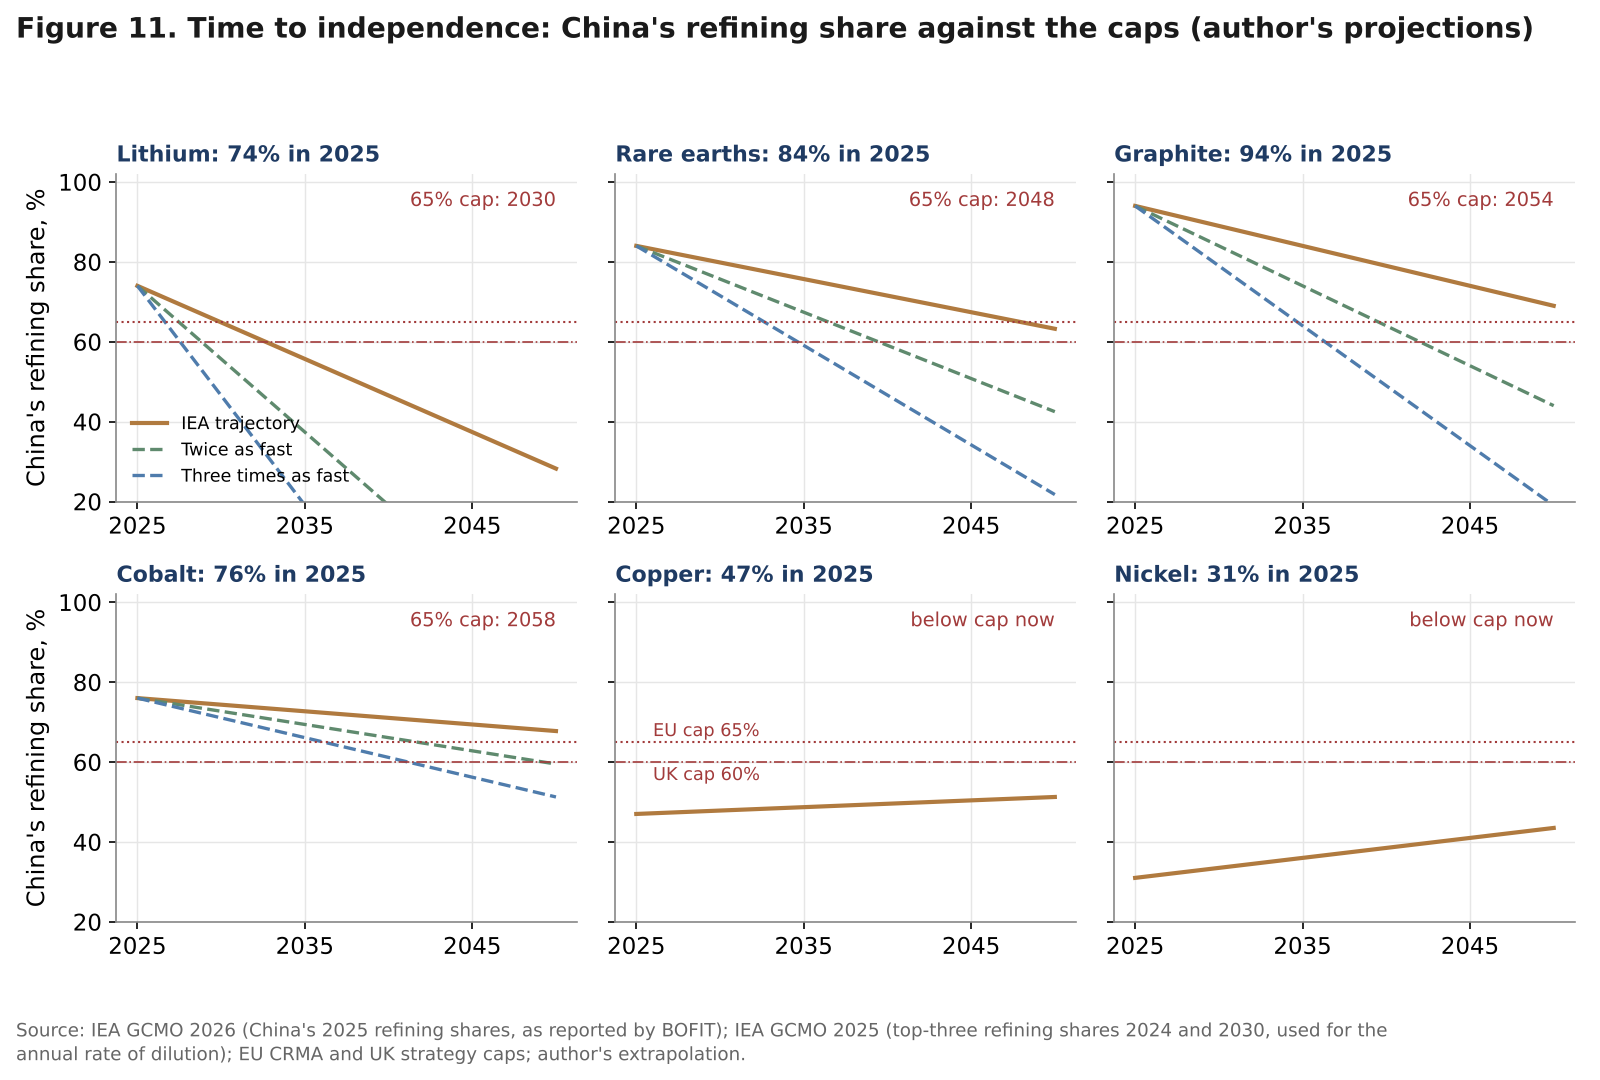
- On the IEA’s own trajectory China’s refining share falls below 65 percent around 2030 for lithium but only around 2048 for rare earths and 2054 for graphite; a six-month disruption under the October 2025 rules would cost Germany about 0.5 percent of GDP.
Abstract
Between August 2023 and October 2025 China built a licensing regime that now covers gallium, germanium, graphite, antimony, tungsten and twelve rare earth elements, and in October 2025 it added a rule that reaches foreign-made products containing as little as 0.1 percent of Chinese rare earths by value. Most of the October 2025 package was suspended for one year after the Busan meeting of 30 October 2025, and the US-China truce has since been extended to 10 January 2027. Nothing has been repealed. The April 2025 controls on seven heavy rare earths remain in force, outside prices for gallium and heavy rare earths are about five times Chinese domestic prices, and the number of mineral tariff lines under Chinese control has roughly tripled since 2023. At the same time, other producers have learned the method: the Democratic Republic of the Congo caps cobalt exports, Indonesia cut its 2026 nickel ore quota by about a third, and Zimbabwe suspended lithium concentrate exports.
This note asks which of five advanced economies stays exposed to mineral supply shocks until 2030, how much a disruption would cost, and how long independence would take. It builds five original tools: a Critical Mineral Exposure Index by country and mineral, combining import reliance, supplier concentration measured by the Herfindahl-Hirschman index (HHI), China’s refining share, substitutability and buffers; a supply-requirement gap model to 2030 for lithium, nickel, cobalt, graphite, copper and magnet rare earths under three supply cases; an estimate of output at risk from a six-month disruption, using input-output multipliers; a “time to independence” calculation based on the pace at which China’s refining share is projected to fall; and four scenarios to 2030 with probabilities. All projections are the author’s.
Keywords: critical minerals, rare earths, gallium, graphite, lithium, cobalt, copper, export controls, supply chain security, Critical Raw Materials Act, Defense Production Act, Project Vault, price floors, stockpiles, HHI, scenarios
JEL codes: F13, F52, L72, Q31, Q37, Q38
Key findings
1. The United Kingdom is the most exposed on supply, Germany the most exposed in economic terms. On the author’s Critical Mineral Exposure Index (0 to 100), the United Kingdom scores 48.9, France and Germany 40.1, the United States 26.7 and Canada 22.3. The ranking is robust: in 20,000 Monte Carlo draws over weights, scores and buffers, the United Kingdom ranks first every time. Weighted by the size of exposed industries (vehicles, electronics, electrical equipment and aerospace equal 6.8 percent of German GDP against 2.0 to 2.7 percent elsewhere), Germany’s economic exposure reaches 83.7, 2.8 times that of the next country. Gallium (average score 70.8), graphite (62.5) and rare earths (55.2) are the hot spots in all five countries.
2. Buffers are the fastest lever, and only the United States has built them at scale. Before buffers, the United States would score 41.1, close to France and Germany. Its stockpile programmes, price floor and equity stakes cut its exposure by 35 percent. Project Vault alone (10 billion dollars of Export-Import Bank lending plus about 2 billion of private capital) is 13.3 times the IEA estimate of the net annual cost of stockpiling eleven high-risk materials for all countries outside the dominant supplier. Germany reported in August 2026 that it holds no state stocks of critical raw materials at all.
3. By 2030 the shortage is global for copper and cobalt, but local for graphite and rare earths. On the author’s gap model anchored on IEA requirements, copper supply falls 16 percent short of primary requirements in 2030 and cobalt 22 percent short in the pipeline case, rising to 24 and 35 percent with disruptions and high demand. Lithium is roughly balanced until 2030 before tipping into deficit. Graphite and magnet rare earths are a location problem: refined supply outside China grows only 1.44 times for rare earths between 2025 and 2030, and China still refines about 80 percent of magnet rare earths and 89 percent of battery graphite in 2030.
4. A six-month disruption under the October 2025 rules would cost Germany about 0.5 percent of GDP. If the suspended October 2025 regime entered into force with slow licensing, the author’s model puts the output loss at 0.48 percent of GDP for Germany (about 26 billion dollars) and 0.11 to 0.13 percent for the other four, 74 billion dollars in total. An embargo on allies would cost Germany 1.5 percent of GDP and the five economies about 241 billion dollars. Vehicles account for more than two-thirds of the German loss.
5. Independence is a 2040s project, not a 2030 one. On the IEA’s own projected rate of dilution, China’s refining share falls below the 65 percent cap of the EU Critical Raw Materials Act around 2030 for lithium, but only around 2048 for rare earths, 2054 for graphite and 2058 for cobalt. Doubling the pace brings rare earths to 2036 and graphite to about 2040. Only 10 to 24 percent of each country’s 2026 exposure is resolved by 2030.
6. The scenarios change the level of exposure, not the ranking. The author assigns 35 percent to a managed truce, 25 percent to an allied build-out, 25 percent to a licence squeeze and 15 percent to a bloc rupture. The probability-weighted index falls by about 6 to 7 points in every country by 2030, but the United Kingdom (42.9) remains the most exposed and, even in the allied build-out, ends 2030 above the level of the United States today.
1. Introduction: from a risk to an instrument
For two decades the concentration of mineral processing in China was treated as a commercial fact: cheap power, tolerant permitting and scale had pushed refining east, and buyers in Europe and North America accepted the trade-off. The events of 2023 to 2026 changed the nature of that fact. Concentration became an instrument, used in cycles of escalation and truce, and the five economies covered here discovered that the chokepoint was rarely the mine. It was the refinery, the separation plant and the magnet line.
Three features distinguish the current episode from the rare earth dispute with Japan in 2010. First, the controls are legal and administrative rather than informal: licences, end-user declarations and, since October 2025, a rule with extraterritorial reach. Second, they now cover the battery chain (graphite anodes, cathode materials and high-energy lithium-ion batteries were in the October 2025 package) as well as defence and electronics inputs. Third, producer countries outside China have adopted similar tools, so diversification away from China does not by itself bring security.
The war involving Iran since the end of February 2026 adds a fourth layer. Around half of global seaborne sulphur trade passes through the Strait of Hormuz, according to the IEA, and sulphuric acid prices doubled from 144 dollars per tonne in February 2026 to 283 dollars in April. Acid is a reagent for leaching copper, processing about 60 percent of battery-grade lithium chemicals and separating rare earths. Brent crude averaged 127.0 dollars a barrel in October 2026, against 70.9 dollars in February. Mineral security is now entangled with energy security.
This note quantifies who stays exposed until 2030. It does not repeat the energy-mix analysis of Foresight No. 8 or the industrial policy comparison of Foresight No. 12; it focuses on the mineral inputs themselves. Figure 1 sets out the transmission chain that the rest of the note quantifies: chokepoints, channels, exposed activities and macroeconomic outcomes, with buffers and policy levers acting at each stage.
Section 2 documents the control regime. Section 3 compares the five policy responses. Section 4 measures concentration. Section 5 presents the Exposure Index. Section 6 projects supply and requirements to 2030. Section 7 estimates the cost of a disruption. Section 8 asks how long independence takes. Section 9 sets out four scenarios. Sections 10 to 12 give the dashboard, the implications and the calendar.
2. The control regime: switched on, paused, not repealed
2.1 Three years of measures
Table 1 lists the main Chinese measures since 2023 and their status as of 24 October 2026. The pattern is cumulative. Each round added minerals, stages or legal reach, and each truce suspended only the latest layer.
Table 1. China’s export controls on critical minerals and related items, 2023 to 2026
| Date | Measure | Coverage | Status at 24 October 2026 |
|---|---|---|---|
| August 2023 | Licensing of gallium and germanium | Metals, compounds, wafers | In force |
| December 2023 | Graphite licensing; ban on rare earth processing technology exports | Natural and synthetic graphite; extraction, separation and magnet technology | In force |
| 3 December 2024 | MOFCOM No. 46 | Dual-use items to US military users (Art. 1); gallium, germanium, antimony to the US (Art. 2) | Art. 1 in force; Art. 2 suspended to 27 November 2026 |
| February 2025 | MOFCOM No. 10 | Tungsten, tellurium, bismuth, molybdenum, indium | In force |
| 4 April 2025 | MOFCOM No. 18 | Seven medium and heavy rare earths (Sm, Gd, Tb, Dy, Lu, Sc, Y), including some magnets | In force |
| 9 October 2025 | MOFCOM Nos. 55 to 58, 61, 62 | Five more rare earths (Eu, Ho, Er, Tm, Yb); 0.1% value rule; technologies; lithium batteries, cathodes, graphite anodes | Suspended to 10 November 2026 (No. 70); truce extended to 10 January 2027 |
| 6 January 2026 | MOFCOM No. 1 of 2026 | Dual-use items for Japanese military end users | In force |
| June to July 2026 | Entity listings | MP Materials, USA Rare Earth; 14 European entities | In force |
Source: MOFCOM announcements as compiled by industry and legal trackers; USGS Mineral Commodity Summaries 2026; BISI and FXStreet reporting (September and October 2026).
The IEA counts the result in tariff lines: the number of mineral tariff codes subject to Chinese export controls rose from about 20 in 2023 to more than 80 in 2025, and exports of restricted items from China exceeded 11 billion dollars in 2025. The agency estimates that full implementation of the October 2025 rare earth package could put about 6.5 trillion dollars a year of downstream production outside China at risk, and full disruption of battery-grade graphite trade over 300 billion dollars. These are exposure figures, not loss forecasts, but they define the scale.
2.2 The truce and its limits
After the Busan meeting of 30 October 2025, China suspended the October package until 10 November 2026 and suspended the US-specific ban of December 2024 until 27 November 2026. A White House fact sheet after the President’s visit to Beijing in May 2026 said China would address shortages of yttrium, scandium, neodymium and indium. Xi Jinping made a state visit to the United States in late September 2026, and on 28 September the Ministry of Commerce said the trade arrangements with the United States had been extended to 10 January 2027. Its statement did not mention rare earths explicitly, and post-summit reporting suggests rare earths were left for later talks.
The data show both the reach and the elasticity of the instrument (Figure 2). In May 2025, one month after the April controls, Chinese exports of rare earth magnets fell by 74.3 percent year on year and those to the United States by 93.3 percent, to 46.4 tonnes. Ford idled its Explorer plant for lack of magnets. Shipments recovered with licensing: China exported 6,165 tonnes of magnets in September 2026, a record for the year, and 48,055 tonnes in the first nine months, up 20 percent. But the composition changed. In January and February 2026, the United States took 9.2 percent of China’s magnet exports (994 tonnes, down 22.5 percent), against 44.4 percent for the European Union (4,775 tonnes, up 28.4 percent). Exports of dysprosium, terbium and yttrium remain about half their pre-restriction levels.
Prices tell the same story. Germanium metal in Europe rose from 3,150 to 5,380 dollars per kilogram between January and October 2025, a rise of 70.8 percent, while China’s germanium exports in the first nine months of 2025 were 79.5 percent below the same period of 2023. The average unit value of US gallium imports rose 32.1 percent in 2025, to 580 dollars per kilogram. In 2026 the IEA puts European prices of gallium and heavy rare earths at about five times Chinese domestic prices, and germanium at about three times. A two-tier market has formed: one price inside China, another outside.
2.3 Not only China
Other producers now use similar tools. The Democratic Republic of the Congo, which mined 74.2 percent of the world’s cobalt in 2025, replaced its export suspension with quotas from 16 October 2025: 96,600 tonnes for 2026, including a strategic quota of 9,600 tonnes. That is 58 percent less than the 230,000 tonnes the country mined in 2025. Indonesia set its 2026 nickel ore quota at 250 to 260 million tonnes, against 379 million tonnes in 2025, a cut of 31 to 34 percent. Zimbabwe, 9.7 percent of world lithium mine output in 2025, suspended lithium concentrate exports in February 2026. For buyers in the five economies, “de-risking from China” is necessary but no longer sufficient.
A first look at the results
The full note goes much further, with original models, scenarios and a dashboard of leading indicators. Two of its 14 charts and diagrams are shown below.
Continue reading
Get the full note: 27 pages, 14 charts and diagrams, 9 tables
This page shows the first part of the note. The full PDF adds: five responses, five toolkits; where the chokepoints are; the Exposure Index: who is exposed, to what; supply and requirements to 2030; the cost of a disruption; time to independence; four scenarios to 2030; leading indicators dashboard; implications for policy, investors and industry.
29 USD, instant PDF download, secure card payment.
Buy the full noteNeed this analysis for your organisation?
We prepare confidential briefings, executive talks and studies on countries, markets and policies, built on the same method as this article.
Request a briefingSupport independent analysis
Our studies are free to read and carry no advertising. If this one was useful, a small contribution helps us publish the next.
Support our workGo further: books by Global Strategy Files

Frequently asked questions
Which Western economy is most exposed to critical mineral supply shocks?
On an index combining import reliance, supplier concentration, China’s refining share, substitutability and stockpiles, the United Kingdom is the most exposed of five economies in 2026, at 48.9 out of 100, ahead of France and Germany at 40.1, the United States at 26.7 and Canada at 22.3. Germany is the most exposed economically, because vehicles, electronics, electrical equipment and aerospace equal about 6.8 percent of its GDP.
What are China’s export controls on critical minerals in 2026?
China requires licences for gallium, germanium, graphite, antimony, tungsten and seven heavy rare earths, and bans gallium, germanium and antimony exports to the United States. A wider October 2025 package, adding five rare earths, battery materials and a rule covering foreign goods with 0.1 percent Chinese rare earth content, was suspended to 10 November 2026, and the US-China truce now runs to 10 January 2027.
Will there be a shortage of critical minerals by 2030?
On the author’s model anchored on IEA requirements, copper supply falls about 16 percent short of primary requirements in 2030 and cobalt about 22 percent short, partly because of the Congo’s export quota. Lithium is roughly balanced until 2030, then tips into deficit. For graphite and rare earths, global gaps are smaller but supply outside China grows slowly, so access rather than quantity is the main risk.
How long will it take the West to reduce dependence on Chinese mineral refining?
Using the IEA’s projected pace of dilution, China’s refining share falls below the EU’s 65 percent cap around 2030 for lithium, but only around 2048 for rare earths, 2054 for graphite and 2058 for cobalt. Doubling the pace brings rare earths to about 2036 and graphite to about 2040. Only 10 to 24 percent of each country’s current exposure is resolved by 2030.
Sources
- International Energy Agency, “Global Critical Minerals Outlook 2026” (executive summary, outlook chapter and report, revised July 2026), iea.org, retrieved 24 October 2026.
- International Energy Agency, “Global Critical Minerals Outlook 2025”, data pages for lithium, nickel, cobalt, copper, graphite and rare earth elements (Stated Policies Scenario tables), iea.org, retrieved 24 October 2026.
- International Energy Agency, “With new export controls on critical minerals, supply concentration risks become reality”, commentary, 23 October 2025.
- International Energy Agency, policy database: “DRC ARECOMS Decision No. 004/2025, Cobalt Quota System”.
- BOFIT (Bank of Finland Institute for Emerging Economies), Weekly Review 32/2026, 7 August 2026 (China’s mining and refining shares from the IEA 2026 Outlook).
- US Geological Survey, “Mineral Commodity Summaries 2026” (lithium, nickel, cobalt, graphite, copper, rare earths, gallium, germanium chapters), February 2026.
- E&E News, “US increasingly dependent on importing critical minerals”, 9 February 2026.
- MOFCOM announcements Nos. 46 (2024), 10, 18, 55 to 58, 61, 62, 70 and 72 (2025) and No. 1 (2026), as compiled by Rare Earth Directory, “China export controls: timeline and the Nov 10, 2026 deadline”, retrieved 24 October 2026.
- RAWMATERIALS.net, “Rare Earth Export Controls: China Confirms Extension of Trade Arrangements With U.S.”, 28 September 2026.
- FXStreet, “China’s rare earth leverage has an expiration date: November 10”, 14 October 2026.
- Bloomsbury Intelligence and Security Institute, “China’s Rare Earth Processing Dominance and What the Trump-Xi Summit Didn’t Change”, 30 September 2026.
- WUNC News, “Chinese leader Xi Jinping arrives in U.S. for first state visit in 11 years”, 24 September 2026.
- South China Morning Post, “China’s magnet exports to US slammed in May as Beijing’s rare earth curbs hit”, 20 June 2025; “China’s rare earth magnet exports to US keep falling, Europe gains”, 20 March 2026.
- SMM (Shanghai Metals Market), “China’s Rare Earth Magnet Exports Hit Record in September”, 20 October 2026.
- Bloomberg, “Ford CEO Says Rare Earth Supply Is ‘Day to Day’ After Plant Halt”, 13 June 2025.
- MP Materials, Form 8-K exhibit 99.1, “Transformational public-private partnership with the Department of Defense”, 10 July 2025.
- Covington and Burling, “Trump Administration Announces Results of Critical Minerals Investigation Under Section 232”, January 2026 (Proclamation 11001 of 15 January 2026).
- E&E News, “Trump’s mineral stockpile takes shape”, 26 February 2026 (Project Vault).
- FGS Global and Veracity Worldwide, “Can FORGE turn allied minerals policy into bankable supply chains?”, 24 September 2026.
- Atlantic Council, “US critical minerals policy goes collaborative with FORGE”, February 2026.
- Quartz, “U.S. and E.U. sign critical minerals partnership deal”, 24 April 2026.
- The OAG, “U.S. Government Equity Stakes Tracker”, updated 24 October 2026 (cross-checked against company and agency announcements).
- Fastmarkets, “EU’s critical minerals strategy: 3 billion euro boost amid industry risks”, 12 December 2025 (RESourceEU).
- European Commission, “Questions and answers on the Critical Raw Materials strategic projects”, 9 October 2026.
- European Court of Auditors, special report on critical raw materials, 2 February 2026, as reported by Eunews, 3 February 2026.
- CEPS, “Reducing supply risks for critical raw materials”, In-Depth Analysis 2024-01 (EU import reliance from the European Commission Study on the Critical Raw Materials for the EU 2023).
- Vinson and Elkins, “UK Critical Minerals Strategy: Vision 2035”, November 2025.
- Direction generale des entreprises, “La France engage la reconquete de la souverainete industrielle sur les terres rares et les aimants permanents”, 6 May 2026.
- Federal Ministry for Economic Affairs and Energy and KfW, joint press release on the Deutschlandfonds and the raw materials fund, 15 July 2026.
- Deutscher Bundestag, hib 670/2026, government answer 21/7684 on critical raw material reserves, 27 August 2026.
- Natural Resources Canada, “Canada unlocks 26 new investments and partnerships with 9 allied countries to secure critical minerals supply chains”, 31 October 2025; “Government of Canada invests to unlock Canada’s critical minerals advantage”, 3 March 2026.
- CIM Magazine, “Budget 2025 invests billions in mining”, November 2025.
- Mining Weekly, “Carney sends three new critical minerals projects to Major Projects Office”, 14 November 2025.
- IDN Financials, “Indonesia cuts 2026 nickel quota, global prices jump immediately”, 19 January 2026.
- S&P Global, “United States Ranks Next to Last in Development Time for New Mines”, 18 July 2024; “Average lead time almost 18 years for mines started in 2020-23”.
- Eurostat, “Employment and value added using FIGARO data: automotive industry” (2024 data), extracted July 2026.
- Office for National Statistics, GVA weights series L4O5, L4O6, L4O8 and KZU5 (2025).
- Innovation, Science and Economic Development Canada, Question Period Note “Canada’s auto sector: impacts of U.S. tariffs”, May 2025.
- US Bureau of Economic Analysis, Summary make and use tables 2023 (2017 schema), as distributed in the USEPA useeior package.
- IMF, World Economic Outlook, October 2026 (NGDPD), via DataMapper, retrieved 20 October 2026.
- World Bank, World Development Indicators (NV.IND.MANF.ZS), retrieved 23 October 2026; Trading Economics for Canada’s 2021 value.
- Federal Reserve Bank of St. Louis, FRED, series DCOILBRENTEU (Brent, monthly averages), retrieved 20 October 2026.
- European Central Bank, euro foreign exchange reference rates, 2025 annual averages.
Books from Global Strategy Files
Go further on this topic


