
The Dollar as a War Asset: How the 2026 Shock Travelled Through Currencies

Driss EFFINA, PhD Independent Researcher, Global Strategy Files Decoded, analysis note No. 15, 24 October 2026. Reading time: about 55 minutes
Key takeaways
- The Fed’s broad dollar index rose 3.0 percent between 27 February and 16 October 2026, after an 8.5 percent fall in the previous thirteen months. The dollar rose on 80 percent of the biggest oil-up days, and its daily correlation with oil turned positive for the first time this century.
- Oil and wider rate differentials explain most of the dollar’s rise. The euro’s 5.1 percent fall is 1.9 points oil, 0.6 point rates and 2.5 points unexplained, consistent with Europe’s gas shock; the Canadian dollar’s fall is mostly the rate gap, with no oil support.
- The classic havens failed: the Swiss franc fell 6.8 percent, the yen 1.2 percent despite 11.7 trillion yen of intervention, and gold 19.3 percent, priced off rising real yields and the dollar. Fed swap lines never exceeded 378 million dollars: there was no dollar funding stress.
- Weaker currencies add about 0.27 point to euro area inflation and 0.17 point to Canada’s within a year. In the author’s scenarios the broad dollar ends 2027 near 121, between 116 if a US-specific shock breaks its premium and 128 in an escalation.
Abstract
The war involving Iran that began with US and Israeli strikes on 28 February 2026 and closed the Strait of Hormuz for most of the following eight months was, among other things, a currency event. Between the close of 27 February and 16 October the Federal Reserve’s nominal broad dollar index rose 3.0 percent, reversing part of an 8.5 percent fall over the previous thirteen months. The euro lost 5.0 percent against the dollar, the Canadian dollar 3.7 percent, the yen 1.2 percent and sterling 0.9 percent. The two assets that investors usually buy in a war did worse than any of them: the Swiss franc lost 6.8 percent and gold 19.3 percent. This note asks why the shock travelled through currencies in this way, and what it costs. It builds a daily replica of the Fed’s broad index from official bilateral rates and 2026 trade weights, runs an event study around eleven dated events, decomposes each currency’s move into rate differentials, oil and risk with a weekly factor model, estimates “war betas” on daily data back to 2000, tests which asset behaved as a safe haven in eight stress episodes, checks the dollar funding market, measures the inflation cost of weaker currencies in the euro area, the United Kingdom and Canada, and projects four scenarios to the end of 2027. The answer is that in 2026 the dollar behaved less like a safe haven than like a war asset: a claim on the economy that sells oil and gas rather than buys them, and whose central bank was the most willing to raise rates.
Keywords: US dollar, exchange rates, oil shock, safe haven, gold, Swiss franc, yen, terms of trade, dollar funding, exchange-rate pass-through, Strait of Hormuz
JEL codes: F31, F32, E44, E52, Q43, G15
Key findings
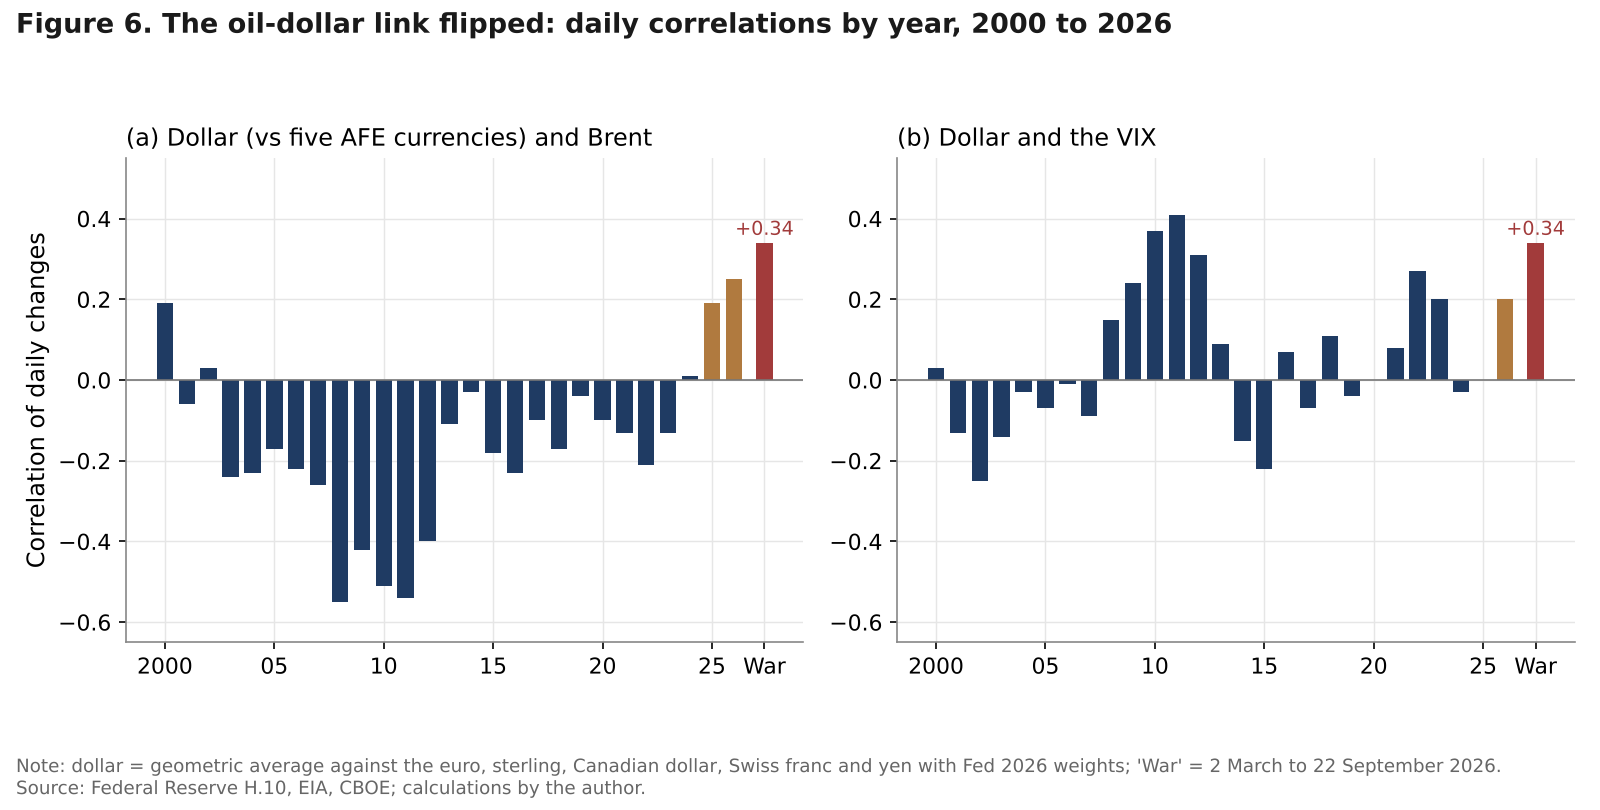
1. The dollar was the war’s winning currency, and it won on oil days. The broad dollar index rose 3.0 percent from 27 February to 16 October 2026 (to 121.40 in the Fed’s official series), 4.1 percent against advanced economies. It rose on 80 percent of the 20 days with the largest rises in Brent. The daily correlation between oil and the dollar was negative in every year from 2001 to 2023; during the war it was +0.34.
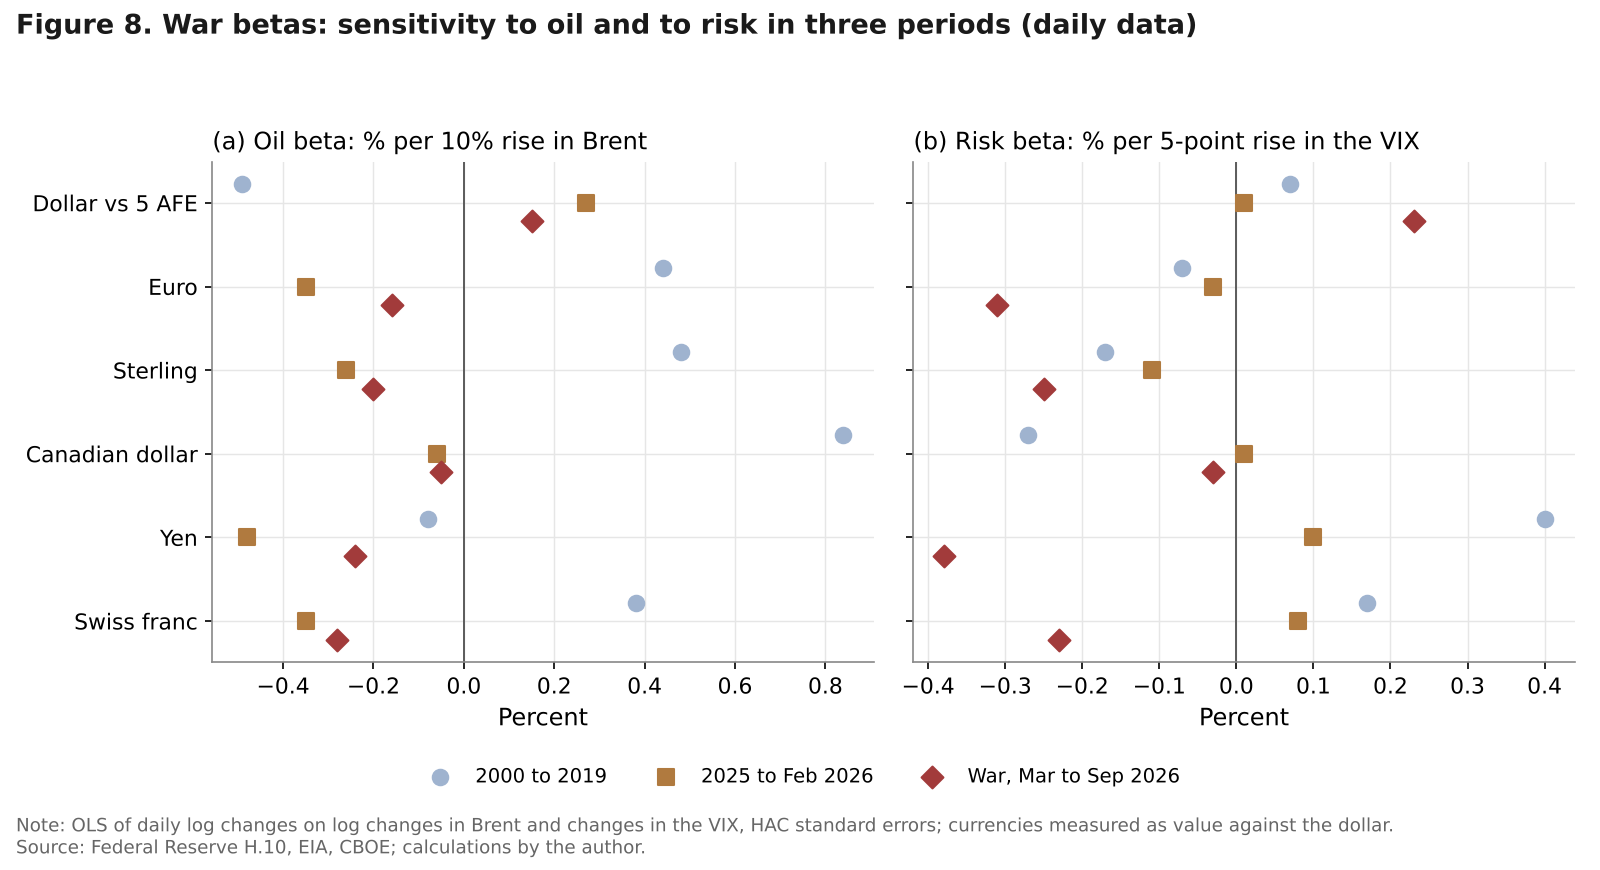
2. Oil and rates explain the dollar’s rise; something else explains the euro’s and the franc’s falls. A weekly factor model attributes 1.2 points of the dollar’s 3.0 percent rise to oil, 0.9 point to wider rate differentials and 0.1 point to risk. The euro’s 5.1 percent fall is 1.9 points oil, 0.6 point rates and 2.5 points unexplained, consistent with Europe’s separate gas shock. The Canadian dollar’s 3.8 percent fall is mostly rates (2.3 points): oil, which lifted it by 0.84 percent per 10 percent rise in Brent in 2000 to 2019, gave it no support in 2026.
3. The classic havens failed; the dollar took their role. On daily data from 2000 to 2019 a 5-point rise in the VIX lifted the yen by 0.40 percent and the franc by 0.17 percent; during the war the same shock lowered them by 0.38 and 0.23 percent and raised the dollar by 0.23 percent. Japan spent 11.7 trillion yen defending 160 yen per dollar and the Bank of Japan raised rates, yet the yen still ended weaker.
4. Gold was priced off real yields and the dollar, not off fear. Gold peaked at 5,539 dollars an ounce on 29 January, a month before the war, and fell to 4,010 on 23 October, 27.6 percent lower. The 0.88-point rise in the US 10-year real yield explains 5.5 points of the fall and the stronger dollar 5.1 points. During the war gold’s sensitivity to credit risk turned from +1.0 to -5.4 percent per point of high-yield spread.
5. There was no scramble for dollars. Fed central bank liquidity swaps never exceeded 378 million dollars during the war, less than 0.1 percent of their May 2020 peak of 449 billion, and the euro’s cross-currency basis barely moved. The dollar rose on fundamentals and rate expectations, not on a funding squeeze.
6. Weaker currencies add a modest but real surcharge to inflation; the scenarios keep the dollar high. The euro’s fall adds about 0.27 point to euro area inflation within a year, the Canadian dollar’s about 0.17 point and sterling’s less than 0.1 point. In the author’s scenarios the probability-weighted broad dollar is 121.3 at the end of 2027, with a range from 116.0 if a US-specific shock breaks its war premium (15 percent) to 127.7 in an escalation (20 percent), where EUR/USD falls to 1.06.
1. Introduction: a war priced in dollars
Wars used to weaken the currency of the country that fought them and strengthen those of neutral, solvent countries with a current-account surplus; Switzerland, Japan and gold owe their reputations to that pattern. The dollar rises in global crises for another reason: the world borrows in dollars and needs them when credit dries up. In 2025, that reputation took a blow. After the US tariff announcements of April 2025, the dollar fell while equities fell, the opposite of what a haven does, and the broad dollar index lost 8.5 percent between January 2025 and February 2026.
The war involving Iran that began on 28 February 2026 was a new test, with the United States a direct participant. The Strait of Hormuz, which normally carries about a fifth of the world’s oil and liquefied gas, was closed or contested for most of the next eight months; Brent rose from 71 dollars on 27 February to 138 dollars on 7 April, fell to 69 dollars after the June reopening deal and was back at 119 dollars on 16 October. If wars weaken participants’ currencies, the dollar should have fallen; if 2025 ended its haven status, the franc, the yen and gold should have taken the role.
Neither happened. The dollar rose against every major currency, and the franc and gold were among the worst performers. Figure 1 sets out the four channels through which the war could reach exchange rates and the result through 16 October.
The central argument of this note is that the dollar behaved in 2026 as a war asset: a currency whose value rises with the price of the commodity the war disrupts and with the interest rates the resulting inflation brings. Three facts explain this. The United States is a net exporter of petroleum and natural gas (EIA data for 2025, as compiled in Foresight No. 8), so higher energy prices improve its terms of trade and worsen those of the euro area, Japan, Switzerland and the United Kingdom. The Fed was the large central bank most willing to raise rates. And there was no dollar funding shortage, so the textbook crisis mechanism was never needed.
Section 2 sets the scene and builds a daily replica of the Fed’s broad dollar index (Box 1). Section 3 is an event study, Section 4 documents the new sign of the oil-dollar link, Section 5 decomposes each currency’s move (Box 2), Section 6 estimates war betas and Section 7 asks which asset behaved as a haven. Sections 8 to 10 cover dollar funding, the inflation cost of weaker currencies (Box 3) and scenarios to the end of 2027 (Box 4). The Canadian dollar’s fundamentals and pass-through were analysed in Decoded No. 8, “The Bank of Canada’s Silent Trap”; this note uses its pass-through estimate and does not repeat it.
2. The setting: from a falling dollar to a war bid
2.1 What happened to currencies
The dollar entered 2026 weak. The Fed’s monthly broad index fell from 128.84 in January 2025 to 117.91 in February 2026, a decline of 8.5 percent, and the euro rose 14.4 percent against the dollar during 2025 while sterling rose 8.7 percent and the Swiss franc 15.0 percent (USD/CHF fell 13.0 percent). Gold was the asset of 2025: its monthly average rose 62.7 percent between December 2024 and December 2025, and it reached a record close of 5,539 dollars on 29 January 2026.
The war reversed the currency trend but not at once and not evenly. Table 1 gives levels on 27 February, the last trading day before the strikes, and on 16 October, the latest day in the Federal Reserve’s H.10 data used here, together with extremes during the war.
Table 1. Currencies, gold and oil before the war and on 16 October 2026. Value change = change in the value of the currency against the US dollar (for the dollar index: the dollar against its partners). Sources: Federal Reserve H.10 (daily noon buying rates; official broad index 121.40 on 16 October), EIA (Brent), currency-api snapshots (gold); calculations by the author.
| Series | 27 Feb 2026 | 16 Oct 2026 | Value change, % | War extreme (date) |
|---|---|---|---|---|
| Broad dollar index (Jan 2006 = 100) | 117.81 | 121.39 | +3.0 | high 121.98 (14 Oct) |
| Dollar vs advanced economies (AFE) | 110.16 | 114.67 | +4.1 | high 115.75 (14 Oct) |
| EUR/USD | 1.1822 | 1.1231 | -5.0 | low 1.1123 (14 Oct) |
| GBP/USD | 1.3455 | 1.3330 | -0.9 | low 1.3154 (14 Oct) |
| USD/CAD | 1.3632 | 1.4157 | -3.7 | high 1.4273 (14 Oct) |
| USD/CHF | 0.7686 | 0.8243 | -6.8 | high 0.8385 (14 Oct) |
| USD/JPY | 156.05 | 158.00 | -1.2 | high 163.86 (29 Jul) |
| Gold, USD per ounce | 5,184 | 4,183 | -19.3 | low 3,971 (30 Jun) |
| Brent, USD per barrel | 71.32 | 119.33 | +67.3 | high 138.21 (7 Apr) |
Three features stand out. First, the dollar’s gains were concentrated against advanced economies: against emerging-market currencies the replica rose only 2.0 percent, and the official monthly emerging-market index was slightly lower in September (127.43) than in February (127.68). The Korean won rose 7.9 percent and the yuan 2.6 percent, while the Mexican peso fell 6.9 percent and the Swedish krona 9.1 percent. Second, the yen held up only because Japan intervened and the Bank of Japan raised rates. Third, gold and the franc, the traditional war hedges, were the two weakest assets in the table (Figure 2).
2.2 Policy: one hike in Washington, two in Frankfurt, none in London or Ottawa
Central banks reacted to the oil shock in very different ways, and those differences matter for exchange rates through expected rate differentials (Table 2).
Table 2. Policy rates and decisions, February to October 2026. Sources: Federal Reserve FOMC statement of 16 September 2026; ECB decisions of 11 June and 10 September 2026 (Banco de Espana; Newsquawk); Bank of England, Monetary Policy Summary of 17 September 2026 (MTS Insights); Bank of Canada announcements (Decoded No. 8); Bank of Japan, decision of 18 September 2026 (TrendForce, Trading Economics); Swiss National Bank, assessment of 24 September 2026 (DailyForex). Retrieved 24 October 2026.
| Central bank | End-Feb 2026 | 24 Oct 2026 | 2026 decisions | Next decision |
|---|---|---|---|---|
| Federal Reserve | 3.50 to 3.75 | 3.75 to 4.00 | Hike of 25 bp on 16 Sep, first in three years | 27 to 28 Oct |
| ECB (deposit rate) | 2.00 | 2.50 | Hikes on 11 Jun and 10 Sep | 29 Oct |
| Bank of England | 3.75 | 3.75 | Hold; 6 to 3 vote on 17 Sep, three for 4.00 | 5 Nov |
| Bank of Canada | 2.25 | 2.25 | Holds all year, latest 2 Sep | 28 Oct |
| Bank of Japan | 1.00 | 1.25 | Hike on 18 Sep (7 to 2 vote) | 30 Oct |
| Swiss National Bank | 0.00 | 0.00 | Hold on 24 Sep; intervention language softened | n.a. |
The table understates what the market expected from the Fed. Between 27 February and 16 October the US 2-year yield rose 139 basis points, to 4.77 percent, against 106 for the German 2-year, 82 for the Canadian 2-year and 120 for the UK 5-year, so the US-German 2-year spread widened from 1.36 to 1.69 points although the ECB hiked twice and the Fed once. The US 10-year real yield rose 106 basis points, to 2.78 percent, while breakeven inflation rose only 10. The market read the war as a reason for higher US real rates, not as an inflation scare.
Box 1. A daily replica of the Fed’s broad dollar index
Only the monthly averages of the Fed’s broad dollar index and its latest daily value (121.40 on 16 October 2026) could be retrieved for this note. The index is a geometric average of the dollar’s value against 26 currencies with annually updated trade weights. The replica uses the Fed’s 2026 total trade weights (euro area 21.0 percent, Mexico 14.8, Canada 12.8, China 10.9, United Kingdom 5.2, Japan 5.2 and so on), the H.10 daily noon buying rates for the 17 currencies the H.10 release covers, and daily or weekly snapshots of market rates for the other nine (Argentina, Chile, Colombia, Indonesia, Israel, the Philippines, Russia, Saudi Arabia and Vietnam, together 7.1 percent of the weights). Scaled once to the official monthly averages, the replica fits them closely: over January 2025 to September 2026 the correlation of monthly changes is 1.00 and the root mean square gap in levels 0.01 percent, and on 16 October it stands at 121.39 against the official 121.40. The same method reproduces the AFE and EME sub-indices. The replica is used for daily windows and weekly regressions.
A first look at the results
The full note goes much further, with original models, scenarios and a dashboard of leading indicators. Two of its 14 charts and diagrams are shown below.
Continue reading
Get the full note: 27 pages, 14 charts and diagrams, 9 tables
This page shows the first part of the note. The full PDF adds: event study: what each war date did to currencies; a new sign: oil and the dollar move together; decomposing the moves: rates, oil and risk; war betas: the sensitivities that changed; safe haven or not? Dollar, franc, yen and gold; dollar funding: the stress that did not come; the inflation cost of weaker currencies; scenarios to end-2027; leading-indicators dashboard.
29 USD, instant PDF download, secure card payment.
Buy the full noteNeed this analysis for your organisation?
We prepare confidential briefings, executive talks and studies on countries, markets and policies, built on the same method as this article.
Request a briefingSupport independent analysis
Our studies are free to read and carry no advertising. If this one was useful, a small contribution helps us publish the next.
Support our workGo further: books by Global Strategy Files

Frequently asked questions
Why did the dollar rise during the 2026 Iran war?
The broad dollar index rose 3.0 percent between 27 February and 16 October 2026. A weekly factor model attributes 1.2 points to oil, because the United States is now a net exporter of petroleum and gas while Europe, Japan and Switzerland import them, and 0.9 point to wider rate differentials after the US 2-year yield rose 139 basis points and the Fed hiked on 16 September. Risk explains 0.1 point.
Was the US dollar still a safe haven in 2026?
In the 2026 war, yes, but as a war asset more than a funding haven. During the war a 5-point rise in the VIX raised the dollar by 0.23 percent and lowered the yen by 0.38 percent and the franc by 0.23 percent, reversing their pre-2020 behaviour. Fed swap line usage stayed below 378 million dollars, so the rise reflected fundamentals and rates, not a scramble for dollars.
Why did gold fall during the war involving Iran?
Gold peaked at 5,539 dollars an ounce on 29 January 2026, a month before the war, and fell to 4,010 dollars on 23 October. A weekly model attributes 5.5 points of the fall since late January to the 0.88-point rise in the US 10-year real yield and 5.1 points to the stronger dollar. During the war gold fell when credit spreads widened, the opposite of a haven.
How much do weaker currencies add to inflation in Europe, the UK and Canada?
Between February and October 2026 Brent rose 79 percent in dollars but 89 percent in euros. The euro’s fall adds about 0.27 point to euro area inflation within a year, 0.13 point through oil and 0.14 point through other imports. The Canadian dollar’s fall adds about 0.17 point. Sterling fell little against a basket of major currencies, so the UK surcharge is under 0.1 point.
Sources
- Board of Governors of the Federal Reserve System, H.10 Foreign Exchange Rates: daily noon buying rates; “Summary Measures of the Foreign Exchange Value of the Dollar” (nominal broad, AFE and EME indices, monthly, January 2025 to September 2026; last update 19 October 2026); “Total Trade Weights” (2026). Retrieved 24 October 2026.
- Federal Reserve Bank of St. Louis, FRED: DTWEXBGS (Nominal Broad U.S. Dollar Index, 121.40 on 16 October 2026, as reported by FRED-based data services), SWPT (Central Bank Liquidity Swaps, Wednesday level), DGS2, DGS10, DFII10, T10YIE, BAMLH0A0HYM2, DCOILBRENTEU, CPIAUCSL, FEDFUNDS, ECBDFR. Retrieved 20 to 24 October 2026.
- DataHub datasets “exchange-rates” (H.10 mirror), “gold-prices”, “finance-vix” (CBOE) and “oil-prices” (EIA); currency-api (fawazahmed0) snapshots via the npm registry, March 2024 to 23 October 2026. Retrieved 24 October 2026.
- Federal Reserve, FOMC statement of 16 September 2026; minutes of the meeting of 28 and 29 April 2026, as reported by Reuters (“US Fed officials propose prolonging dollar swap lines to underpin stability”, 21 May 2026).
- European Central Bank, monetary policy decisions of 11 June and 10 September 2026 (as reported by Banco de Espana and Newsquawk); ECB Data Portal: deposit facility rate. ECB, “Exchange rate pass-through in the euro area and EU countries”, Economic Bulletin, Issue 3/2020, and Ortega, E. and Osbat, C. (2020), Occasional Paper No. 241.
- Bank of England, Monetary Policy Summary of 17 September 2026 (MTS Insights summary); Forbes, K. (2015), “Much ado about something important: how do exchange rate movements affect inflation?”, speech; Forbes, K., Hjortsoe, I. and Nenova, T. (2015), “The shocks matter”, External MPC Unit Discussion Paper No. 43.
- Office for National Statistics: CPI annual rate (D7G7) and core CPI (DKO8); Consumer price inflation, UK: September 2026 (21 October 2026), as reported by Forex Fundamentals.
- Bank of Canada, Valet API: V39079, STATIC_TOTALCPICHANGE, V41693242; Statistics Canada consumer price index. Retrieved 20 October 2026.
- Eurostat, HICP (prc_hicp_minr): euro area all items and excluding energy and food. Retrieved 20 October 2026.
- Bank of Japan, policy decision of 18 September 2026 (as reported by TrendForce and Trading Economics) and decision of July 2026; Bank of Japan meeting calendar (as published by FinanceCalendar).
- Japan Ministry of Finance, foreign exchange intervention data released 29 May 2026 (as reported by the New Straits Times, “Japan spent US$73bil in yen interventions”).
- Swiss National Bank, monetary policy assessment of 24 September 2026 (as reported by DailyForex, “SNB holds rates at zero, inflation outlook rises”).
- Reuters (S. I. Ahmed), “Dollar funding stress eases as Middle East conflict de-escalation hopes rise”, 5 March 2026 (via ARY News); Bloomberg, “Global Risks Renew Dollar Demand in the Currency Swaps Market”, 3 March 2026; Bloomberg, “Demand for dollars in currency swaps ebbs alongside global risks”, 10 April 2026 (via The Edge Malaysia).
- Treasury & Risk / Bloomberg, “Bessent Says Gulf, Asian Allies Requested Currency Swap Lines”, 22 April 2026.
- Wikipedia, “2026 Strait of Hormuz crisis” (timeline of events, retrieved 24 October 2026); World Oil, “Iran reopens Strait of Hormuz during ceasefire, oil prices plunge”, 17 April 2026; XTB, “Morning wrap: Strait of Hormuz finally set to open”, 15 June 2026.
- Finance Magnates, “From record highs to sharp falls and the road back to 5000 gold”, June 2026 (gold record of 29 January 2026).
- Global Strategy Files, Decoded No. 1 “Five Bond Markets, One Shock”; Decoded No. 8 “The Bank of Canada’s Silent Trap”; Decoded No. 13 “Tariffs plus Oil”; Foresight No. 6 “The End of Cheap Duration”; Foresight No. 8 “After Hormuz: the energy mix of 2030” (EIA net petroleum and gas trade for 2025; European and US gas prices in 2026).
Books from Global Strategy Files
Go further on this topic
 Future-Proofing AmericaEconomic challenges and the road to reform.20 USD, see the bookThe Tariff GambleHow America’s trade war is reshaping power, prices and prosperity.24.99 USD, see the book
 Kill KennedyWhat the 2025 declassified files reveal about the machinery of American power.20 USD, see the book
