
Stocks versus Bonds: The Vanishing Equity Risk Premium in 2026

Driss EFFINA, PhD Independent Researcher, Global Strategy Files Decoded, analysis note No. 19, 24 October 2026. Reading time: about 55 minutes
Key takeaways
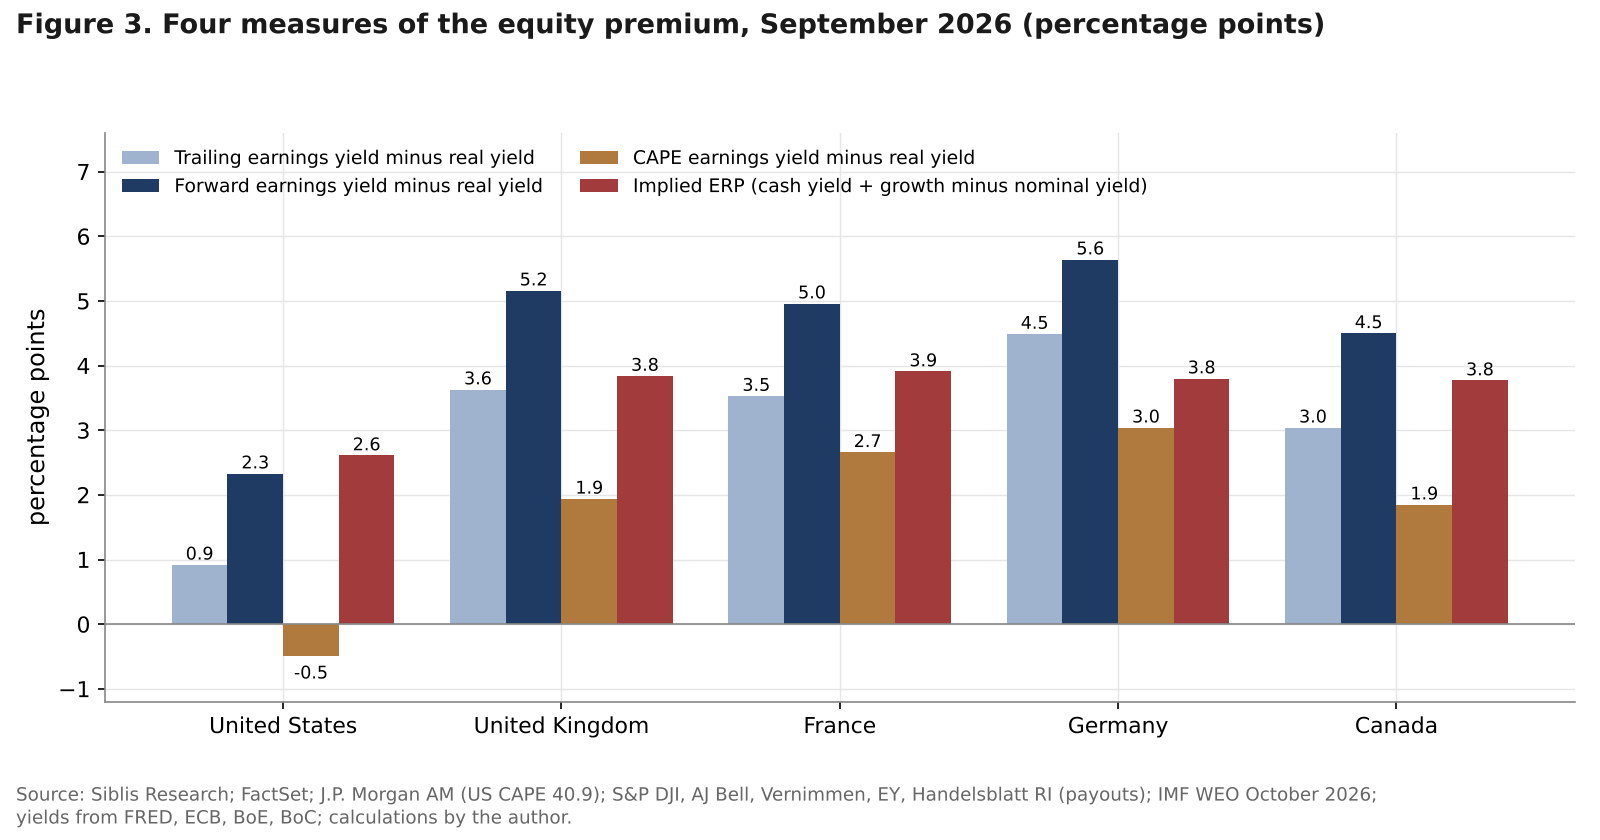
- In September 2026 the S&P 500’s forward earnings yield exceeded the real 10-year yield by 2.33 points, against 4.50 to 5.64 points in the UK, France, Germany and Canada. On trailing earnings the US gap is 0.92 points, lower only in 1999 to 2001; on CAPE it is negative.
- In 2026 forward earnings yields rose 0.84 to 1.09 times as much as real yields: multiples fell 8 to 14 percent, but earnings rose 10 to 29 percent, so equities beat 10-year bonds by 4.2 to 16.1 points up to September.
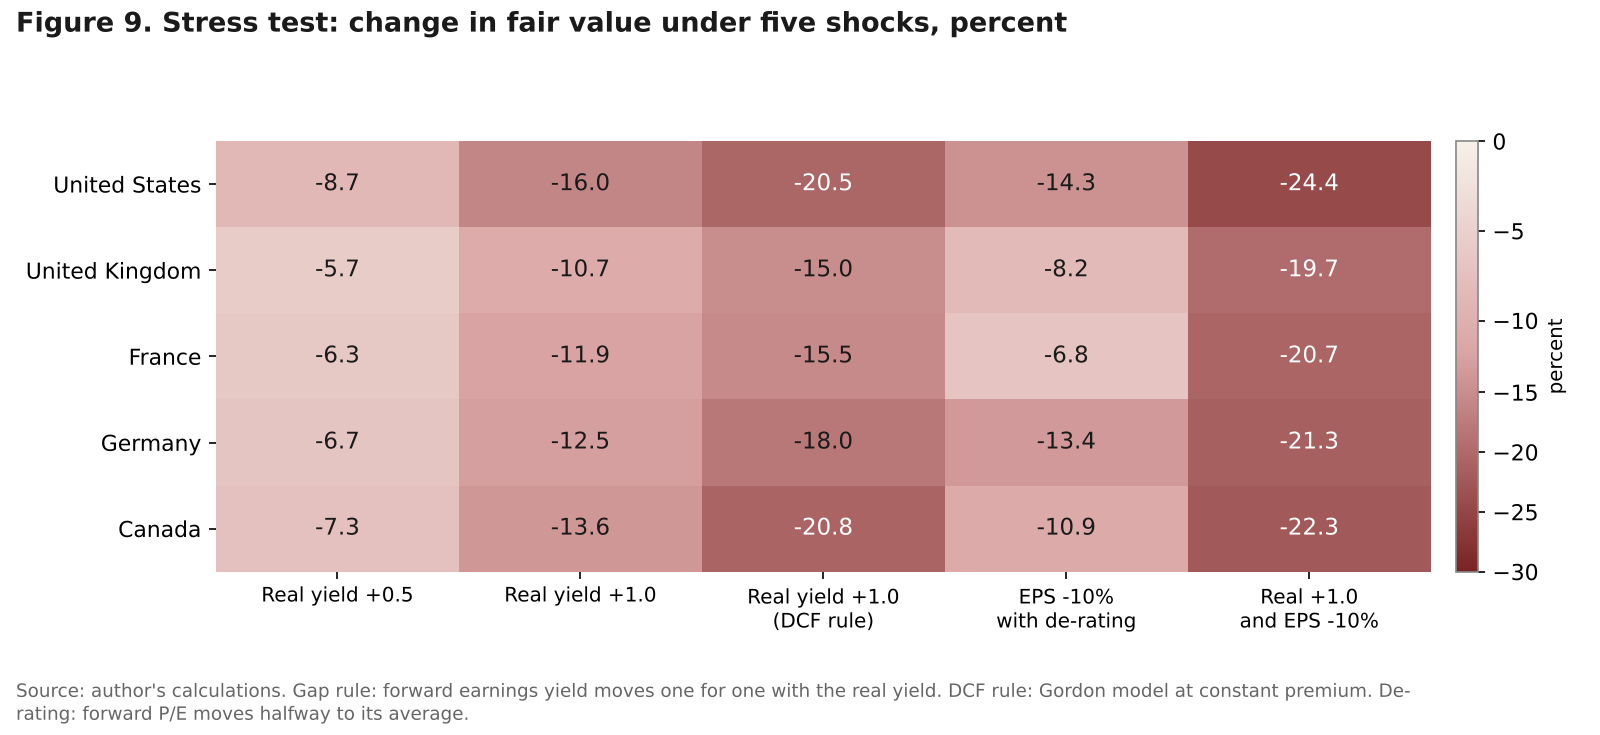
- A 1-point rise in real yields would cut fair value by 11 to 21 percent, and with a 10 percent earnings miss by 20 to 24 percent. The ten largest US companies hold 41 percent of the S&P 500 and 37 percent of its forward earnings.
- In the author’s scenarios to end-2027 the probability-weighted return is 1.7 percent for the S&P 500 against 6.3 percent for 10-year Treasuries, while European and Canadian equities roughly match their bonds. This note is not investment advice.
Abstract
For fifteen years, owning shares instead of government bonds paid a large and visible premium. In September 2026 the ten-year US Treasury yielded about 5 percent, the inflation-protected yield was close to 3 percent, and the S&P 500 traded on 26 times trailing earnings. A trailing earnings yield of 3.85 percent now exceeds the real bond yield by less than 1 point. Outside the United States multiples are lower, but real yields in the United Kingdom and France have risen past 2.5 percent, and premiums are thinner there too.
This note measures the equity risk premium in five markets (S&P 500, FTSE 100, CAC 40, DAX and S&P/TSX) in four ways: the gap between forward, trailing and cyclically adjusted earnings yields and the real ten-year yield, and an implied premium from a Gordon growth model that counts dividends and buybacks. It places each measure in its history since 2000 for the United States and since 2016 for all five markets. It then breaks 2026 returns into earnings growth, multiple change and dividends, runs stress tests of a 1-point rise in real yields and a 10 percent earnings miss, measures the AI concentration of the US index, and builds four scenarios to end-2027 with probabilities and 20,000 simulated paths. All projections are the author’s. This note is not investment advice.
Keywords: equity risk premium, earnings yield, real interest rates, Fed model, Gordon growth model, valuation, market concentration, artificial intelligence, stock-bond correlation, financial stability, S&P 500, FTSE 100, CAC 40, DAX, S&P/TSX
JEL codes: G12, G11, G17, E43, E44
Key findings
1. The premium has almost vanished in America and narrowed everywhere else. In September 2026 the S&P 500’s forward earnings yield exceeded the real ten-year yield by 2.33 points, against 4.50 to 5.64 points in the four other markets. On trailing earnings the US gap is 0.92 points, lower only at the year-ends of 1999, 2000 and 2001; on cyclically adjusted earnings it is negative (-0.49 points), at the 5th percentile of monthly readings since 2000, a level last seen in December 2000. In the United Kingdom, France, Germany and Canada the CAPE-based gap is the lowest of eleven readings since 2016. 2. 2026 has been a year of earnings, not of multiples. From December 2025 to September 2026 real yields rose by 0.49 to 0.88 points, and forward earnings yields rose by 0.84 to 1.09 times as much: forward price-earnings ratios fell by 8 to 14 percent while the gap barely moved. Forward earnings rose by 10 to 29 percent, so equities still beat ten-year government bonds by 4.2 (France) to 16.1 points (United States) up to the end of September. 3. Today’s prices are a bet on growth. A Gordon model that counts buybacks gives an implied premium of 2.6 points for the S&P 500 and 3.8 to 3.9 points elsewhere, against Aswath Damodaran’s 4.23 for the S&P 500, a figure built on high near-term growth. To earn the 4.8-point average premium of 2000 to 2025, US payouts would have to grow by 5.9 percent a year forever, 2.2 points above the IMF’s trend nominal GDP growth; in Europe and Canada the excess is about 1 point. 4. The US market has the longest duration and the most concentrated earnings risk. A 1-point rise in real yields would cut fair value by 11 to 16 percent if earnings yields follow real yields, and by 15 to 21 percent in a discounted cash-flow model; with a 10 percent earnings miss the loss reaches 20 to 24 percent. The ten largest US companies carry 41 percent of market value and 37 percent of forward earnings, on a multiple (20.9) equal to their own average. An AI de-rating that cuts their earnings by 15 percent and takes their multiple to that of the rest would lower the index by 11 to 17 percent. 5. To end-2027, bonds offer a better risk-adjusted return than US equities. Across four scenarios (earnings carry the market 30 percent, high plateau 35 percent, AI de-rating 20 percent, real-yield and oil shock 15 percent), the probability-weighted total return to end-2027 is 1.7 percent for the S&P 500 against 6.3 percent for ten-year Treasuries, and 4.7 to 5.9 percent for European and Canadian equities, roughly equal to their bonds. With a positive stock-bond correlation since 2021 (+0.32 against -0.34 in 2000 to 2020), bonds also hedge less than investors are used to.
1. Introduction: the return of the alternative
For most of the decade before 2022, the comparison between stocks and bonds was not close. A ten-year German Bund yielded nothing, a Treasury less than 2 percent, and inflation-protected bonds paid negative real returns. Equities, priced at 15 to 20 times earnings, offered earnings yields of 5 to 7 percent. Investors called this “TINA”: there is no alternative.
In 2026 there is one. The war involving Iran that began at the end of February closed the Strait of Hormuz, took Brent from 71 dollars a barrel in February (monthly average) to 114 in September and about 127 in October, and pushed long-term yields up across the advanced economies. The ten-year US Treasury averaged 4.99 percent in September and closed at 5.30 percent on 30 September, its highest level since May 2002. The ten-year inflation-protected Treasury rose from 1.72 percent on 27 February to 2.78 percent on 15 October. The gilt yields more than 5 percent, the French OAT more than 4.4 percent.
Equity markets did not fall. The S&P 500 gained 11.9 percent between 31 December 2025 and 16 October 2026, the S&P/TSX 14.1 percent, the FTSE 100 9.7 percent and the DAX 4.6 percent; only the CAC 40 lost ground (-2.4 percent). Earnings did the work. FactSet’s consensus on 16 October 2026 put S&P 500 earnings growth at 32.8 percent for 2026 and 16.0 percent for 2027; LSEG data put expected 2026 earnings growth for the STOXX 600 at 20.2 percent.
The question of this note is simple: how much extra return are investors now paid to hold equities instead of government bonds, and is it enough? The answer matters for asset allocation, for pension funds and insurers that set return assumptions, and for financial stability, since the central banks of the United States, the euro area, the United Kingdom and Canada all flagged stretched equity valuations in their 2026 reports.
The note proceeds in nine steps. Section 2 sets out the framework and the four measures (Box 1). Section 3 gives the September 2026 snapshot. Section 4 places it in history. Section 5 decomposes 2026 returns. Section 6 asks what growth current prices assume. Section 7 runs the stress tests. Section 8 looks at AI concentration in the United States and Section 9 at the stock-bond correlation. Section 10 presents the scenarios, Section 11 the dashboard, and Sections 12 and 13 the implications and what to watch.
The bond side of the comparison draws on earlier notes. The decomposition of ten-year yields into expected real rates, expected inflation and a term premium is that of Foresight No. 6, “The End of Cheap Duration”, whose expected-inflation estimates are reused here; the Federal Reserve’s first rate increase of the cycle was analysed in Decoded No. 7. This note does not repeat that analysis: it takes yields as given and asks what they mean for equities.
2. Framework: what the equity premium is, and how to measure it
The equity risk premium is the extra return investors expect from shares over a safe asset. It cannot be observed; it must be inferred from prices and from assumptions about future cash flows. Two families of measures dominate practice.
The first compares an earnings yield (earnings divided by price, the inverse of the price-earnings ratio) with a bond yield. The version often called the “Fed model” compares the forward earnings yield with the nominal ten-year yield. That comparison mixes a real quantity with a nominal one: corporate earnings grow with inflation, while a nominal bond coupon does not. The economically consistent comparison is with the real yield. The Federal Reserve Board itself defines its equity premium in the Financial Stability Report as the forward earnings-to-price ratio minus the real ten-year Treasury yield. This note follows that definition and computes it on three earnings bases: forward (analysts’ next twelve months), trailing (last twelve months) and cyclically adjusted (ten-year average of real earnings, the CAPE of Robert Shiller).
The second family discounts expected cash flows. In the Gordon growth model, the price of the market equals next year’s cash flow to shareholders divided by the discount rate minus the long-run growth rate. Reversing the model, the expected return equals the cash flow yield plus growth, and the implied premium is that expected return minus the nominal ten-year yield. Aswath Damodaran of New York University publishes the best-known implied premium for the S&P 500, built on dividends plus buybacks and on analysts’ five-year growth forecasts.
Figure 1 sets out the mechanism. Four forces moved the two sides of the comparison in 2026. The oil shock and fiscal supply raised real yields, the war through the term premium as well as through policy rates. AI capital spending and energy profits raised earnings expectations. The premium is the gap between the two sides.
Box 1. Four measures of the equity premium
Real yields. The real ten-year yield is the September 2026 monthly average nominal yield (US Treasury, gilt, OAT, Bund and Government of Canada bond) minus ten-year expected inflation estimated in Foresight No. 6 from IMF projections for 2027 to 2031 and the 2 percent targets thereafter: 2.06 percent for the United States, 2.08 for the United Kingdom, 1.97 for France, 2.14 for Germany and 2.04 for Canada. The US result (2.93 percent) is close to the inflation-protected yield (2.78 percent on 15 October). For history, expected inflation is set at 2 percent.
Earnings yields. Forward and trailing price-earnings ratios and CAPE are month-end values from Siblis Research for the FTSE 100, CAC 40, DAX and Canadian large caps; for the S&P 500 the forward ratio is FactSet’s and J.P. Morgan’s (19.0 on 30 September), the trailing ratio is Siblis Research’s (25.96) and the CAPE is J.P. Morgan’s Shiller CAPE (40.9).
Measures (1) to (3): earnings-yield gaps. Gap = 100 / P/E minus the real ten-year yield, with forward, trailing and CAPE ratios.
Measure (4): implied premium. The cash yield is the trailing dividend yield (Siblis Research, June 2026) times one plus the ratio of buybacks to dividends: 1.53 in the United States (S&P Dow Jones Indices, twelve months to September 2025), 0.52 in the United Kingdom (AJ Bell, 2026 forecasts), 0.48 in France (La Lettre Vernimmen, 2025), 0.47 in Germany (EY and Handelsblatt Research Institute, 2026) and an assumed 0.40 in Canada. The payout ratio is the cash yield over the trailing earnings yield; next year’s cash flow is that payout ratio times the forward earnings yield. Long-run growth g is the IMF’s nominal GDP growth for 2031 (real growth plus inflation): 3.73 percent for the United States, 3.43 for the United Kingdom, 2.92 for France, 2.71 for Germany and 3.84 for Canada. Implied premium = cash flow yield + g – nominal ten-year yield.
Limits. Index compositions differ (the FTSE 100 is heavy in energy, mining and banks, the S&P/TSX in banks and resources, the S&P 500 in technology), so cross-country levels are comparable only in part; changes over time are more informative than levels. The Gordon model assumes growth starts at its long-run rate after the forward year and ignores the higher near-term growth analysts expect; Section 6 measures what that choice is worth.
A first look at the results
The full note goes much further, with original models, scenarios and a dashboard of leading indicators. Two of its 14 charts and diagrams are shown below.
Continue reading
Get the full note: 25 pages, 14 charts and diagrams, 12 tables
This page shows the first part of the note. The full PDF adds: the September 2026 snapshot; how thin is thin? The premium in history; 2026: a year of earnings, not of multiples; the growth bet: what current prices assume; stress tests: real yields and earnings; AI concentration in the United States; do bonds still hedge equities?; scenarios to end-2027; leading-indicators dashboard.
29 USD, instant PDF download, secure card payment.
Buy the full noteNeed this analysis for your organisation?
We prepare confidential briefings, executive talks and studies on countries, markets and policies, built on the same method as this article.
Request a briefingSupport independent analysis
Our studies are free to read and carry no advertising. If this one was useful, a small contribution helps us publish the next.
Support our workGo further: books by Global Strategy Files

Frequently asked questions
What is the equity risk premium in 2026?
It depends on the measure. In September 2026 the S&P 500’s forward earnings yield of 5.26 percent exceeded the real 10-year Treasury yield of 2.93 percent by 2.33 points, and Damodaran’s implied premium was 4.23 percent in August. A Gordon model that counts buybacks and assumes trend growth gives 2.6 points for the S&P 500 and 3.8 to 3.9 points for the FTSE 100, CAC 40, DAX and S&P/TSX.
Why has the equity risk premium fallen?
Mainly because bonds repriced. Real 10-year yields, negative in Europe and near zero in America for most of the 2010s, reached 1.3 to 3.2 percent in 2026 after the oil shock and the rise in term premiums. In 2026 equity multiples fell almost one for one with the rise in real yields, so the premium barely changed during the year; it was already thin at the end of 2025.
Are US stocks more exposed than European stocks?
Yes on most measures. The S&P 500 has the thinnest premium, the lowest cash yield and the longest implied duration, about 26 years. A 1-point rise in real yields would lower its fair value by 16 to 21 percent, against 11 to 18 percent for the FTSE 100, CAC 40 and DAX. Its ten largest companies also carry 37 percent of forward earnings, so an AI earnings disappointment could cut the index by 11 to 17 percent.
Should investors prefer bonds to stocks in 2026?
This note gives no personal advice. At the asset-class level, the author’s scenarios give a probability-weighted total return to end-2027 of 1.7 percent for the S&P 500 against 6.3 percent for 10-year Treasuries, and similar returns for European and Canadian equities and their bonds. Because the stock-bond correlation has turned positive, bonds also hedge less than in 2000 to 2020.
Sources
- Federal Reserve Bank of St. Louis, FRED: IRLTLT01USM156N, IRLTLT01GBM156N, IRLTLT01CAM156N, DGS10, DFII10, T10YIE, THREEFYTP10 (Kim-Wright term premium, Federal Reserve Board), BAMLH0A0HYM2, DCOILBRENTEU. Retrieved 20 October 2026.
- European Central Bank, Data Portal: long-term interest rates for convergence purposes (IRS), France and Germany. Retrieved 21 October 2026.
- Bank of England Database; Bank of Canada Valet API; Bundesbank zero-coupon yields. Retrieved 20 October 2026.
- International Monetary Fund, World Economic Outlook, October 2026 (DataMapper: NGDP_RPCH, PCPIPCH). Retrieved 20 October 2026.
- Damodaran, A., “Historical Implied Equity Risk Premiums” (histimpl), NYU Stern School of Business, updated January 2026. Retrieved 24 October 2026.
- Stocktwits, “S&P 500 held flat last month despite surging 10-Y Treasury yields: Wall Street’s dean of valuation says risk math hasn’t changed”, 3 August 2026.
- FactSet, Earnings Insight, 5 December 2025, 9 January 2026 and 16 October 2026.
- J.P. Morgan Asset Management, Guide to the Markets, U.S., data as of 30 September 2026.
- J.P. Morgan Asset Management, Canada equity market update, data as of 30 September 2026.
- Siblis Research, “P/E ratios by country”, “FTSE 100 CAPE, P/E and yield”, “France P/E ratio and yield”, “DAX P/E ratio and yield”, “Canada P/E and earnings”, “Dividend yields by country”, “Europe P/E ratio”, data to 30 September 2026. Retrieved 24 October 2026.
- Shiller, R. J., U.S. stock market data (via datahub.io, “S&P 500” dataset). Retrieved 24 October 2026.
- S&P Dow Jones Indices, “S&P 500 Q3 2025 buybacks post modest 6.2% gain to 249.0 billion”, press release, 18 December 2025.
- S&P Dow Jones Indices, Canada dashboard, December 2025.
- AJ Bell, Dividend Dashboard, Q3 2026.
- La Lettre Vernimmen, CAC 40 shareholder distributions in 2025, as reported by Le Media de l’Investisseur.
- EY, DAX dividend study 2026, as reported by Keystone-SDA, 5 April 2026; Handelsblatt Research Institute, DAX buybacks, as reported by dpa-AFX, 25 March 2026.
- LSEG I/B/E/S, STOXX 600 earnings estimates of 8 October 2026, as reported by Teleborsa, 9 October 2026.
- Reuters, “Wall Street ends year’s final session lower but posts big annual gains for 2025”, 31 December 2025; AJ Bell, “FTSE 100 closes red in final 2025 trading session”, 31 December 2025; BFM Bourse via Tradingsat, “Le CAC 40 a pris 10.42% en 2025”; onvista, DAX daily review, 30 December 2025.
- Invesse, “Recap actu du 16 octobre 2026”; BNN Bloomberg and The Canadian Press, S&P/TSX close, 16 October 2026; Investrade, market review, 30 September 2026; Tapeboard, market pulse, 15 October 2026.
- Board of Governors of the Federal Reserve System, Financial Stability Report, May 2026, section 1, “Asset Valuations”.
- European Central Bank, Financial Stability Review, May 2026 (27 May 2026).
- Bank of England, Financial Policy Committee Summary and Record, September 2026 (30 September 2026).
- Bank of Canada, Financial Stability Report 2026, “Financial markets” (May 2026).
- International Monetary Fund, Global Financial Stability Report, October 2026, as reported by Computing, 14 October 2026.
- Morningstar, “2026 is not 1999”, 21 October 2026.
- Wall Street Horizon, NVIDIA earnings calendar (third quarter of fiscal 2027, 17 November 2026).
- Global Strategy Files, Foresight No. 6, “The End of Cheap Duration”; Foresight No. 9, “The AI Dividend”; Decoded No. 7, “Fighting Oil or the Deficit? The Fed’s first hike”.
Books from Global Strategy Files
Go further on this topic
The Tariff GambleHow America’s trade war is reshaping power, prices and prosperity.24.99 USD, see the book Future-Proofing AmericaEconomic challenges and the road to reform.20 USD, see the book
 Kill KennedyWhat the 2025 declassified files reveal about the machinery of American power.20 USD, see the book
