China and the Economic Dividends of War: How Much Does China Really Gain from the Russia-Ukraine Conflict?

Driss EFFINA, PhD Independent Researcher, Global Strategy Files Decoded, analysis note No. 18, 25 October 2026. Reading time: about 40 minutes
Key takeaways
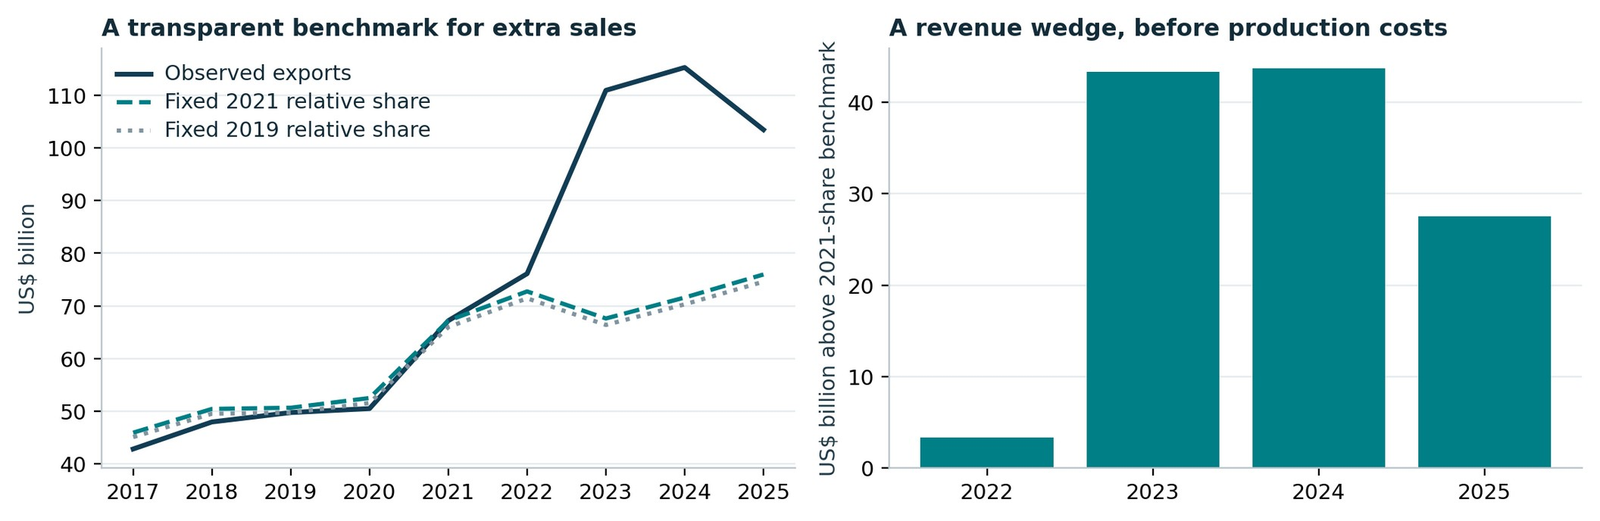
- Chinese exports to Russia beat a fixed-share benchmark by 117.9 billion dollars over 2022 to 2025, but revenue is not national profit.
- Russian crude gave China a signed purchase-cost advantage of 13.0 billion dollars over 2022 to 2025, 3.1 billion in 2025.
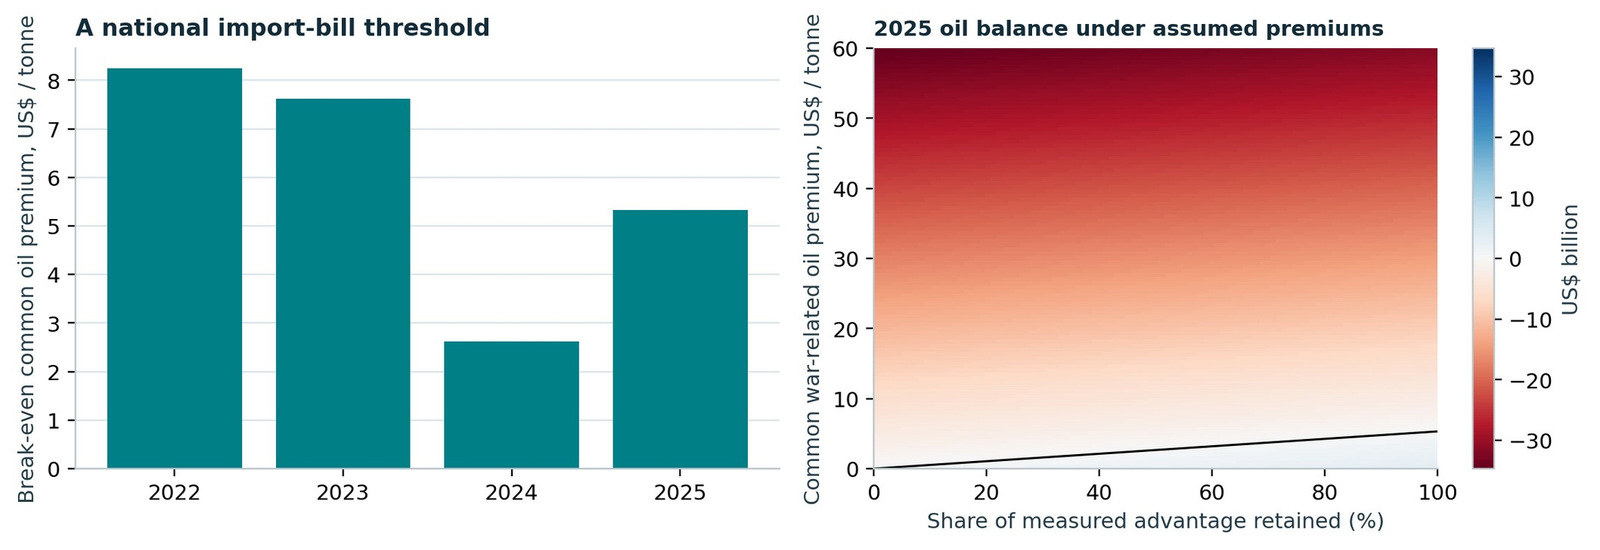
- A common war premium of only 5.3 dollars a tonne, about 1 percent, on all Chinese crude imports would erase the 2025 Russian advantage.
- China gains most from an asymmetry of options; in the regime model commercial normalisation beats prolonged fragmentation and escalation.
Abstract
Russia’s full-scale invasion of Ukraine changed the terms on which China buys resources, sells industrial goods and negotiates long contracts. The strategic question is how much of that change becomes additional Chinese income. A larger trade relationship is only the starting observation. The relevant dividend is the income China retains after paying for production, financing, risk and the wider price consequences of the conflict.
This study reconstructs Chinese merchandise trade from 2005 to 2025 and monthly crude oil transactions from 2019 to 2024, supplemented by annual 2025 data. It calculates a cumulative export revenue wedge of $117.9 billion for 2022 to 2025 relative to a transparent fixed-share benchmark. The corresponding crude purchase-cost comparison yields a signed cumulative advantage of $13.0 billion against other declared suppliers. Neither number is an estimate of the national profit caused by the war.
The national energy test is more demanding. In 2025, a common war-related oil premium of only $5.3 per tonne across China’s total crude imports would offset the measured Russian purchasing advantage, before financing and other costs. That threshold is calculated from observed trade records. The actual no-war price premium is unobserved and is not invented here.
The central argument is that China gains most from an asymmetry of options. Russia’s alternatives narrow while China can compare suppliers, negotiate delivery terms and build customer relationships in an underserved market. These benefits are uneven across sectors and can survive a reduction in hostilities through installed equipment, distribution and servicing. Their existence does not establish that prolonged war maximises Chinese welfare. The article combines an export decomposition, a monthly relative-price regression, Nash bargaining, a five-sector production network and a regime-switching valuation model. Charts distinguish observations from assumptions. The contribution is an original set of calculations and strategic deductions using public evidence, rather than a claim that the underlying economic methods are new. The accompanying research files make every numerical exhibit reproducible. [1]
Key findings
1. A large revenue wedge, not a profit. Chinese exports to Russia exceeded a fixed-share benchmark by a cumulative 117.9 billion dollars over 2022 to 2025, and by 27.5 billion dollars in 2025 alone, even though exports to Russia fell 10.3 percent in 2025 while total Chinese exports rose 5.6 percent. 2. A modest oil advantage. Russian crude landed in China at a signed cumulative advantage of 13.0 billion dollars over 2022 to 2025 against other declared suppliers (15.3 billion with a relative-price adjustment). In 2025 Russian crude cost 486.2 dollars a tonne against 516.7 for other origins, a 3.1 billion dollar advantage. 3. The national test is easy to fail. A common war-related premium of only 5.3 dollars a tonne, about 1 percent, on all Chinese crude imports would erase the 2025 Russian purchasing advantage. 4. A measurable but fragile price shift. Monthly data associate 2023 and 2024 with a 7.2 percent fall in Russia’s relative landed unit value (95 percent interval: 12.0 to 2.1 percent), sensitive to the comparator and to the trend specification. 5. Normalisation, not prolonged war, gives the best balance. In the illustrative regime model only commercial normalisation yields a positive annual balance (1.4 billion dollars), against -1.9 billion under continued fragmentation and -25.9 billion under escalation. China gains most from an asymmetry of options, not from the war itself.
1. Define the dividend before measuring it
Three comparisons answer different questions. A wartime purchasing comparison asks whether Russian supplies cost less than other available supplies in the same month. A commercial comparison asks whether Chinese exporters earn more than they could have earned elsewhere. A national counterfactual asks whether China is better off than it would have been without the escalation. Confusing these comparisons converts a visible opportunity into an unsupported welfare claim.
The accounting boundary matters. A discount on an imported input can increase Chinese real income through improved terms of trade. Export receipts contain wages, domestic inputs, imported components, taxes and profit. Only their incremental contribution after opportunity costs belongs in an economic dividend. A new factory order that displaces an equally profitable order elsewhere produces less additional income than an order that uses otherwise idle capacity.
The conceptual balance below assigns the Russian purchasing advantage to B, the common conflict-related energy premium to h, and total imported crude to Q. Additional export contribution is Π. F captures payment and financing frictions; L captures losses in other markets and trade routes; V denotes the value of future contractual and customer options. This is a framework for organising evidence, not an estimated national-accounts identity. Its components must be placed on the same time horizon before addition.
Throughout, “pre-escalation” refers to the period before February 2022. Russia’s war against Ukraine began in 2014, so the 2021 benchmark already incorporates earlier conflict, sanctions and commercial adaptation. The study measures changes around the full-scale invasion, not the entire economic history of the war. The diagram separates observable channels from the final counterfactual that remains to be established.
2. A larger relationship with a finite macroeconomic weight
Chinese merchandise trade with Russia rose from $146.8 billion in 2021 to $245.2 billion in 2024, then fell to $227.5 billion in 2025. China exported $103.5 billion and imported $124.0 billion in the final year. These are nominal customs values. Commodity inflation, quantities and product composition all contribute to their movement. [1]
Russia accounted for 2.0% of China’s merchandise exports in 2021 and 2.7% in 2025. Its share of Chinese imports increased from 3.0% to 4.8%. This combination reveals both an important bilateral expansion and a limited aggregate exposure. A commercially decisive market for a particular Chinese producer can remain a modest part of China’s overall trading system.
The longer series prevents a false starting point. Energy infrastructure, geographical proximity and industrial complementarity had supported the relationship well before 2022. The subsequent expansion therefore contains an inherited trend as well as a geopolitical shock. Attributing every dollar above the 2021 level to the invasion would also attribute ordinary growth in Chinese supply capacity and changes in world demand to the war. The reversal in 2025 is analytically useful. Chinese exports to Russia fell 10.3% while total Chinese merchandise exports increased 5.6%. Russia’s expansion was consequently neither a simple mirror of China’s export cycle nor a guaranteed source of ever-growing demand. Market concentration, Russian purchasing power, regulation and payment conditions need their own explanations.
The strategic implication is a portfolio rule: use Russian demand to deepen selected industrial capabilities, while valuing access to larger markets separately. A bilateral surplus or deficit is not the appropriate success metric. China can benefit from importing relatively cheap resources even while running a merchandise deficit with Russia. The relevant measures are purchasing power, retained income and the alternatives available to Chinese firms.
A first look at the results
The full note goes much further, with original models, scenarios and a dashboard of leading indicators. Two of its 15 charts and diagrams are shown below.
Continue reading
Get the full note: 21 pages, 15 charts and diagrams, 2 tables
This page shows the first part of the note. The full PDF adds: extract the exceptional export component; the industrial dividend is concentrated and reversible; revenue becomes income only after opportunity costs; measure the oil advantage at the Chinese border; a discount depends on the comparison basket; what the monthly econometrics can establish; the national oil test is a break even threshold; geography makes supplier choice economically valuable; Russia sells resources and China buys options.
29 USD, instant PDF download, secure card payment.
Buy the full noteNeed this analysis for your organisation?
We prepare confidential briefings, executive talks and studies on countries, markets and policies, built on the same method as this article.
Request a briefingSupport independent analysis
Our studies are free to read and carry no advertising. If this one was useful, a small contribution helps us publish the next.
Support our workGo further: books by Global Strategy Files

Frequently asked questions
Does China profit from the Russia-Ukraine war?
Not demonstrably. Chinese exports to Russia exceeded a fixed-share benchmark by 117.9 billion dollars over 2022 to 2025 and Russian crude came at a 13.0 billion dollar signed advantage, but these are revenue and purchase-cost comparisons. After margins, displaced sales, financing costs and the wider war premium on energy, the national balance can easily turn negative.
How cheap is Russian oil for China?
In 2025 Russian crude landed in China at 486.2 dollars a tonne against 516.7 dollars for other declared origins, a 3.1 billion dollar advantage. A monthly regression finds a 7.2 percent fall in Russia’s relative unit value in 2023 and 2024, but the result depends on the comparison basket and specification.
Why can a discount on Russian oil still leave China worse off?
Because the discount applies to Russian volumes only, while any war-related price premium applies to all Chinese crude imports. In 2025 a common premium of just 5.3 dollars a tonne, about 1 percent of the average import price, would cancel the entire Russian purchasing advantage.
Which Chinese sectors gained most from the Russian market?
Machinery and vehicles. Machinery exports to Russia rose from 14.7 billion dollars in 2021 to 26.6 billion in 2025 and vehicles from 4.3 billion to 13.1 billion, while electrical equipment barely moved. Passenger car gains proved cyclical: Russia’s share of Chinese car exports rose to 16.9 percent in 2024, then fell to 7.7 percent in 2025.
Sources
Primary customs data underpin the numerical exhibits; policy documents supply dated context; published research informs the modelling framework. All decompositions, regressions, sensitivity figures, maps and scenario calculations were produced for this study. The note estimates neither the human cost of the war nor a complete Chinese welfare counterfactual; the commercial mechanisms discussed are not a judgment about the desirability or legitimacy of the conflict.
- [1] United Nations Statistics Division, UN Comtrade API: annual and monthly China-reported trade, accessed 25 October 2026. https://uncomtrade.org/docs/un-comtrade-api/
- [2] United Nations Statistics Division, Trade valuation: import CIF and export FOB conventions. https://uncomtrade.org/docs/trade-valuation/
- [3] US Energy Information Administration, China crude oil imports decreased from a record as refiners processed less crude oil, 11 February 2025. https://www.eia.gov/todayinenergy/detail.php?id=64544
- [4] Council of the European Union, Russian oil: EU agrees on level of price cap, 3 December 2022. https://www.consilium.europa.eu/en/press/press-releases/2022/12/03/russian-oil-eu-agrees-on-level-of-price-cap/
- [5] US Department of the Treasury, Treasury intensifies sanctions against Russia by targeting Russia oil production and exports, 10 January 2025. https://home.treasury.gov/news/press-releases/jy2777
- [6] US Department of the Treasury, Treasury sanctions major Russian oil companies, 22 October 2025. https://home.treasury.gov/news/press-releases/sb0290
- [7] Gazprom, Power of Siberia: project chronology, 2014 contract, 2019 start of deliveries and contracted capacity. https://www.gazprom.com/projects/power-of-siberia/
- [8] Bank of Russia, Statement by Governor Elvira Nabiullina, 24 May 2024. https://www.cbr.ru/eng/press/event/?id=18723
- [9] SWIFT, RMB Tracker January 2026 (December 2025 payment shares). https://www.swift.com/swift-resource/252540/download
- [10] Simola, H., Russia’s ever increasing economic dependence on China, BOFIT Policy Brief 10/2025, Bank of Finland. https://publications.bof.fi/bitstreams/17062b89-3cd7-4ee2-96a8-338bce77c80e/download
- [11] Bank of Finland BOFIT, China-Russia trade in the first half of 2026, weekly monitoring, 7 August 2026. https://www.bofit.fi/en/monitoring/weekly/2026/vw202632_1/
- [12] Hakobyan, Meleshchuk and Zymek, Divided We Fall: Differential Exposure to Geopolitical Fragmentation in Trade, IMF Working Paper 2023/270. https://www.imf.org/en/publications/wp/issues/2023/12/22/divided-we-fall-differential-exposure-to-geopolitical-fragmentation-in-trade-542842
- [13] Alvarez and coauthors, Geoeconomic Fragmentation and Commodity Markets, IMF Working Paper 2023/201. https://www.imf.org/en/publications/wp/issues/2023/09/28/geoeconomic-fragmentation-and-commodity-markets-539614
- [14] Wachtmeister, Gars and Spiro, Quantity restrictions and price discounts on Russian oil, 2022. https://arxiv.org/abs/2212.00674
- [15] Natural Earth, Admin 0 countries, 1:110 million scale (public domain). https://www.naturalearthdata.com/about/terms-of-use/
- [16] National Bureau of Statistics of China, Energy Production in August 2023, 16 September 2023. https://www.stats.gov.cn/english/PressRelease/202309/t20230926_1943206.html
- [17] National Bureau of Statistics of China, Energy Production in September 2023, 19 October 2023. https://www.stats.gov.cn/english/PressRelease/202310/t20231026_1943930.html
- [18] National Bureau of Statistics of China, Energy Production in November 2023, 16 December 2023. https://www.stats.gov.cn/english/PressRelease/202312/t20231221_1945703.html
- [19] National Bureau of Statistics of China, Statistical Communique on the 2025 National Economic and Social Development, 28 February 2026, Table 12. https://www.stats.gov.cn/english/PressRelease/202602/t20260228_1962661.html
Books from Global Strategy Files
Go further on this topic