
The Execution Gap: France’s Strategic Governance Deficit and the Case for a President from Business

Driss EFFINA, PhD Independent Researcher, Global Strategy Files Foresight, prospective note No. 5, 23 October 2026. Reading time: about 60 minutes
Key takeaways
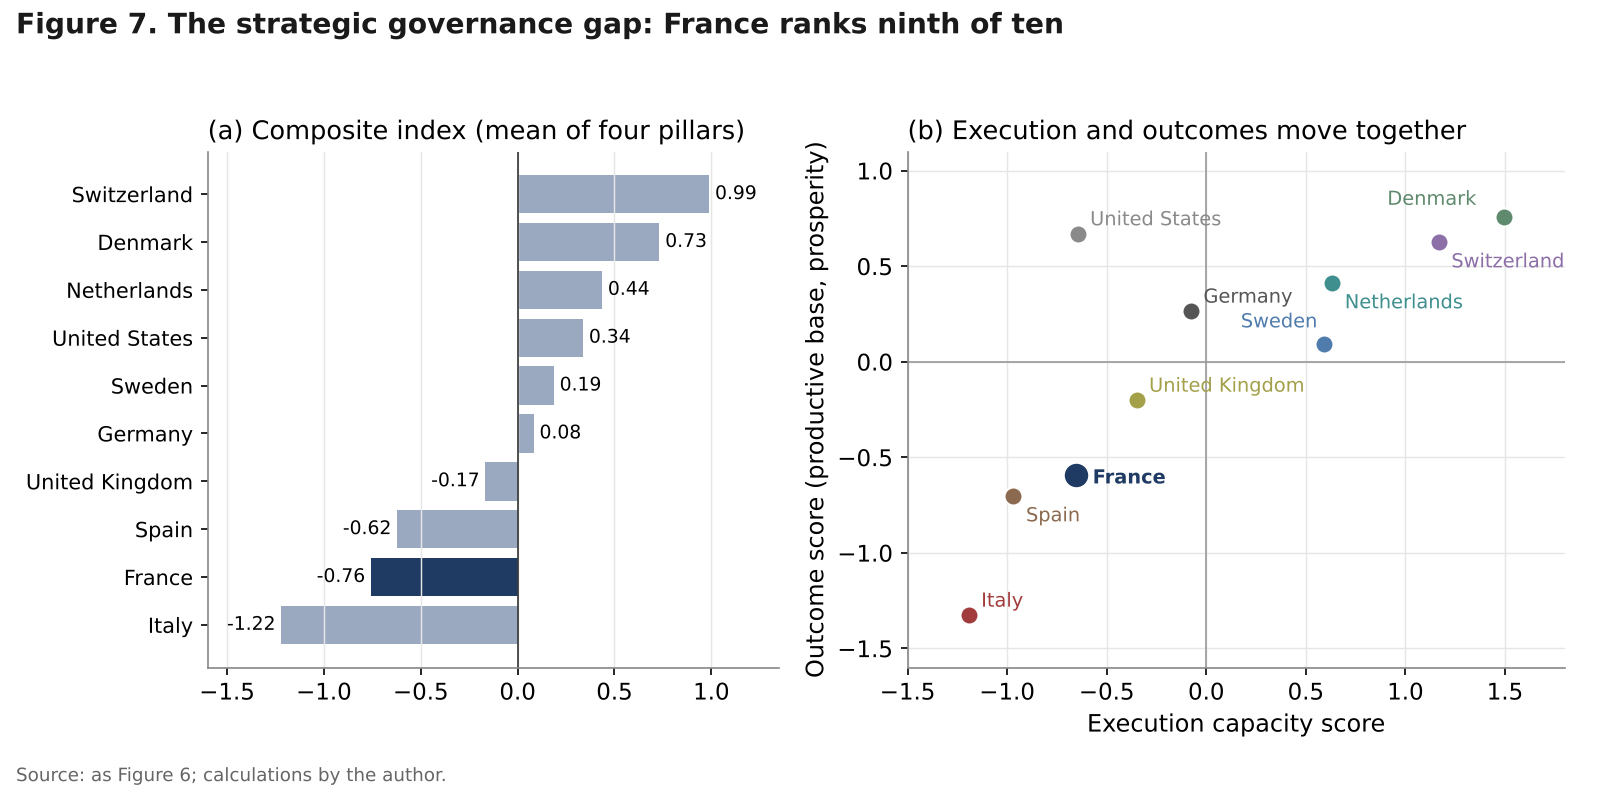
- France ranks ninth of ten advanced economies on an original strategic governance index of 16 indicators, 0.94 standard deviations below the peer median; it has the highest public spending (57.2 percent of GDP) and no primary surplus since 2005.
- Of 15 major commitments since 2017, all 4 market reforms were delivered and kept, but none of the 5 spending and entitlement reforms was delivered or sustained; the 2023 to 2027 fiscal plan was missed by a cumulated 7.5 points of GDP.
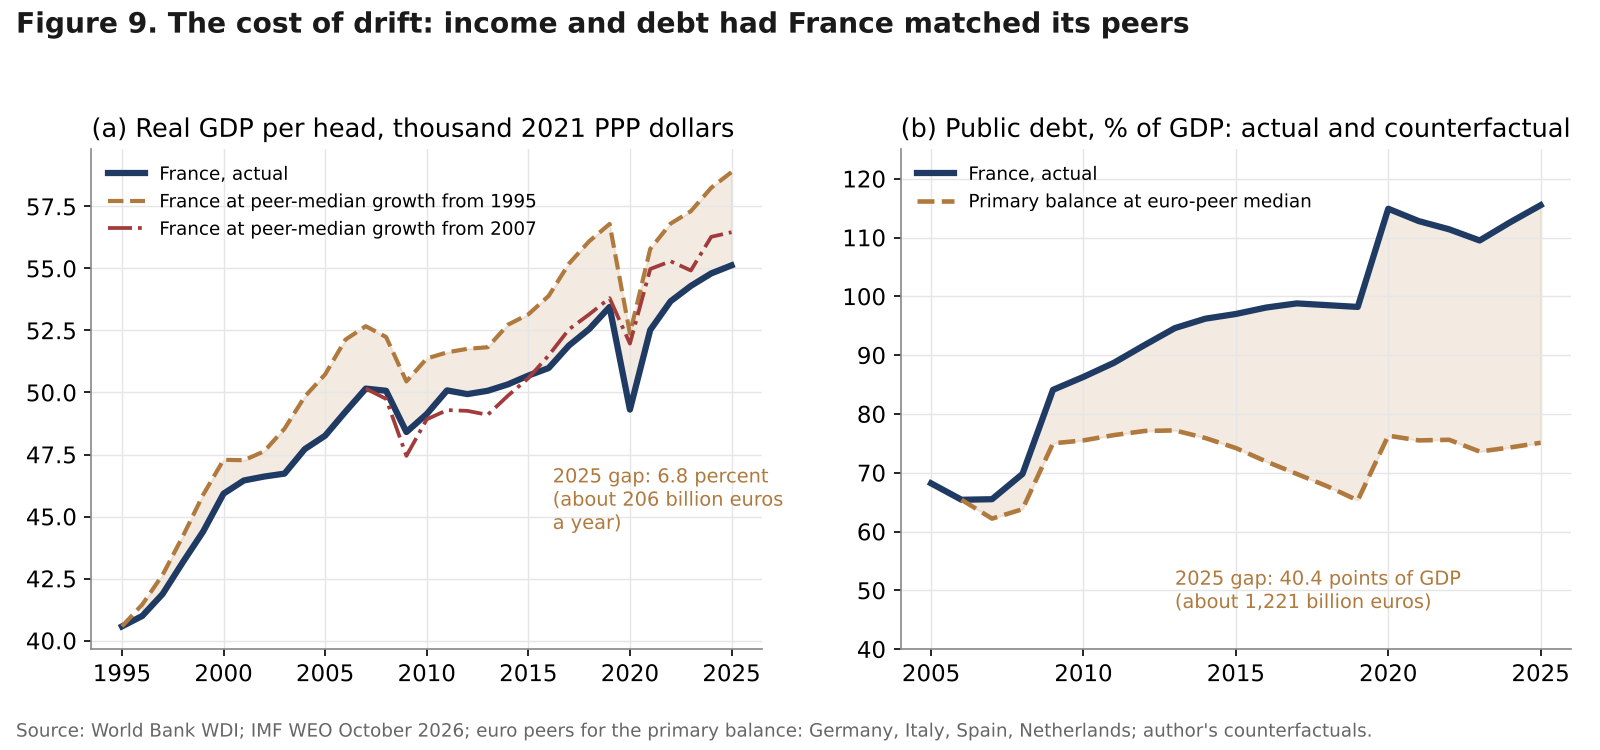
- Drift is costly: at peer-median growth since 1995, income per head would be 6.8 percent higher (about 206 billion euros a year), and at the euro-peer median primary balance since 2007, debt would be 40 points of GDP lower.
- In the author’s scenarios a business-built president with a working majority brings debt to 116 percent of GDP in 2032, against 134 percent under continued drift (60 percent probability); without a majority, the same profile does no better than drift.
Abstract
France does not lack diagnoses. It lacks execution. Since 2005 it has not run a single primary budget surplus, and the IMF does not project one before 2031. Public debt has risen by 50 points of GDP since 2007, public spending is the highest of ten advanced economies compared in this note (57.2 percent of GDP in 2025), manufacturing has fallen to 9.5 percent of GDP, research and development has been flat at about 2.2 percent of GDP for thirty years, and real income per head has drifted from 86 to 72 percent of the American level. Since May 2017 France has had seven prime ministers; since January 2024, four. Every budget law since 2023 has been adopted under Article 49.3 of the Constitution, and the pension reform of 2023 was suspended two years later.
This note argues that the binding constraint is strategic governance: the capacity to allocate scarce public resources, set a small number of priorities, execute them through a full cycle and be held accountable for results. It builds four original measures: a strategic governance gap index for France and nine peers, a promise-to-delivery ledger, a cost-of-drift counterfactual and a decomposition of the debt build-up. It then reviews the academic evidence on leaders’ professional backgrounds, confronts the strongest objections, and concludes that France would benefit from a president who has built or run large organisations and been accountable for results, provided strict guardrails apply. Four scenarios to 2032, anchored on the IMF’s October 2026 projections, quantify what is at stake. The note argues for a profile, not for any person.
Keywords: France, strategic governance, public finances, political leadership, business leaders, reform execution, 2027 presidential election, scenarios
JEL codes: H11, H62, O43, P16, D73
Key findings
1. France ranks ninth of ten on an original strategic governance index. Across 16 indicators of execution capacity, productive base, prosperity and work, and fiscal burden, France scores 0.94 standard deviations below the peer median and ranks above only Italy. The ranking is robust: it is eighth or ninth under every alternative weighting tested, including principal-component weights and the removal of the fiscal burden pillar. Execution and outcomes move together across countries (correlation 0.77). 2. The French state keeps the promises that cost nothing to the State, and breaks those that require it to change itself. Of 15 major commitments since 2017, all 4 market and institutional reforms were delivered and remain in force, 2 of 4 tax cuts survive intact, and none of the 5 spending and entitlement reforms was delivered or sustained. The 2023 to 2027 public finance plan was missed from its first year, by a cumulated 7.5 points of GDP to 2027 (about 227 billion euros). 3. Drift has a price. Had France grown at the peer-median rate since 1995, real GDP per head would be 6.8 percent higher today, worth about 206 billion euros a year, or roughly 3,000 euros per inhabitant. Had it run the median primary balance of Germany, Italy, Spain and the Netherlands since 2007, public debt would be about 40 points of GDP lower (some 1,200 billion euros), saving about 23 billion euros of interest in 2025 alone. 4. Primary deficits, not interest or recessions, built the debt. Of the 50-point rise in debt since 2007, cumulated primary deficits contributed 55 points; nominal growth subtracted 50 points and interest added 34. From 2025 to 2031 interest becomes the largest driver (18 points), so delay is now more expensive than at any time since 2008. 5. The evidence on leaders’ backgrounds supports the thesis, conditionally. Former entrepreneurs are more likely to implement reforms (72 countries), and business-background governors in the United States are associated with income growth 0.6 percentage points higher a year. But business experience outside finance has also been associated with higher deficits, and businesspeople in office can enrich their firms. The right profile and strong guardrails matter as much as the background. 6. A managed strategic reset is worth about 17 points of debt by 2032. In the author’s scenarios, a business-built president with a working majority stabilises debt by 2028 and brings it to 116 percent of GDP in 2032, against 134 percent under continued drift (probability 60 percent). The same president without a majority does no better than drift. A reset by a classic profile is possible but delivers less (121.5 percent).
1. Introduction
The French debate on public finances has become a debate on arithmetic: how many billions of savings, which tax, which rate. This note starts one level up. The question is not what France should do; the reports of the Cour des comptes, the High Council of Public Finances, the OECD and the IMF have said it many times. The question is why France does not do it, and what kind of leadership would change that.
The answer proposed here is that France suffers from a deficit of strategic governance. By strategic governance we mean four capacities: allocating scarce resources between competing uses on the basis of returns; choosing a small number of priorities and sequencing them; executing them through a full cycle, including the unpopular part; and being accountable, in public, for the results. These are the core competences of a chief executive who has run a large organisation. They are not the core competences that the French system has selected for in its leaders over the last five decades, which have rewarded mastery of the State’s legal and administrative machinery, party management and electoral skill.
This is a strong claim and it is made in a persuasive spirit, but it is tested against data and against objections. Section 2 sets out the diagnosis. Section 3 documents the collapse of governmental stability since 2024. Sections 4 to 6 build the original measures: a strategic governance gap index (Section 4), a promise-to-delivery ledger (Section 5) and the cost of drift (Section 6). Section 7 reviews who has governed France and what the research says about leaders’ backgrounds. Section 8 sets out what a business-built leader would change. Section 9 answers the strongest objections, including the mixed records of business leaders abroad and the fact that the current president worked as an investment banker. Section 10 sketches a 100-day and five-year programme, Section 11 presents scenarios to 2032, and Sections 12 to 14 give a dashboard, implications and a calendar.
Two limits should be stated at the outset. First, this note argues for a profile, not for a person; it does not name or endorse any candidate for the 2027 election. Second, correlation between leaders’ backgrounds and outcomes is not proof of causation, and the evidence reviewed is mixed in places. The argument is that, given France’s specific failure, the balance of evidence favours a particular profile, under conditions. Figure 1 maps the causal chain that the rest of the note quantifies. Foresight No. 4 analysed the French bond market and the risk of a debt crisis; this note does not repeat that analysis and asks instead what kind of leadership would make such a crisis less likely.
2. Forty years of drift: the diagnosis
2.1 Public finances: the highest spending, and no primary surplus
France has not voted a balanced budget since 1974. The Cour des comptes noted in November 2020 that fifteen French budgets since the creation of the euro had deficits above 3 percent of GDP. The IMF’s data are starker for the period that matters for debt dynamics: France has not run a primary surplus, that is a surplus before interest payments, in any year since 2005, and the October 2026 World Economic Outlook does not project one before 2031. Over the same years Germany ran primary surpluses in 12 years, Italy in 15 and the Netherlands in 9. Between 2005 and 2025 France kept its overall deficit at or below 3 percent of GDP in only 4 years, against 16 for Germany and the Netherlands and 10 for Italy.
The result is visible in Table 1 and Figure 2. In 2025 French general government expenditure reached 57.2 percent of GDP and revenue 52.1 percent, both the highest of the ten countries compared (Eurostat, April 2026). The tax-to-GDP ratio, 43.5 percent in 2024, is second only to Denmark’s 45.2 percent and 9.4 points above the OECD average of 34.1 percent. Debt reached 115.6 percent of GDP at the end of 2025, against a peer median of 63.5 percent; only Italy and the United States carry more.
The point is not that a large state is wrong in itself. Denmark and Sweden tax heavily and score well on most outcomes in this note. The point is that France combines the highest spending with a chronic primary deficit and middling results, so that each additional euro of public spending appears to buy less than elsewhere. Across the ten countries the correlation between the spending ratio and the outcome score built in Section 4 is negative (-0.54), a fact that does not prove that spending harms outcomes but does show that France’s spending level is not purchasing outcomes that peers fail to obtain.
Table 1. France against nine peers: the diagnosis in 17 indicators
| Indicator | France | Peer median | France rank (1 = best, of 10) | Best or reference |
|---|---|---|---|---|
| General government debt 2025, % of GDP | 115.6 | 63.5 | 8 | Denmark 27.9 |
| General government balance 2025, % of GDP | -5.1 | -2.4 | 8 | Denmark +2.9 |
| Expenditure 2025, % of GDP | 57.2 | 45.3 | 10 (highest) | Switzerland 32.6 |
| Revenue 2025, % of GDP | 52.1 | 43.3 | 10 (highest) | United States 30.5 |
| Tax-to-GDP 2024, % | 43.5 | 38.0 | 9 (second highest) | Denmark 45.2 (highest) |
| Manufacturing, % of GDP, 2025 | 9.5 | 12.5 | 9 | Switzerland 18.9 |
| Change in manufacturing share since 1995, points | -5.2 | -4.5 | 6 | Denmark +4.0 |
| R&D expenditure 2023, % of GDP | 2.18 | 3.05 | 8 | Sweden 3.60 |
| High-tech share of manufactured exports 2024, % | 23.1 | 18.0 | 5 | Switzerland 29.6 |
| Current account 2025, % of GDP | -0.3 | 4.5 | 8 | Denmark 12.6 |
| Real GDP per head growth 1995 to 2025, % a year | 1.03 | 1.25 | 8 | United States 1.64 |
| Real GDP per head growth 2007 to 2025, % a year | 0.53 | 0.66 | 7 | United States 1.27 |
| Labour force participation 2025, % of 15+ | 55.3 | 61.7 | 9 | Netherlands 67.2 |
| Youth unemployment 2025, % | 18.9 | 11.7 | 7 | Germany 6.9 |
| Growth per 10 points of GDP invested, 2010 to 2025 | 0.56 | 0.80 | 9 | United States 1.17 |
| WGI government effectiveness 2023 (-2.5 to 2.5) | 1.14 | 1.22 | 8 | Switzerland 2.13 |
| WGI regulatory quality, latest (-2.5 to 2.5) | 1.15 | 1.54 | 8 | Denmark 1.84 |
Sources: Eurostat (22 April 2026); IMF WEO October 2026 (United Kingdom, United States); IMF 2026 Article IV (Switzerland); OECD Revenue Statistics 2025; World Bank WDI and Worldwide Governance Indicators; calculations by the author. United States manufacturing is for 2021. Peers: Germany, Italy, Spain, Netherlands, Sweden, Denmark, Switzerland, United Kingdom, United States.
2.2 The productive base: less industry, flat research, weak returns on investment
Manufacturing value added fell from 14.7 percent of French GDP in 1995 to 9.5 percent in 2025 (Figure 3). Every economy in the group except Denmark and Switzerland deindustrialised in share terms, and the United Kingdom fell further, but France ended the period with the second-lowest share of the ten, against 17.6 percent in Germany and 15.0 percent in Italy. The external balance on goods and services, a surplus of 3.5 percent of GDP in 1997, has been negative in every one of the last 20 years. The current account, at -0.3 percent of GDP in 2025, is eighth of ten.
Research and development is the clearest case of strategic stagnation. French R&D spending was 2.23 percent of GDP in 1996 and 2.18 percent in 2023. Over the same period Germany went from 2.14 to 3.15 percent and the United States reached 3.45 percent. The European target of 3 percent of GDP, set in 2000 and endorsed by successive French governments, has not been approached.
France does not under-invest. Gross fixed capital formation averaged 21.9 percent of GDP between 2010 and 2025, the third-highest rate in the group after Switzerland and Sweden. What France lacks is the return: average real growth over the period was 1.23 percent a year, so that each 10 points of GDP invested were associated with 0.56 points of growth, ninth of ten (Figure 3, panel d). This is a crude ratio, influenced by housing and public investment, but it is consistent with the view that the problem is the allocation of capital, public and private, more than its quantity. France also keeps real strengths: its high-technology share of manufactured exports, 23.1 percent, ranks fifth and is above the peer median, reflecting aerospace, pharmaceuticals and defence.
2.3 Prosperity and work
Real GDP per head, measured at constant purchasing power, grew by 1.03 percent a year in France between 1995 and 2025, against a peer median of 1.25 percent (Figure 4). The difference looks small; compounded over thirty years it is large. French income per head fell from 85.9 percent of the American level in 1995 to 81.8 percent in 2007 and 71.7 percent in 2025. Against Germany it rose to 91.3 percent in 2007 and fell back to 87.7 percent. Since 2019 French real income per head has risen by 3.1 percent, against 5.2 percent for the median peer.
The labour market explains part of the gap. Only 55.3 percent of the French population aged 15 and over is in the labour force, ninth of ten and 6.4 points below the peer median, and youth unemployment is 18.9 percent. Sweden and Spain have higher youth unemployment, so France is not an outlier on that measure alone; it is the combination of low participation, high youth unemployment and the highest spending that is distinctive. A country that spends 57 percent of GDP through the State and leaves 45 percent of its adult population outside the labour force has a strategic allocation problem, not only a budget problem.
A first look at the results
The full note goes much further, with original models, scenarios and a dashboard of leading indicators. Two of its 15 charts and diagrams are shown below.
Continue reading
Get the full note: 29 pages, 15 charts and diagrams, 9 tables
This page shows the first part of the note. The full PDF adds: a crisis of execution: the political record since 2017; measuring the strategic governance gap; promise and delivery; the cost of drift; who governs France, and why the profile matters; what a business-built president would change; the strongest objections, answered; a 100-day and five-year programme sketch; scenarios to 2032.
29 USD, instant PDF download, secure card payment.
Buy the full noteNeed this analysis for your organisation?
We prepare confidential briefings, executive talks and studies on countries, markets and policies, built on the same method as this article.
Request a briefingSupport independent analysis
Our studies are free to read and carry no advertising. If this one was useful, a small contribution helps us publish the next.
Support our workGo further: books by Global Strategy Files

Frequently asked questions
What is France’s strategic governance deficit?
It is the gap between France’s resources and its results: the capacity to allocate public money by returns, set a few priorities, execute them and be accountable. On an index of 16 indicators France ranks ninth of ten advanced economies, ahead only of Italy. It spends 57.2 percent of GDP, the highest of the group, has run no primary surplus since 2005 and has seen debt rise 50 points of GDP since 2007.
Why should France’s next president come from business?
Because France fails specifically at management tasks: of 15 commitments since 2017, every market reform was delivered but none of the 5 spending and entitlement reforms was delivered or sustained. Research finds reforms more likely under former entrepreneurs and faster income growth under business-background US governors. The case is for a leader who has run large organisations for results, with strict conflict-of-interest guardrails and a parliamentary majority.
Was Emmanuel Macron not already a president from business?
Not in the sense argued here. Emmanuel Macron graduated from ENA, spent four years in the Inspection generale des finances and then about four years advising on transactions at Rothschild, becoming a partner in 2010. He never built or ran an organisation of thousands of people with profit-and-loss responsibility. His career is a variant of the classic senior civil servant profile, not the operating executive profile.
What happens to French debt by 2032 under the scenarios?
In the author’s projections, continued drift (60 percent probability) takes debt to about 134 percent of GDP in 2032. A managed reset under a business-built president with a majority stabilises debt in 2028 and brings it to 116 percent. A blocked business-built president reaches about 133 percent, and a reset by a classic profile about 121.5 percent. The probability-weighted path is 129 percent, above the IMF baseline of 124 percent.
Sources
All data retrieved on or before 23 October 2026.
- Acteurs publics, “L’executif abandonne la promesse de 120 000 suppressions de postes dans la fonction publique”, 3 June 2019.
- Banque des Territoires, “Francois Bayrou surmonte deux motions de censure”, 5 February 2025; Brut, reports on the 2025 and 2026 budgets and Article 49.3.
- Bruegel, “Argentina: plus ca change”, September 2019.
- CMS Francis Lefebvre, “La loi de financement de la securite sociale pour 2026 est promulguee” (law No. 2025-1403 of 30 December 2025).
- Council of Europe, European Commission for Democracy through Law (Venice Commission), Opinion on the compatibility of the laws “Gasparri” and “Frattini” of Italy with the Council of Europe standards in the field of freedom of expression and pluralism of the media, CDL-AD(2005)017, June 2005.
- Cour des comptes, report on the governance of public finances, November 2020, as reported by Weka, 19 November 2020; and assessment of the 2023 to 2027 programming law, as reported by Boursorama, 15 July 2024.
- Dreher, A., M. J. Lamla, S. M. Lein and F. Somogyi (2009), “The impact of political leaders’ profession and education on reforms”, Journal of Comparative Economics 37(1), 169 to 193.
- ECB Data Portal, long-term interest rate statistics (IRS), 10-year government bond yields, monthly, to September 2026.
- Eunews, “Czech Republic: Andrej Babis solves his conflict of interest”, 5 December 2025.
- Europe 1, reports on Article 49.3 uses by Elisabeth Borne, 16 March 2023, 16 December 2023 and 19 December 2023.
- Eurostat, news release on government deficit and debt for 2025, 22 April 2026.
- iFRAP, “Retour sur 50 ans de deficit public”.
- IMF, Switzerland: 2026 Article IV Consultation, Staff Report, Table 1.
- IMF, World Economic Outlook and Fiscal Monitor databases, October 2026 (series GGXWDG_NGDP, GGXCNL_NGDP, GGXONLB_G01_GDP_PT, G_X_G01_GDP_PT, GGR_G01_GDP_PT, NGDP_RPCH, PCPIPCH, LUR, BCA_NGDPD).
- ING Think, “France: 2025 budget finally pushed through, but the risk of slippage is high”, February 2025.
- INSEE, Informations rapides, general government debt at the end of the second quarter of 2026 (3,595.5 billion euros, 119.0 percent of GDP), second-quarter 2026 release.
- Jochimsen, B. and S. Thomasius (2012), “The perfect finance minister: whom to appoint as finance minister to balance the budget?”, DIW Berlin Discussion Paper 1188.
- Jones, B. F. and B. A. Olken (2005), “Do leaders matter? National leadership and growth since World War II”, Quarterly Journal of Economics 120(3), 835 to 864.
- Kirkland, P. A. (2021), “Business owners and executives as politicians: the effect on public policy”, Journal of Politics 83(4), 1652 to 1668.
- La Libre Belgique, “L’heure des comptes pour Emmanuel Macron : a-t-il respecte son programme de 2017 ?”, 19 March 2022 (ESJ Lille audit for Le Monde).
- LCP, “Le gouvernement de Michel Barnier censure au terme d’une journee historique a l’Assemblee nationale”, 4 December 2024; “Budget 2027 : le gouvernement sur un fil a la veille de l’ouverture des debats”, October 2026; report of 24 August 2026 on the 2027 budget.
- Le Monde du droit, “Presidentielle 2027 : calendrier electoral”, 3 July 2026.
- Lefebvre Dalloz, “CVAE : report de la suppression a 2030 et contribution complementaire pour 2025”.
- Legifiscal, “Prorogation de la contribution exceptionnelle sur les benefices des grandes entreprises commentee au BOFiP”, August 2026.
- Loi n° 2018-32 du 22 janvier 2018 de programmation des finances publiques pour les annees 2018 a 2022 (Articles 3 and 5).
- Macommune.info, “Le budget 2026 enfin adopte par le Parlement, trois 49.3 plus tard”, February 2026.
- Military History Wiki (Fandom), “Emmanuel Macron” (career dates), accessed October 2026.
- Moessinger, M.-D. (2014), “Do the personal characteristics of finance ministers affect changes in public debt?”, Public Choice 161(1), 183 to 207.
- Neumeier, F. (2016), “Do businessmen make good governors?”, ifo Working Paper 230.
- OECD, Revenue Statistics 2025, Table 3.1 (tax-to-GDP ratios, 2024 preliminary), and press release of December 2025.
- Political Wire, “Top ethics official calls Trump’s plan inadequate”, 11 January 2017.
- Public Senat, review of one year of the Lecornu government, 9 September 2026; “La prochaine election presidentielle aura lieu les 18 avril et 2 mai 2027”, 1 July 2026.
- Senat, finance committee, charts on successive public balance estimates 2023 to 2027, 4 September 2024.
- Szakonyi, D. (2018), “Businesspeople in elected office: identifying private benefits from firm-level returns”, American Political Science Review 112(2), 322 to 338.
- The Local France, reports of 8 September 2025 (Bayrou confidence vote) and 20 and 23 January 2026 (2026 budget); Adnkronos, 8 September 2025 (364 votes to 194).
- Thomson, R. and co-authors (2017), “The fulfillment of parties’ election pledges: a comparative study on the impact of power sharing”, American Journal of Political Science.
- United States Congress, Tax Cuts and Jobs Act of 2017 (Public Law 115-97).
- Wikipedia, “Lecornu governments” and “Borne government” (dates of appointment, resignation and censure motions), accessed October 2026.
- World Bank, World Development Indicators (series NV.IND.MANF.ZS, GB.XPD.RSDV.GD.ZS, NE.RSB.GNFS.ZS, BN.CAB.XOKA.GD.ZS, NY.GDP.PCAP.PP.KD, NE.GDI.FTOT.ZS, TX.VAL.TECH.MF.ZS, NY.GDP.MKTP.KD.ZG, SL.TLF.CACT.ZS, SL.UEM.1524.ZS, SP.POP.TOTL), accessed 23 October 2026.
- World Bank, Worldwide Governance Indicators, government effectiveness and regulatory quality estimates (via worldscorecard.com and tradingeconomics.com), accessed 23 October 2026.
- Yahoo News (The Telegraph), obituary “Sebastian Pinera, billionaire who introduced credit cards to Chile and served twice as president”, February 2024.
Books from Global Strategy Files
Go further on this topic


