China’s Footprint in Five Major European Economies: Germany Leads, the Rest Depends on the Measure

Driss EFFINA, PhD Independent Researcher, Global Strategy Files Decoded, analysis note No. 6, 23 October 2026. Reading time: about 60 minutes
Key takeaways
- Germany leads China’s two-way value-added footprint, at 6.22 against 4.11 to 4.97 for the four others, and stays first under every weighting of Chinese supply and Chinese demand.
- The United Kingdom ranks second overall but last for Chinese value added in its exports, at 1.50 percent of gross exports against 2.50 percent for Germany.
- France absorbed more Chinese value added after 2019, yet its China-specific sourcing contribution turned negative.
- Chinese imports fell relative to GDP in all five economies from 2022 to 2025, while China’s share of total imports rose in France, Italy and Spain.
- An intermediary address is not an owner: adding Hong Kong moves the UK from fourth to first for Chinese-linked direct investment.
Germany leads the measured two-way value-added footprint, while the UK, France, Italy and Spain change position across absorption, export production, demand and capital channels. This preview presents seven complete analytical sections from the 30-page article, including original decompositions and the latest matched 2026 goods observations.
Germany leads, but the runner-up depends on the channel
China’s European economic footprint is substantial, uneven and impossible to represent faithfully with a single border-trade number. Our baseline structural measure places Germany first at 6.220, followed by the United Kingdom at 4.966, Spain at 4.793, Italy at 4.299 and France at 4.113. These are bilateral value-added-equivalent intensities expressed against each economy’s domestic value added in OECD TiVA accounting. They add Chinese-origin value added absorbed in European final demand to European-origin value added absorbed in Chinese final demand. The first component is foreign value added, so the sum is not a share of European GDP produced, owned or controlled by China. (OECD TiVA 2025, January 2026 revision) (OECD TiVA 2025 indicator guide)
The ordering nevertheless contains a powerful result. Germany has more of both measured channels than every peer in the common 2022 structural snapshot. It therefore stays first whether a reader emphasizes Chinese supply absorbed in Europe, European income supported by Chinese demand, or any nonnegative combination between them. The other positions are conditional. France moves from fifth in the equal-weight baseline to second when Chinese final demand alone matters. The UK moves from second in the baseline to fifth when the question becomes Chinese-origin value added used in the country’s gross exports. These reversals are findings about economic structure, not defects to conceal with a broader composite.
The article’s original contribution is an integrated measurement design with exact calculations: continuous preference sensitivity, three- and two-factor Shapley decompositions, fifty-industry accounting, commodity-boundary tests and strictly conditional network incidences. It uses the OECD’s existing Leontief-derived indicators; it does not claim to have independently estimated a new world production matrix. Merchandise observations through 2025, matched monthly evidence for part of 2026 and end-2024 investment positions update distinct aspects of the picture. Their dates remain visible throughout. The country called Great Britain in ordinary discussion is measured here as the United Kingdom, including Northern Ireland, to preserve the official statistical boundary. (OECD inter-country input-output tables) (UN Comtrade reporters and partners)
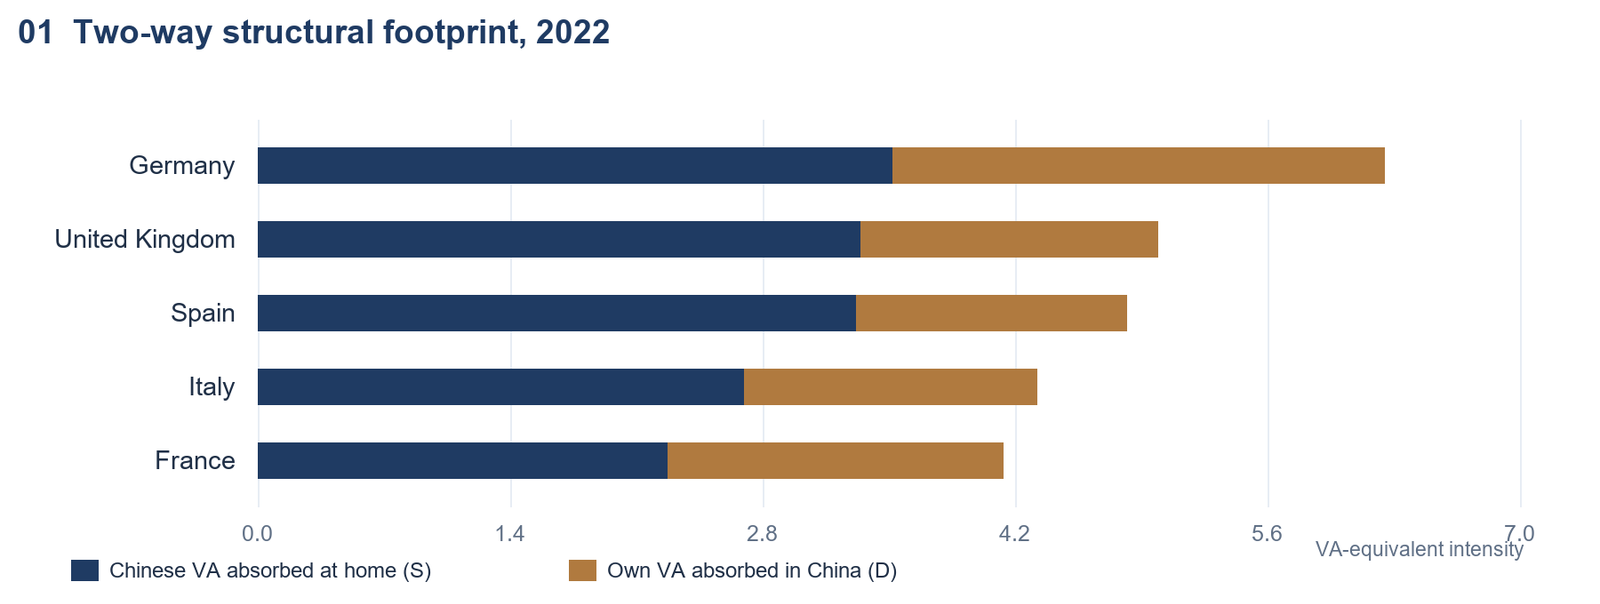
| Economy | Rank | S (% VA) | D (% VA) | F=S+D |
|---|---|---|---|---|
| Germany | 1 | 3.506 | 2.713 | 6.220 |
| United Kingdom | 2 | 3.329 | 1.637 | 4.966 |
| Spain | 3 | 3.305 | 1.488 | 4.793 |
| Italy | 4 | 2.687 | 1.612 | 4.299 |
| France | 5 | 2.263 | 1.850 | 4.113 |
Table 2. Baseline structural ranking, 2022. F is a bilateral VA-equivalent intensity, not a domestic GDP share. Article calculations from (OECD TiVA 2025, January 2026 revision).
The structural connection multiplied over twenty-eight years
The long series changes the scale of the debate. In 1995 the baseline intensity ranged from 0.314 in France to 0.490 in Germany. By 2022 all five values exceeded four. Germany’s footprint was 12.70 times its 1995 intensity, the UK’s 12.37 times, France’s 13.10 times and Italy’s 9.31 times. Spain recorded the largest multiple, 14.12, from a relatively small starting value. These are ratios of current-price accounting intensities, not growth rates in physical quantities or estimates of Chinese market power. Their importance lies in showing that the relationship expanded across all five national structures rather than remaining one exceptional German industrial story. (OECD TiVA 2025, January 2026 revision)
Germany occupies first place in all 28 annual comparisons. That persistence makes its 2022 lead more informative than a single-year rank, though it does not establish a future law. The UK is second in 25 years; Italy takes that position in 1995 and 1996, and France in 2015. Spain’s rising intensity ultimately places it third, ahead of Italy and France. Differences among these trajectories reflect both European absorption and Chinese demand for European value added. The decomposition later in the article separates the two; reading every rise as an increase in imported intermediate dependence would discard half the definition and mistake final consumption for production sourcing.
The common edition matters as much as the long span. Input-output tables reconcile information from different national systems, while revisions change historic observations as well as endpoints. Comparing 1995 from one vintage with 2022 from another would introduce an avoidable revision component. Here all structural years come from the same retained edition, and the panel contains 140 complete country-years. Currency scaling cancels within each same-country ratio, but changes in relative prices and sector composition remain economically relevant. The series is a disciplined account of growing nominal interconnection. It does not by itself identify globalization policy, exchange rates, pandemic restrictions or industrial strategy as causes, and it cannot isolate changes in volumes from changes in valuation. (OECD inter-country input-output tables) (OECD TiVA 2025 indicator guide)
France’s rising absorption did not require more Chinese sourcing
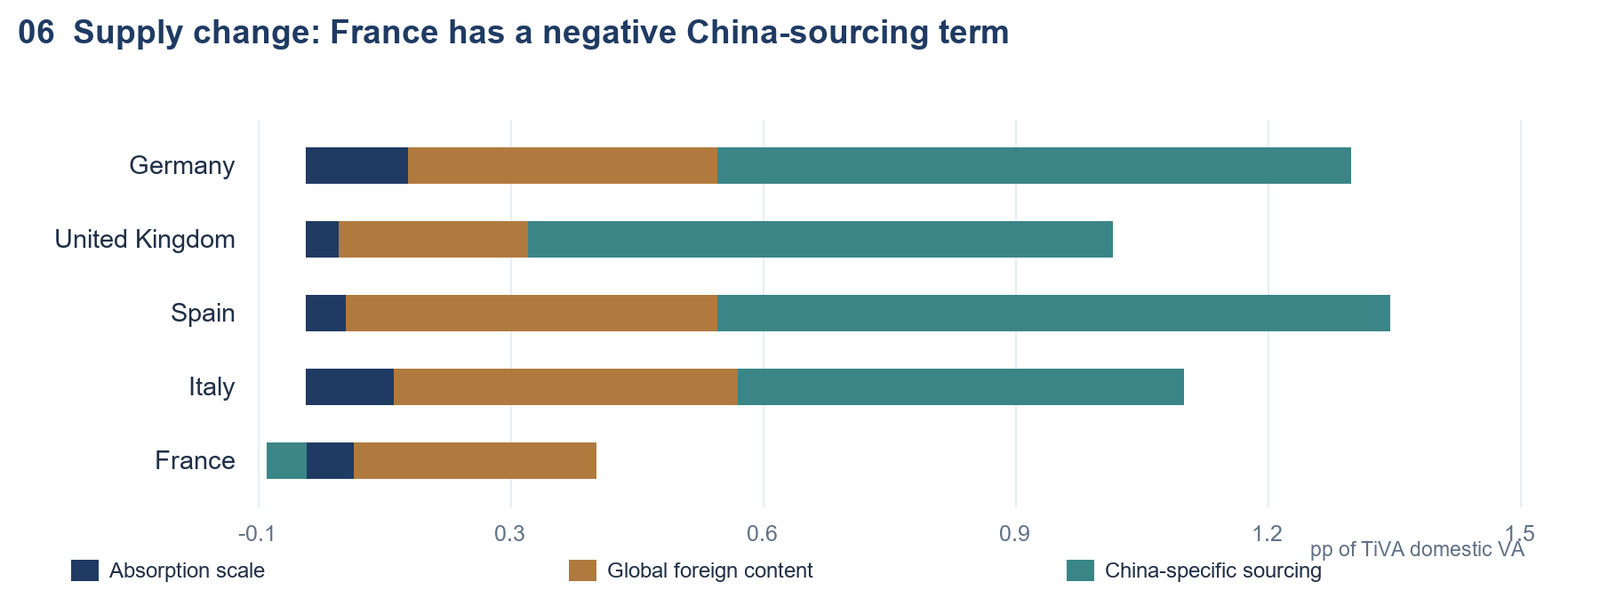
The most revealing decomposition concerns a counterexample to the usual reading of a rising exposure ratio. Write S=A x B x C, where A is final-demand value added relative to domestic value added, B is the foreign share of that final-demand value added, and C is China’s percentage share of the foreign content. A captures the absorption scale, B global foreign content, and C China-specific sourcing within foreign value added. All three factors are observed accounting quantities from the retained OECD indicators. Evaluating their changes over all six update orders and averaging each factor’s marginal contribution gives an exact three-factor Shapley allocation of the change in S. (OECD TiVA 2025, January 2026 revision) (OECD TiVA 2025 indicator guide)
Between 2019 and 2022 France’s S rose from 1.950 to 2.263, a gain of 0.313 percentage point of TiVA domestic value added. Yet China’s share of foreign value added absorbed in France fell from 8.080% to 7.895%. The Shapley terms are +0.060 from absorption scale, +0.302 from global foreign content and -0.049 from China-specific sourcing. An analyst observing only S would see more Chinese value added relative to domestic value added and might wrongly infer a stronger preference for Chinese suppliers. The factorization shows a different mechanism: greater foreign content and absorption scale outweighed the reduced Chinese share within that foreign content.
Germany, the UK, Spain and Italy all show positive China-specific sourcing contributions over the same interval, at approximately +0.792, +0.730, +0.841 and +0.557 percentage point respectively. France’s sign reversal is therefore distinctive within this comparison. It is an accounting result, not a causal finding about French policy. Freezing France’s 2019 Chinese sourcing share while applying its actual 2022 other factors gives S=2.316 rather than 2.263. That frozen-share difference of -0.053 is a separate endpoint counterfactual; it is not the -0.049 order-averaged Shapley contribution. Keeping those concepts separate avoids attributing all interaction terms to whichever factor happens to be changed last. The original result lies in identifying and exactly allocating the mechanism, not in claiming to identify a policy treatment.
The UK is second in the footprint and last in export production
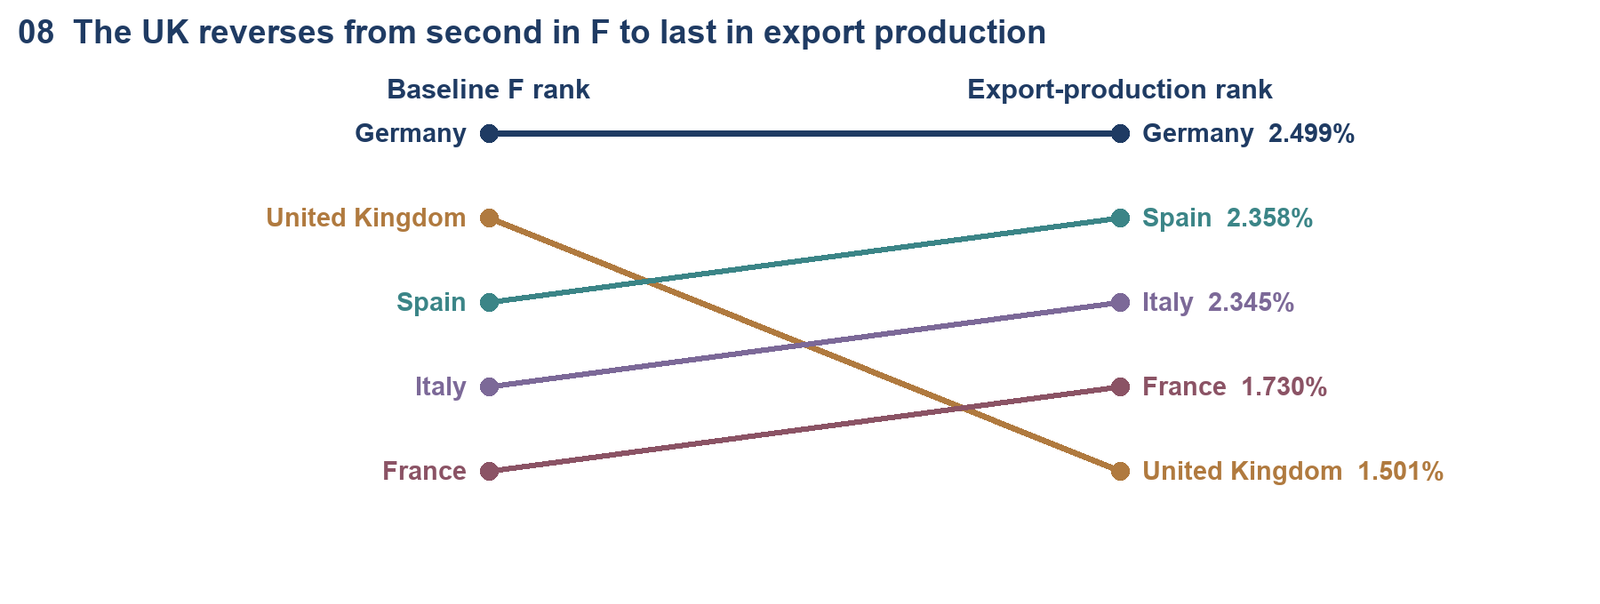
Final absorption should not be confused with factory input dependence. A separate published OECD indicator measures Chinese-origin value added embodied in a country’s gross exports, as a percentage of those exports. It captures direct and indirect Chinese value added used in the export system and therefore addresses production more closely than S, though it still excludes production serving only domestic demand. In 2022 the ranking is Germany 2.499%, Spain 2.358%, Italy 2.345%, France 1.730% and UK 1.501%. The UK is last on this production-export channel despite being second in the two-way baseline. (OECD TiVA 2025 indicator guide) (OECD TiVA 2025, January 2026 revision)
That reversal gives the British case a precise economic meaning. High Chinese content in goods and services absorbed at home can coexist with relatively low Chinese content per unit of gross export value. Neither observation cancels the other. They describe different uses of Chinese value added in a national economy with its own sector mix, consumption structure and export specialization. Germany leads both the baseline and export-production intensity, while Spain rises from third to second and Italy from fourth to third. France improves from fifth to fourth. A narrative based only on Chinese goods crossing the border would miss these distinctions between domestic absorption, productive use and foreign demand.
The historical production indicator reinforces rather than replaces the comparison. Chinese VA in gross exports rises from 0.137% to 2.499% in Germany between 1995 and 2022, from 0.165% to 2.358% in Spain, from 0.197% to 2.345% in Italy, from 0.132% to 1.730% in France and from 0.156% to 1.501% in the UK. These are published shares, rounded by the source to 0.001 percentage point. The article does not promote approximate reconstructed dollar amounts into exact flows. Nor does it add the export-production share to S: the denominators differ and some underlying value added is already represented in final absorption. The value of this indicator is its independent diagnostic question, not an extra term in an ever-larger composite.
Falling imports relative to GDP can conceal rising sourcing shares
Between 2022 and 2025 Chinese merchandise imports relative to GDP fall in all five economies, yet China’s share of total imports rises in France, Italy and Spain. This is the second major warning against reading one aggregate ratio as a de-risking verdict. Let s be China imports divided by world imports and o world imports divided by GDP. Then Chinese imports/GDP equals s x o. The exact symmetric change is change(s) x mean(o) + change(o) x mean(s). This two-factor Shapley identity separates China-specific supplier share from total goods-import openness, with no regression and no arbitrary residual allocation. (UN Comtrade 2025 reporter query) (World Bank current-dollar GDP, retained API vintage)
Germany’s gross China-import/GDP ratio declines by 0.978 percentage point, of which only -0.023 comes from supplier share and -0.956 from total import openness. France declines by 0.518, even as supplier share contributes +0.132, offset by -0.650 from openness. Italy’s change is -0.212, with +0.434 from Chinese supplier share and -0.646 from openness. Spain’s -0.680 combines +0.193 and -0.873. The UK’s decline of -0.727 is different: both supplier share, -0.494, and openness, -0.233, reduce the ratio. The calculations close within numerical tolerance; tiny display-rounding differences are not additional economic mechanisms.
The level evidence makes the inference concrete. Italy’s Chinese imports rise from USD60.937 billion to USD68.489 billion over those endpoints, and Spain’s from USD52.201 billion to USD55.731 billion. France is approximately unchanged at USD84.450 billion and USD84.280 billion. Thus a declining GDP-scaled ratio can accompany increasing nominal purchases and rising relative reliance on China within imported goods. None of those nominal movements establishes real volumes, import-price effects or causal substitution. The practical implication is to require a sourcing-share decomposition before treating a fall in gross import/GDP as evidence that alternative suppliers are replacing China. Ratios with different denominators answer different questions even when they share the same numerator.
| Economy | China supplier share | Import openness | Total change |
|---|---|---|---|
| Germany | -0.023 | -0.956 | -0.978 |
| United Kingdom | -0.494 | -0.233 | -0.727 |
| Spain | 0.193 | -0.873 | -0.680 |
| Italy | 0.434 | -0.646 | -0.212 |
| France | 0.132 | -0.650 | -0.518 |
Table 4. Exact merchandise import/GDP decomposition, 2022 to 2025. Percentage points. Supplier share x total goods-import openness = China imports/GDP. Article calculations from (UN Comtrade 2025 reporter query).
An intermediary address does not identify the ultimate owner
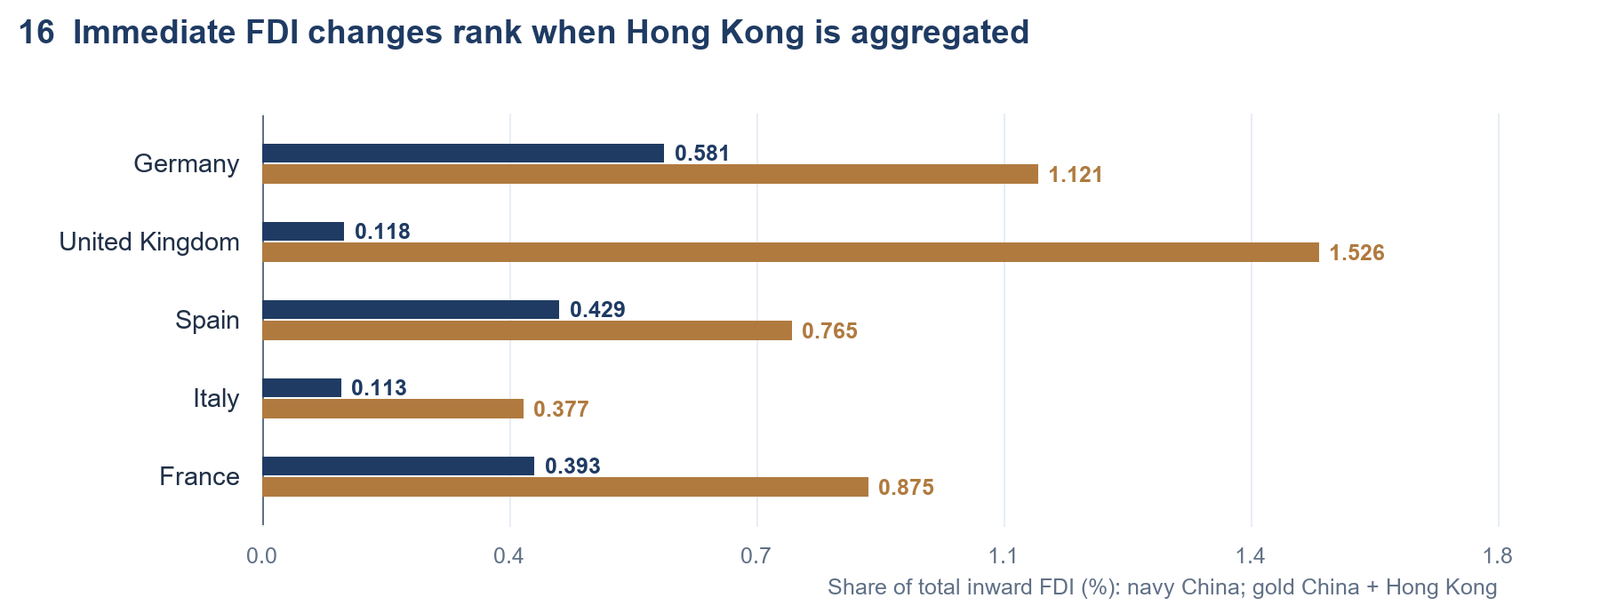
Adding Hong Kong to mainland China changes the end-2024 immediate-investor geography markedly. The combined share of total inward FDI becomes UK 1.526%, Germany 1.121%, France 0.875%, Spain 0.765% and Italy 0.377%. The UK moves from fourth in China-only immediate share to first in the geographical aggregation. This is not an offshore-ownership correction or an upper bound on mainland control. Some Hong Kong investment can have mainland ultimate owners, some can have other owners, and mainland ultimate investment can also pass through other jurisdictions. The retained data do not allocate those ownership chains completely. (OECD detailed FDI positions by counterpart) (Eurostat ultimate-counterpart positions)
Available ultimate-investor numerators nevertheless show that the distinction matters. Eurostat’s end-2024 Chinese ultimate position is 2.035 times its immediate position in France, 10.422 times in Italy and 1.954 times in Spain. Italy’s observations are EUR5.622 billion ultimate versus EUR0.539 billion immediate. They demonstrate a serious limitation in treating the smallest immediate-China stock as a complete ownership measure. They do not justify inventing Germany’s missing 2024 ultimate observation or a comparable UK series. No complete five-country ultimate-mainland-Chinese ownership ranking is claimed. (Eurostat retained annual inward-position query)
Even an available world denominator requires inspection. Eurostat’s 2024 ultimate world totals differ from immediate totals, while the OECD ultimate world totals equal immediate totals for France and Italy but differ for Spain. Definitions can involve round-tripping and compilation treatments; this study does not claim to reconcile every discrepancy. We therefore compare China numerators on each source’s own basis rather than divide by a generic world label and assume unchanged coverage. Bundesbank statistics likewise show that changing the resident-sector look-through can alter the underlying balance-sheet total, not merely the investor-country label. Ownership measurement is an empirical research problem, not a choice between a narrow number and an intuitively inflated one. The schematic distinguishes immediate residency, an observed ultimate chain and the geographic aggregation that does not perform that look-through. (Deutsche Bundesbank direct-investment statistics) (Eurostat FDI reference metadata)
Actual 2026 observations extend goods evidence, not the network
The freshest retained goods evidence compares exactly January to June 2026 with January to June 2025 for Germany, Italy, Spain and the UK. China-origin imports rise 16.009% in Germany, 9.440% in Italy, 14.649% in Spain and 9.092% in the UK. China’s share of total merchandise imports rises by 0.512 percentage point in Germany and 0.295 in Spain, but falls by 0.160 in Italy and 0.771 in the UK. Nominal purchases and supplier shares can therefore move in different directions even within the newest common six-month window. These are actual reported sums and ratios; they are neither annualized values nor forecast-filled annual observations. (UN Comtrade June 2026 reporter query)
France has no returned 2026 monthly observations in this extraction. That is a reporting gap, not zero trade and not evidence of a French retreat from China. The five-country current annual ranking consequently remains the complete 2025 comparison. Monthly coverage extends to July for Germany and Italy, June for Spain and August for the UK. Comparing each country’s freshest window can inform its own trajectory, but those unequal windows cannot form a comparable 2026 country ranking. The retained data include all four China/world import/export series before a month enters a matched calculation.
Exports to China add another divergence. In the common first half they fall 6.759% in Germany, while rising 26.939% in Italy, 6.048% in Spain and 34.619% in the UK. The latest country-specific UK January to August growth is 45.587%, but no monthly HS2 dataset was acquired to identify which products account for it. Attribution to gold, cars or other categories would therefore be unsupported. Dollar values also combine quantity and price movements and cannot identify real export growth alone. This disciplined endpoint is less dramatic than a full-year 2026 league table, but it is more useful: it tells the reader exactly what has been observed by the cutoff and preserves the distinction between updated border flows and the still-2022 structural production network.
| Economy | China imports, USD bn | Import growth | Supplier share | Share change, pp |
|---|---|---|---|---|
| Germany | 107.811 | 16.009% | 12.919% | 0.512 |
| Italy | 37.140 | 9.440% | 10.187% | -0.160 |
| Spain | 30.135 | 14.649% | 10.969% | 0.295 |
| United Kingdom | 55.345 | 9.092% | 10.441% | -0.771 |
Table 11. Matched January to June 2026 versus 2025. Actual six-month values. France: no 2026 monthly report returned; missing, not zero. Article calculations from (UN Comtrade June 2026 reporter query).
Continue reading
Get the full note: 30 pages, 22 figures, 12 tables
This page shows the first part of the note. The full PDF adds: fifty-industry accounting, continuous ranking robustness, commodity-boundary tests, five country profiles, ultimate ownership comparisons and the full source appendix.
29 USD, instant PDF download, secure card payment.
Buy the full noteNeed this analysis for your organisation?
We prepare confidential briefings, executive talks and studies on countries, markets and policies, built on the same method as this article.
Request a briefingSupport independent analysis
Our studies are free to read and carry no advertising. If this one was useful, a small contribution helps us publish the next.
Support our workGo further: books by Global Strategy Files

Frequently asked questions
Which major European economy is most exposed to China?
Germany. Its two-way value-added footprint was 6.22 in 2022, against 4.97 for the United Kingdom, 4.79 for Spain, 4.30 for Italy and 4.11 for France, and it ranks first under every weighting of Chinese supply and Chinese demand.
Does the UK depend heavily on Chinese inputs for its exports?
No. The UK ranks second in the overall footprint but last for Chinese value added embodied in gross exports, at 1.50 percent against 2.50 percent for Germany. Its exposure comes mainly through goods and services absorbed at home.
Are Chinese imports falling in Europe?
Relative to GDP, yes, in all five economies between 2022 and 2025. But China’s share of total imports rose in France, Italy and Spain: lower import openness hides a rising Chinese supplier share.
Sources
- OECD TiVA 2025, January 2026 revision
- OECD TiVA 2025 indicator guide
- OECD inter-country input-output tables
- UN Comtrade reporters and partners
- UN Comtrade 2025 reporter query
- World Bank current-dollar GDP, retained API vintage
- OECD detailed FDI positions by counterpart
- Eurostat ultimate-counterpart positions
- Eurostat retained annual inward-position query
- Deutsche Bundesbank direct-investment statistics
- Eurostat FDI reference metadata
- UN Comtrade June 2026 reporter query
Books from Global Strategy Files
Go further on this topic
The Tariff GambleHow America’s trade war is reshaping power, prices and prosperity.24.99 USD, see the book Future-Proofing AmericaEconomic challenges and the road to reform.20 USD, see the book
 Kill KennedyWhat the 2025 declassified files reveal about the machinery of American power.20 USD, see the book