
The Housing Shortfall to 2035: How Many Homes Are Missing and Can They Be Built?


Driss EFFINA, PhD Independent Researcher, Global Strategy Files Foresight, prospective note No. 19, 24 October 2026. Reading time: about 60 minutes
Key takeaways
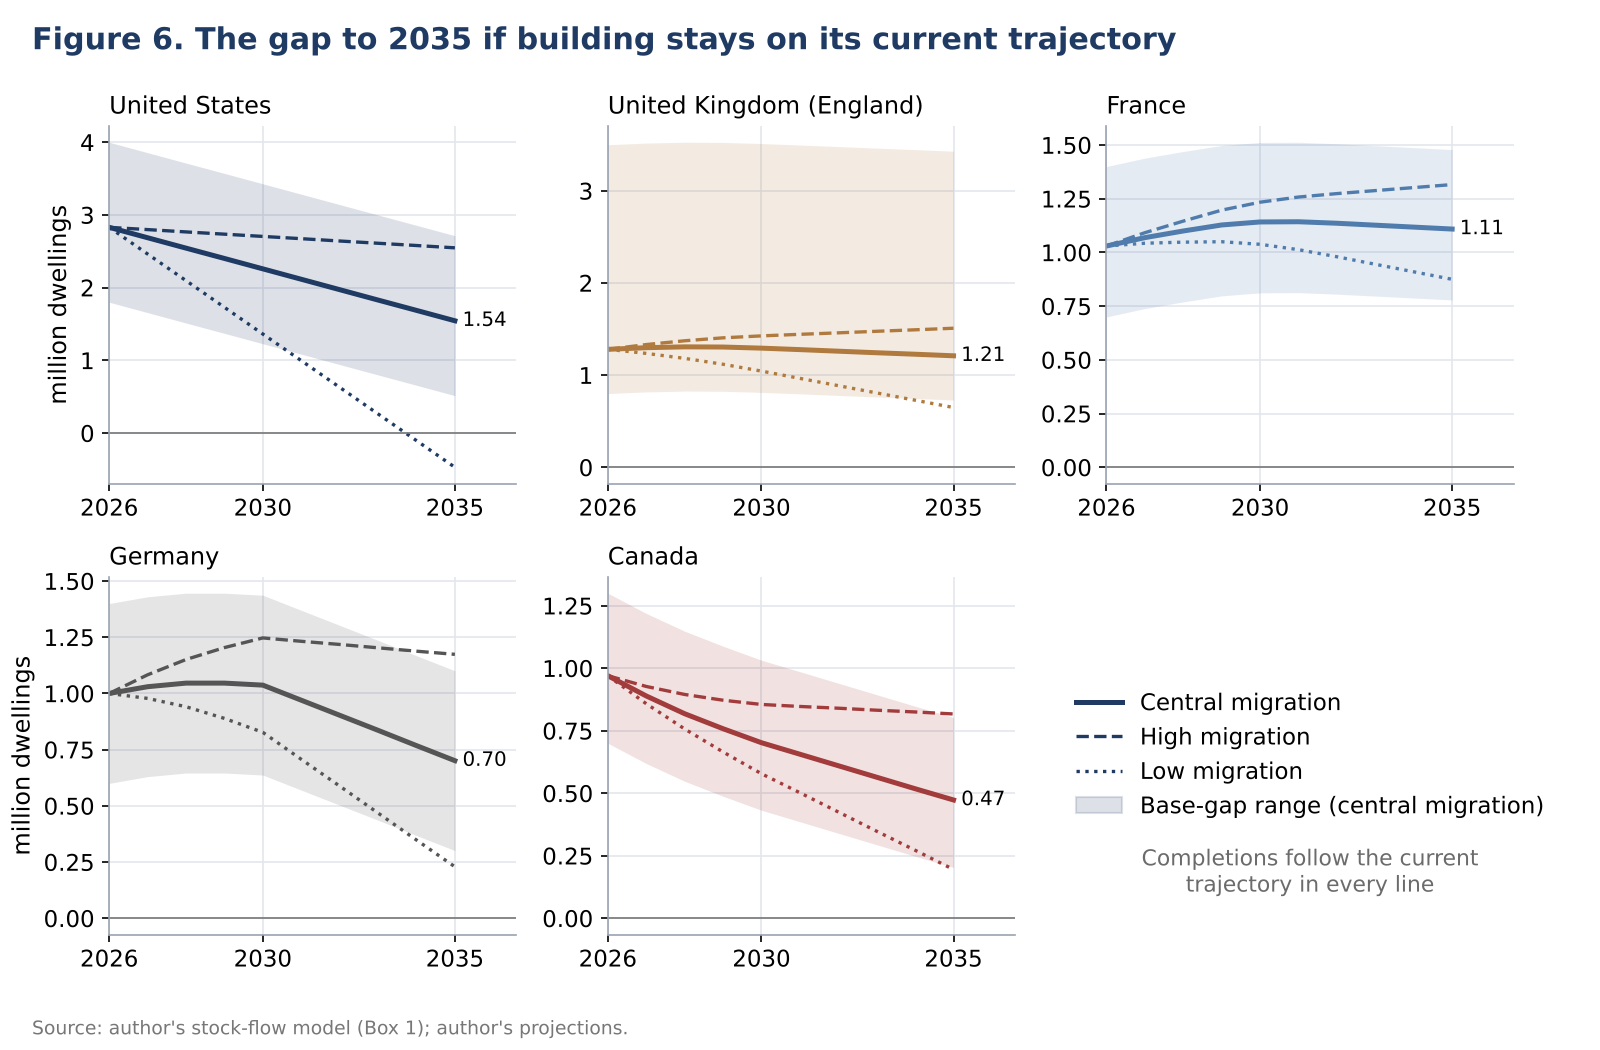
- About 7.1 million homes are missing across the five countries at the end of 2026: 2.83 million in the United States, 1.28 million in England, 1.03 million in France, 1.0 million in Germany and 0.97 million in Canada. Per household, Canada and England are the most short.
- Closing the gap by 2035 needs 2.87 million completions a year, 24 percent above the current trajectory: 13 percent more in the United States, 24 percent in Canada, 34 to 40 percent in Germany and France and 58 percent in England.
- The United States and Canada can build their way out by 2033 to 2034 with modest growth; France and Germany only by reviving lost capacity; England cannot close its gap by 2035 on any plausible path.
- Migration moves the 2035 gap by 5.9 million homes between low and high paths. The author’s scenarios give a probability-weighted gap of 4.3 million in 2035; a full build push would add 0.55 to 1.4 percent of GDP at its peak and lower real rents by 1.6 to 4.0 percent.
Abstract
Every government in this note has a housing number. Britain promises 1.5 million homes in England in this Parliament. France launched a plan in January 2026 for 2 million homes by 2030. Germany spent years chasing 400,000 completions a year and has just recorded 206,000. Canada’s housing agency says 430,000 to 480,000 new units a year are needed until 2035; its best year since 2015 brought 271,200 starts. In the United States, published estimates of the shortage run from 1.5 to 5.5 million homes. The numbers are rarely comparable, and they almost never ask the second question: even if the homes are missing, can the industry build them by 2035?
This note answers both questions for the United States, the United Kingdom (England, where the data and the target sit), France, Germany and Canada. It builds a stock-flow model of the physical housing gap (households and latent households, plus frictional vacancy, minus the dwelling stock, adjusted for obsolescence and, in Germany, regional mismatch), anchors each country’s starting gap on published estimates, and projects it to 2035 under three migration paths, including the migration break analysed in Decoded No. 11. It computes the build rate needed to close the gap by 2035 and compares it with output, past peaks and a capacity frontier set by labour and productivity. It scores five constraints in a heatmap, prices the financing wall at 2026 rates, estimates the macro effect of a building push on GDP, construction labour and rents, and sets out four scenarios to 2035 with probabilities, a dashboard of twelve indicators and a calendar. Prices and affordability (Decoded No. 12) and mortgage resets (Decoded No. 2) are not repeated: the subject here is bricks. All projections and probabilities are the author’s.
Keywords: housing shortage, housing supply, housing completions, household formation, migration, construction labour, construction productivity, planning, residential investment, rents, United States, United Kingdom, France, Germany, Canada
JEL codes: R21, R31, E22, J11, J61, O18
Key findings
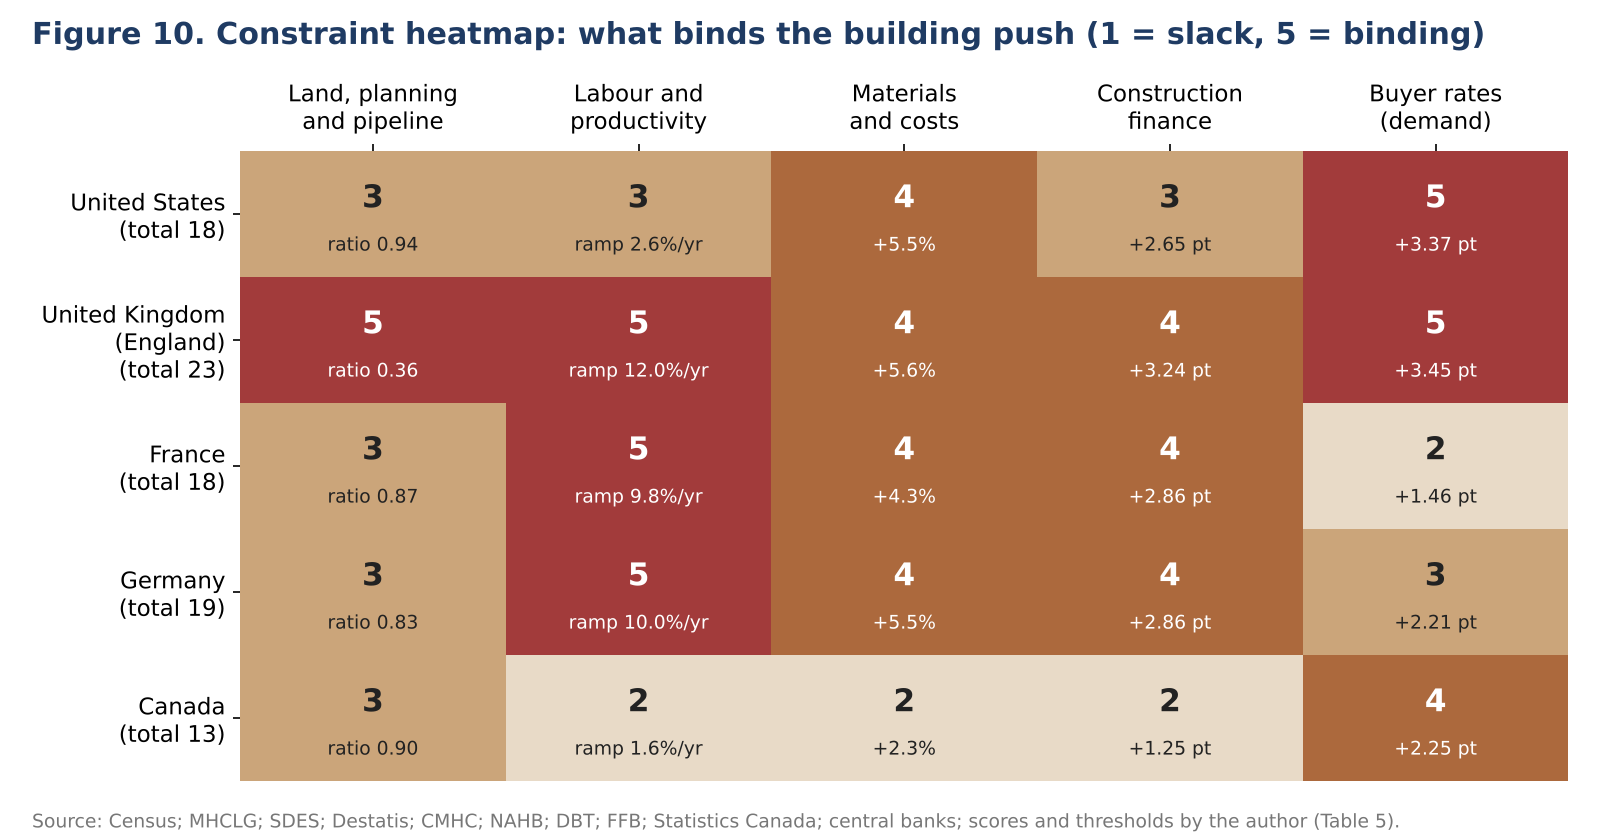
1. About 7.1 million homes are missing across the five countries at the end of 2026, but the shortage is largest where it is least visible in the headlines. The author’s base gap is 2.83 million dwellings in the United States, 1.28 million in England, 1.03 million in France, 1.0 million in Germany and 0.97 million in Canada (range 4.6 to 11.6 million in total). Per 1,000 households it is 57 in Canada and 52 in England, against 21 to 32 elsewhere. The widely quoted US figures of 4 to 5.5 million predate the 2024 completions record, which cut the vacancy component to about 0.83 million. 2. Closing the gap by 2035 requires 2.87 million completions a year across the five, 24 percent more than the current trajectory. The required rate is 1.49 million a year in the United States (13 percent above baseline), 366,000 in England (58 percent), 430,000 in France (40 percent), 307,000 in Germany (34 percent) and 277,000 in Canada (24 percent). On the current trajectory the gap is still 5.0 million in 2035. 3. North America can build its way out; England cannot, and France and Germany only by reviving capacity they let go. The United States needs completions to grow by 2.6 percent a year and Canada by 1.6 percent; both close the gap by 2033 to 2034 at the author’s capacity frontier. France and Germany need about 10 percent a year, feasible only by returning to their 2020 to 2021 output and then growing. England needs 12 percent a year; even at the frontier it lacks 0.91 million homes in 2035, and the 1.5 million pledge is on course for about 1.0 million. 4. Migration is the largest swing factor, and it cuts both ways. Between the low- and high-migration paths, the 2035 gap differs by 5.9 million dwellings, 83 percent of today’s gap. If US net immigration stays near 450,000 a year, the US gap closes by 2035 at current build rates. But immigrants are 26.3 percent of the US construction workforce: the policy that shrinks demand also shrinks the crews. 5. The binding constraint differs by country, and finance has become a common one. On the author’s heatmap (5 to 25), England scores 23, Germany 19, the United States and France 18 and Canada 13. At 2026 rates construction finance costs 2.8 to 4.0 percent of build cost, against 1.3 to 1.8 percent in 2021, and the rent or price needed to make a 2021-viable project viable is 40 to 68 percent higher on financing alone. 6. A building push pays, but it is not the most likely path. Moving to the capacity frontier would add 0.55 percent of GDP to annual investment at the peak in the United States and the United Kingdom and 1.2 to 1.4 percent in France, Germany and Canada, and lower real rents in 2035 by 1.6 to 4.0 percent relative to baseline. The author assigns 40 percent to a grind (gap 5.0 million in 2035), 20 percent to a build push (1.1 million), 25 percent to demographic relief through low migration (2.3 million) and 15 percent to a stall (9.9 million): a probability-weighted gap of 4.3 million.
1. Introduction: a shortage counted in bricks
This note describes the housing shortage in units: how many more dwellings a country would need today for every household that wants to live on its own to do so, with a normal margin of empty homes, and how many more it will need each year until 2035. That physical gap is narrower than an affordability gap, but it can be compared with what the construction industry can deliver.
The question matters in 2026 for three reasons. First, output is falling just as targets rise. Germany completed 206,000 dwellings in 2025, the fewest since 2012; France started 264,800, barely above the 2024 low of 258,100; England added 208,600 net in 2024-25, 6 percent fewer than a year earlier; US completions in the first nine months of 2026 were 12.5 percent below 2025. Only Canada has held starts above 240,000. Second, the 2026 oil shock and the bond-market repricing that followed it pushed borrowing costs back up: the US 30-year mortgage rate averaged 7.36 percent in October, the British two-year fixed rate reached 5.13 percent in September and building-cost inflation is running at 5.5 percent in the United States and Germany. Third, migration has broken from trend. US net immigration fell from 2.3 million in 2024 to 410,000 in 2025, British net migration to 171,000 and Canada’s population growth to 0.5 percent a year (Decoded No. 11). Housing need is in large part a function of people, and the number of people expected in 2035 has changed.
Figure 1 sets out the framework. Households are driven by population and by headship (the share of adults who head a household), which depends on ageing, incomes and housing costs. Households that would form if housing were available, but do not, are latent households: adult children at home, couples sharing with others. The required stock is all households, actual and latent, plus a margin of vacant dwellings and second homes. The gap is the required stock minus the actual stock. Each year the gap grows with household formation and with the dwellings lost to demolition or conversion, and shrinks with completions. Box 1 gives the equations.
Sections 2 to 5 cover supply since 2015, the starting gap, annual need and the required build rate; Sections 6 and 7 ask whether the homes can be built; Sections 8 and 9 cover the macro effect of a building push and four scenarios; Sections 10 to 12 present a dashboard, implications and a calendar.
2. A decade of supply, 2015 to 2026
2.1 Five trajectories
Figure 2 shows the main supply series in each country since 2015 against the required build rate derived later in the note. The five trajectories have little in common.
United States. Completions rose every year from 968,000 in 2015 to 1.63 million in 2024, as the apartment wave started in 2021 and 2022 came to market. They fell to 1.50 million in 2025 and, on the year-to-date data, to about 1.31 million in 2026: 969,600 units were completed between January and September, 12.5 percent fewer than a year earlier. Starts have been flat at 1.36 to 1.41 million a year since 2023 and ran at 1.22 million in September 2026, while homes authorised but not started rose by 9.8 percent to 279,000: builders have approvals they are choosing not to use.
England. Net additional dwellings, the measure of the government’s target, peaked at 248,590 in 2019-20 and have drifted down since, to 208,600 in 2024-25. The government’s own estimate, based on new energy performance certificates, puts net additions between 9 July 2024 and 20 September 2026 at 437,900, about 199,000 a year. New-build starts recovered to 130,170 in the year to March 2026, against 192,210 in the year to June 2023.
France. Starts reached 433,900 in 2017 and 412,600 in 2021, then collapsed to 295,900 in 2023 and 258,100 in 2024, with only a slight recovery to 264,800 in 2025. Starts of individual houses fell by 45 percent between 2021 and 2025. Permits have turned up (376,241 in the twelve months to June 2026, still 8.0 percent below their five-year average), but the building federation (FFB) expects fewer than 300,000 starts in 2026 and a further fall in 2027.
Germany. Completions rose from 247,700 in 2015 to 306,400 in 2020, held at about 294,000 a year in 2021 to 2023, then fell by 18 percent in 2025 to 206,000. The ifo institute expects 185,000 in 2026, 195,000 in 2027 and 210,000 in 2028. Permits rose by 10.6 percent in 2025 and by 12.1 percent in the first eight months of 2026, but 760,700 approved dwellings were unfinished at the end of 2025, 35,700 permits expired, the most since 2002, and the time from permit to completion rose to 27 months from 20 in 2020.
Canada. Starts rose from 195,500 in 2015 to 271,200 in 2021 and have stayed in a 240,000 to 260,000 range since; 2025 brought 259,000. The annual rate was 248,896 in September 2026 and the six-month trend 250,411. According to the Parliamentary Budget Officer (PBO), the dwelling stock grew by a record 276,000 units in 2024.
2.2 The 2026 snapshot
Table 1 brings together the latest readings. The panel of Figure 2 that expresses output as a share of the required build rate summarises the decade: the United States came closest, briefly exceeding the requirement in 2024; Germany and France were near it until 2022 and have fallen to 60 to 67 percent; England has never exceeded 68 percent.
Table 1. Housing supply in 2026: latest official readings. Sources: US Census Bureau (New Residential Construction, September 2026; HVS Q2 2026); MHCLG; INSEE-SDES; FFB; Destatis; ifo; CMHC; PBO. Retrieved 24 October 2026.
| United States | England | France | Germany | Canada | |
|---|---|---|---|---|---|
| Output, latest full year | 1.498m completions (2025) | 208,600 net additions (2024-25) | 264,800 starts (2025) | 206,000 completions (2025) | 259,000 starts (2025) |
| Change from previous year | -7.9% | -6% | +2.6% | -18% | +6% |
| 2026 so far | Completions -12.5% (Jan to Sep) | Starts 130,170 in 12m to Mar, +15% | Permits 376,241 in 12m to Jun | Permits +12.1% (Jan to Aug) | Starts 248,896 SAAR (Sep) |
| Previous peak since 2015 | 1.627m (2024) | 248,590 (2019-20) | 433,900 (2017) | 306,400 (2020) | 271,200 (2021) |
| Dwelling stock | 149.5m (Q2 2026) | 25.6m (Mar 2024) | 38.6m (Jan 2026) | 44.0m (end 2025) | 17.2m (2024) |
| Vacancy indicator | Rental 7.3%, owner 1.2% | n.a. | 2.93m vacant (7.6%) | 1.92m vacant (Census 2022) | 3.3% total (2024) |
| Official target or benchmark | None national | 1.5m in Parliament; 370,000 a year planning need | 400,000 a year (2m by 2030) | 400,000 a year (former) | 430,000 to 480,000 starts (CMHC) |
A first look at the results
The full note goes much further, with original models, scenarios and a dashboard of leading indicators. Two of its 14 charts and diagrams are shown below.
Continue reading
Get the full note: 28 pages, 14 charts and diagrams, 15 tables
This page shows the first part of the note. The full PDF adds: how many homes are missing?; annual need: households, replacement and migration; the gap to 2035 and the build rate needed; can they be built? Capacity, labour and productivity; constraints: finance at 2026 rates and the heatmap; the macro effect of a building push; four scenarios to 2035; leading-indicators dashboard; implications for policy, builders, investors and households.
29 USD, instant PDF download, secure card payment.
Buy the full noteNeed this analysis for your organisation?
We prepare confidential briefings, executive talks and studies on countries, markets and policies, built on the same method as this article.
Request a briefingSupport independent analysis
Our studies are free to read and carry no advertising. If this one was useful, a small contribution helps us publish the next.
Support our workGo further: books by Global Strategy Files

Frequently asked questions
How many homes are missing in the US, UK, France, Germany and Canada?
The author’s stock-flow model puts the physical housing gap at about 7.1 million dwellings at the end of 2026: 2.83 million in the United States, 1.28 million in England, 1.03 million in France, 1.0 million in Germany and 0.97 million in Canada. The range is 4.6 to 11.6 million. Relative to households the gap is largest in Canada (57 per 1,000) and England (52), and smallest in the United States (21).
How many homes a year are needed to close the housing gap by 2035?
Across the five countries about 2.87 million completions a year are needed from 2027 to 2035, 24 percent more than the current trajectory. That means 1.49 million a year in the United States, 366,000 in England, 430,000 in France, 307,000 in Germany and 277,000 in Canada. Without that increase the five-country gap is still about 5.0 million homes in 2035.
Can England deliver 1.5 million homes in this Parliament?
Not on current trends. Net additions have run at about 199,000 a year since July 2024, and the pledge would require about 371,000 a year from September 2026. On the author’s baseline the Parliament delivers about 1.0 million homes. Closing England’s wider gap by 2035 would require completions to grow by 12 percent a year, beyond the industry’s capacity; even at the author’s capacity frontier about 0.9 million homes would still be missing in 2035.
How does migration affect the housing shortage?
Migration is the largest swing factor. Between low and high migration paths, the five-country housing gap in 2035 differs by about 5.9 million homes. If US net immigration stays near 450,000 a year, the US gap closes by 2035 at current building rates. But immigrants make up 26.3 percent of the US construction workforce, so lower migration also reduces the capacity to build.
Sources
- US Census Bureau, “New Residential Construction”, releases for December 2019, December 2023, December 2025 and September 2026 (newresconst_201912, _202312, _202512, _202609). Retrieved 24 October 2026.
- US Census Bureau, “Quarterly Residential Vacancies and Homeownership, Second Quarter 2026”, Table 3, total housing inventory.
- Congressional Research Service, “Estimates of a ‘Housing Shortage'”, IN12628, December 2025 (Freddie Mac, Zillow, Brookings, Up for Growth, NAR estimates).
- Freddie Mac, U.S. Economic, Housing and Mortgage Outlook, May 2024, as reported in “U.S. Housing is 1.5 Million Units Shy of a Balanced Market, Freddie Mac Estimates”.
- Up for Growth, “Housing Underproduction in the U.S.”, October 2024.
- Joint Center for Housing Studies of Harvard University, D. McCue, “New Projections Anticipate a Slowdown in Household Growth and Housing Demand”, January 2025.
- Congressional Budget Office, “The Demographic Outlook: 2026 to 2056”, January 2026.
- Bureau of Labor Statistics, Employment and Earnings, Table B-1, September 2026 (residential building construction, residential specialty trade contractors).
- National Association of Home Builders, Eye on Housing: “Which States and Construction Trades Depend the Most on Immigrant Workers” (April 2026); “Building Material Price Inflation Nears Four-Year High” (October 2026); “Cost of Constructing a Home in 2024” (January 2025).
- RealEstateNews.com, “Residential construction industry faces increasing labor shortage”, 16 October 2026 (NAHB labour availability survey).
- Kelley Drye, “President Trump Imposes New Section 232 Tariffs on Imports of Timber, Lumber, and Their Derivative Products”, October 2025.
- A. Goolsbee and C. Syverson, “The Strange and Awful Path of Productivity in the US Construction Sector”, NBER; Becker Friedman Institute research summary.
- MHCLG: “Housing supply: net additional dwellings, England: 2024 to 2025”; “Housing supply: indicators of new supply, England: January to March 2026”; letter of 13 December 2024 on the revised NPPF; “Analysis of the determinants of house price changes”, April 2018.
- Office for National Statistics, “Household projections for England: 2022-based”, 28 October 2025.
- Full Fact, “Is the government on track to deliver 1.5 million new homes?”, updated 9 October 2026.
- Office for Budget Responsibility, “Economic and fiscal outlook, March 2025”, box “Alternative scenarios for housebuilding”; MHCLG press release on the OBR assessment of planning reforms, 26 March 2025.
- Centre for Cities, “The housebuilding crisis: how big is Britain’s backlog of missing homes?”, February 2023.
- CITB, Construction Workforce Outlook 2026 to 2030, as reported by The Tile Association, 30 July 2026.
- Department for Business and Trade, “Construction building materials: commentary September 2026”.
- INSEE, “Logements mis en chantier, 2000 à 2025” and “Répartition du parc selon la catégorie de logement”; SDES, “Construction de logements: résultats à fin juin 2026”.
- Ministère de la Transition écologique (DHUP), “GT Analyse des besoins en logement”, 14 December 2023.
- Gouvernement, “Le Gouvernement lance le plan Relance logement”, 23 January 2026.
- Fédération Française du Bâtiment, “Le PLF de la dernière chance pour le bâtiment”, press conference of 15 September 2026.
- INSEE, Index bâtiment, Informations rapides, June 2026.
- Destatis via Baulinks: “Wohnungsbau 2025: Zahl der Fertigstellungen sank um 18%”; “Baugenehmigungen für Wohnungen, Berichtsmonat August 2026”; “Baupreise im Wohnungsbau erneut gestiegen” (9 October 2026).
- Destatis, “44,0 Millionen Wohnungen in Deutschland zum Jahresende 2025”, press release, July 2026; Haushalte und Familien (Mikrozensus 2025); Baugenehmigungen tables 2024 and 2025; press release No. 017 of 15 January 2026 (GDP 2025).
- ZDFheute, “Studie zählt 1,4 Millionen fehlende Wohnungen” (Pestel Institut for Bündnis Soziales Wohnen), 15 January 2026; Münster Aktuell, “Deutschland fehlen rund 1,35 Millionen Wohnungen” (Bau-Monitor 2026), 26 August 2026.
- Haus und Grund Frankfurt, “Wohnungsbedarfsprognose” (BBSR need of 320,000 a year to 2030), June 2025.
- JACASA Letter KW30 2026 (ifo completions forecast 2026 to 2028).
- Hauptverband der Deutschen Bauindustrie, Bau-Telegramm Konjunktur Q4 2025, 3 March 2026.
- Parliamentary Budget Officer, “Household Formation and the Housing Stock: Estimating the Housing Gap in 2035”, 26 August 2025.
- CMHC, “Housing starts and construction data, September 2026”; CMHC housing supply gap estimates, June 2025 (CBC, 19 June 2025); 2025 starts (Advisor.ca); 2024 starts (Advisor.ca).
- Investment Executive on the PBO and Build Canada Homes, 2 December 2025; CBC on the launch of Build Canada Homes, 14 September 2025; CHBA on the BuildForce Canada 2026 to 2035 outlook, 20 July 2026.
- Statistics Canada, “Building construction price indexes, second quarter 2026”, 24 July 2026; population estimates (Daily Hive, September 2026).
- Data series: FRED WSCNDW01CAA489N, NGDPXDCCAA, FEDFUNDS, MORTGAGE30US, ECBDFR; Bank of England IUMABEDR, IUMBV34; ECB MIR composite cost of borrowing (France, Germany); Bank of Canada V39079, BD.CDN.5YR.DQ.YLD; IMF WEO October 2026 (NGDPD).
- ICAEW, “Chart of the week: a 3tn economy”, April 2026. Franceinfo, public debt at end-2025 (3,400 billion euros, 115.6 percent of GDP).
- Coutts, “Autumn Budget 2026: the key dates”; Bank of Canada 2026 schedule; Federal Reserve FOMC calendar; ECB Governing Council calendar.
- Global Strategy Files, Decoded No. 2 “The Mortgage Reset Clock”, Decoded No. 11 “The Great Labour Divergence”, Decoded No. 12 “Housing in a 5 Percent World”.
Books from Global Strategy Files
Go further on this topic
The Tariff GambleHow America’s trade war is reshaping power, prices and prosperity.24.99 USD, see the book Future-Proofing AmericaEconomic challenges and the road to reform.20 USD, see the book
 Kill KennedyWhat the 2025 declassified files reveal about the machinery of American power.20 USD, see the book
