
Index-Linked Debt and Oil: How Inflation-Indexed Bonds Turn Fuel Prices into Fiscal Cost

Driss EFFINA, PhD Independent Researcher, Global Strategy Files Decoded, analysis note No. 10, 24 October 2026. Reading time: about 55 minutes
Key takeaways
- Index-linked gilts total 686.8 billion pounds, 23.8 percent of the gilt stock and 21.5 percent of GDP: relative to GDP, more than France, the United States, Canada and Germany combined. One point of RPI for a year now costs about 6.9 billion pounds.
- Oil raised the UK RPI level by about 1.0 percent between February and September 2026 and Ofgem’s gas-driven cap by 0.35 percent; the energy shock added 8.8 billion pounds (0.28 percent of GDP) to the uplift booked from April to November.
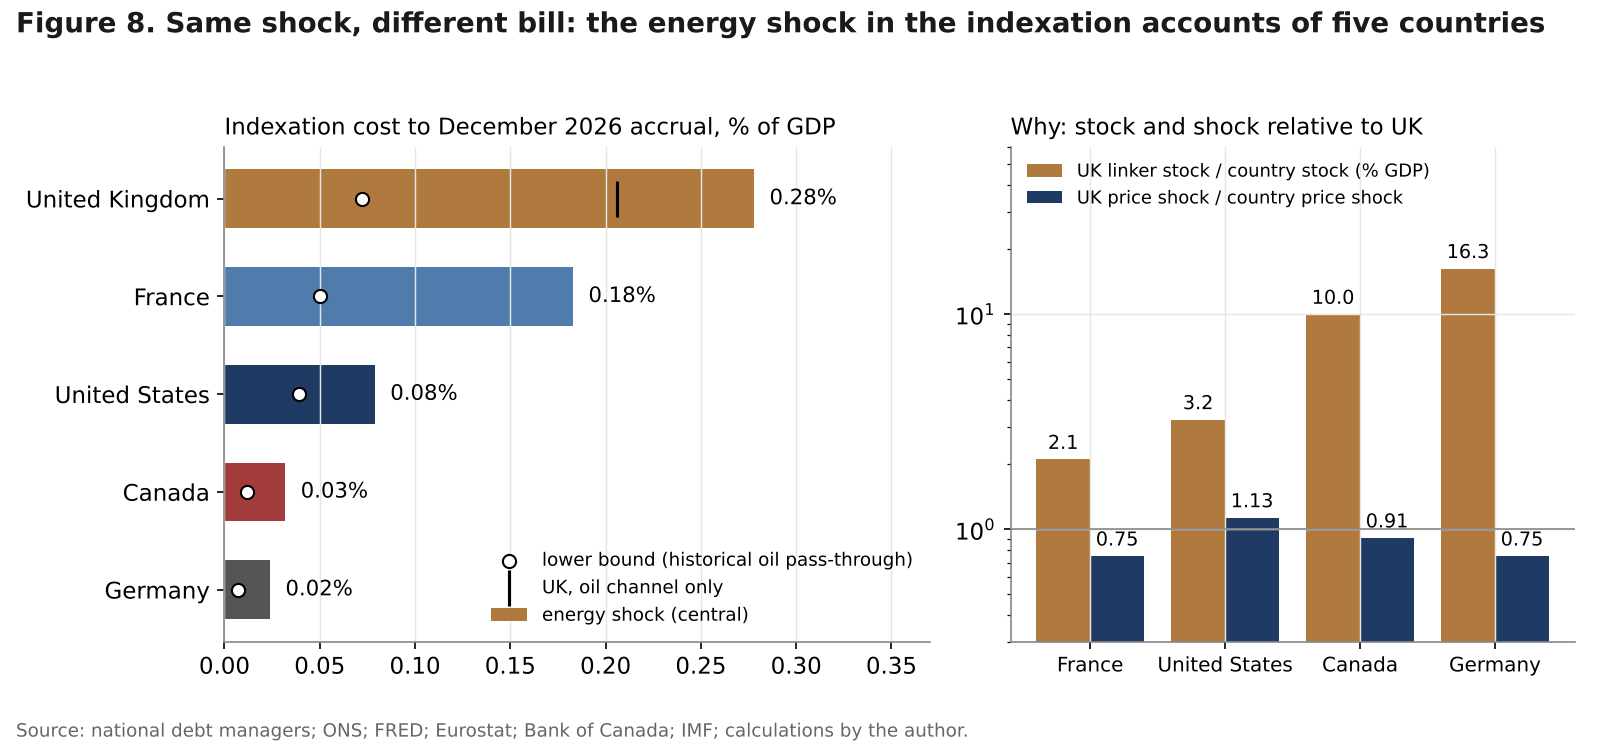
- The price shock was not larger in Britain: the footprint on reference indices was 1.2 to 1.8 points everywhere. The bill differs because of the stock: 0.28 percent of GDP in the UK, 0.18 in France, 0.08 in the US, 0.03 in Canada and 0.02 in Germany.
- In the author’s scenarios the energy shock adds 12.3 billion pounds in 2026-27, 44 percent of which reverses in 2027-28. Cutting linker issuance from 9.3 to 5 percent buys little risk reduction; the February 2030 RPI reform saves about 5.6 billion pounds a year.
Abstract
When a war closes a shipping lane, the price of crude reaches a government’s interest bill through a chain with five links: Brent, the pump and the heating-oil tank, the consumer price index, the indexation uplift on inflation-linked bonds, and the accrued debt interest recorded in the public accounts. This note measures that chain for the United Kingdom, where index-linked gilts make up 23.8 percent of the gilt stock, and compares it with France (OATi and OAT€i), the United States (TIPS), Germany (Bund linkers, no new issuance since 2024) and Canada (Real Return Bonds, issuance stopped in November 2022). It combines official 2026 data on pump prices, RPI weights, the gilt portfolio and monthly public finances with four tools built for this note: a bottom-up model of the oil effect on the RPI; a month-by-month accrual model of the capital uplift, validated against the ONS figure for September 2026; a cross-country measure of the footprint of the energy shock on each bond’s reference index; and a scenario model of RPI and linker costs to 2028. It then turns to the policy debate: whether the Debt Management Office should cut linker issuance, and how much the 2030 alignment of the RPI with CPIH changes the answer. The conclusion is that the United Kingdom does not suffer a larger price shock than its peers. It suffers the same shock on a stock of indexed debt that is twice the French one and more than three times the American one relative to GDP, booked with a lag of only two to three months.
Keywords: index-linked gilts, inflation-linked bonds, RPI, oil prices, debt interest, TIPS, OATi, Real Return Bonds, debt management, RPI reform
JEL codes: E31, E43, H63, H68, Q43
Key findings
1. The exposure is structural. Index-linked gilts amount to 686.8 billion pounds including their inflation uplift (June 2026), 23.8 percent of the gilt stock and 21.5 percent of GDP. Relative to GDP, that is more than France (10.2 percent), the United States (6.6), Canada (2.2) and Germany (1.3) combined. One extra point of RPI inflation for a year now costs about 6.9 billion pounds, 0.21 percent of GDP, 1.7 times the 4.1 billion in the OBR’s 2017 ready reckoner.
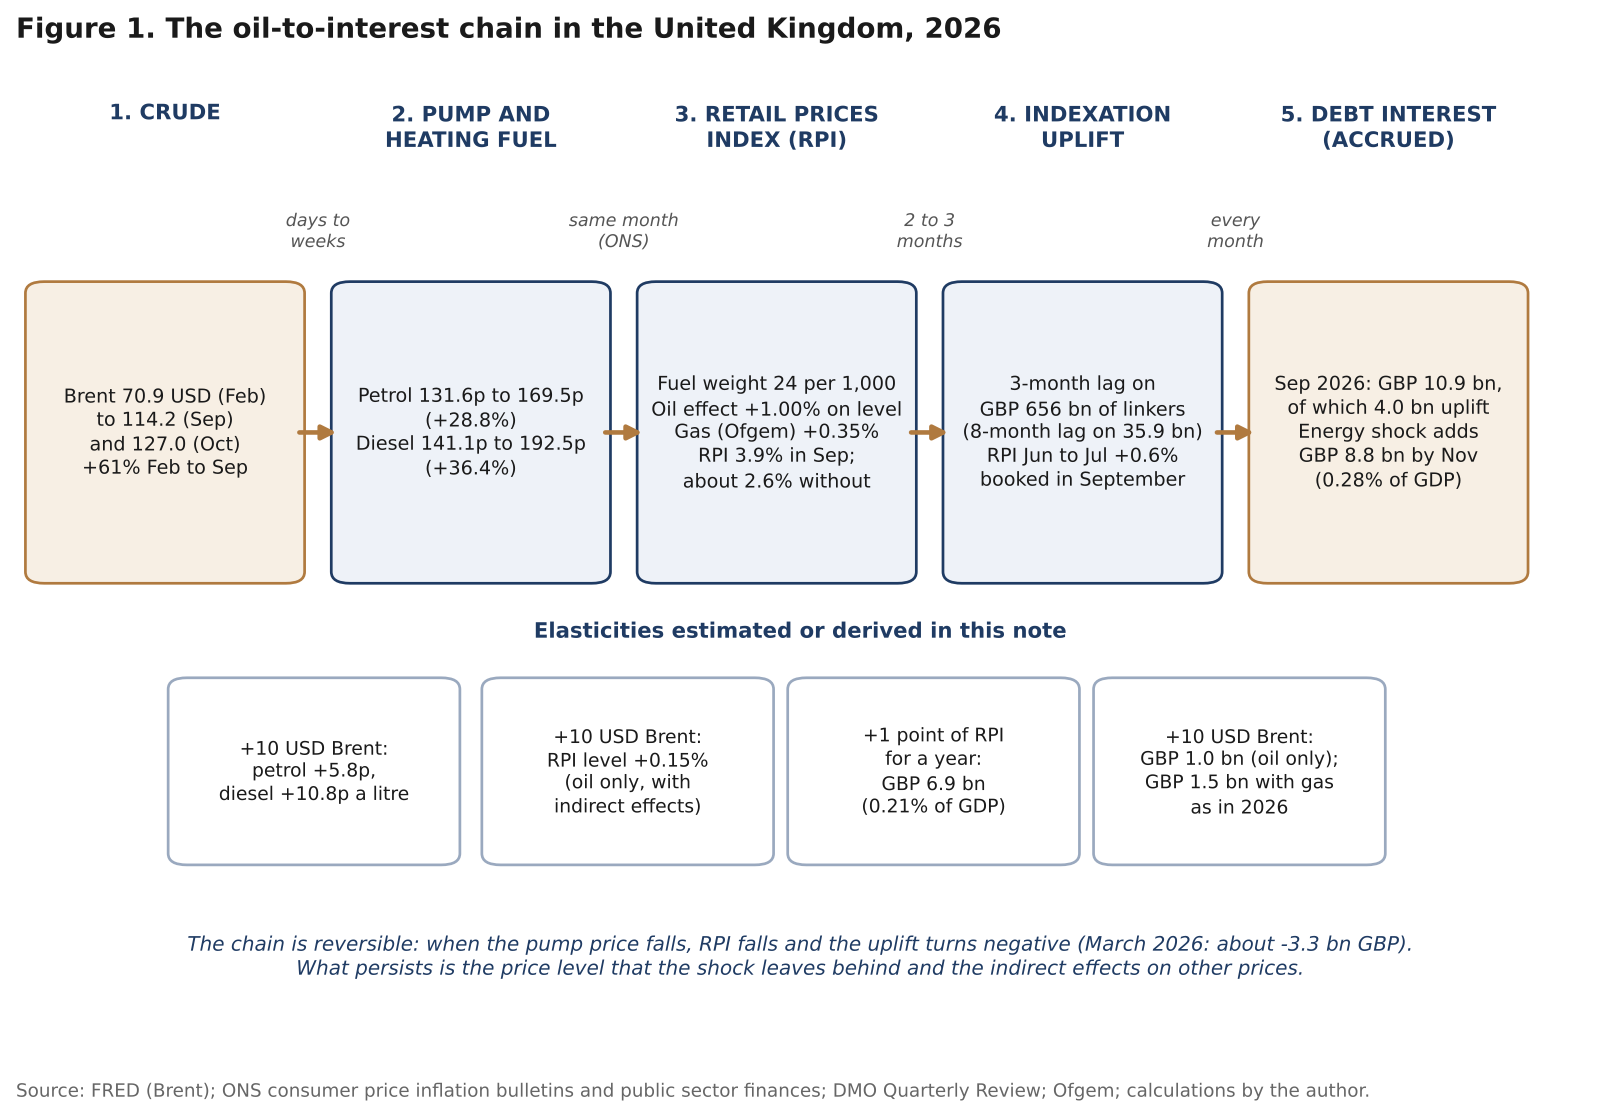
2. The oil-to-interest chain, measured. Between February and September 2026 Brent rose 61 percent, petrol 28.8 percent and diesel 36.4 percent. Each 10 dollars on Brent added about 5.8 pence a litre to petrol and 10.8 pence to diesel. With the official 2026 RPI weights, oil raised the RPI level by about 1.0 percent and the gas-driven Ofgem cap by about 0.35 percent: RPI inflation was 3.9 percent in September, against about 2.6 percent without the energy shock. The author’s accrual model, which reproduces the ONS uplift of 4.0 billion pounds in September within 0.3 billion, attributes 6.5 billion pounds of the uplift booked from April to November 2026 to oil and 2.3 billion to gas: 8.8 billion, or 0.28 percent of GDP, more than a third of the 23.6 billion pounds of headroom in the March forecast.
3. Same shock, different bill. The energy footprint on the reference indices was similar or larger elsewhere: 1.8 points on euro area and French inflation, 1.5 in Canada and 1.2 in the United States, against 1.35 on the UK RPI. In every country the 2026 shock passed through 1.5 to 2.8 times faster than the 2016 to 2026 average. Yet the indexation cost to the December 2026 accrual is 0.28 percent of GDP in the United Kingdom, 0.18 in France, 0.08 in the United States, 0.03 in Canada and 0.02 in Germany. France is the underestimated case: two-thirds of the British cost relative to GDP.
4. The bill is front-loaded and partly reversible. In four scenarios with explicit probabilities, the energy shock adds 8.4 to 17.5 billion pounds to linker costs in 2026-27 (probability-weighted 12.3 billion, 0.38 percent of GDP). As energy prices ease, 44 percent of that is reversed in 2027-28, leaving a two-year net cost of 6.8 billion. The author projects RPI inflation near 4.5 percent in the fourth quarter of 2026 and a peak in January 2027 (5.5 percent in the central scenario, 6.2 percent if the conflict escalates).
5. Cutting linker issuance is the wrong lever. In the author’s cost-risk simulation, cutting the linker share of gilt sales from the 9.3 percent of the 2026-27 remit to 5 percent lowers the 95th-percentile debt interest cost in year five by only 0.03 point of GDP, for an expected cost of 0.015 point; even no new linkers would leave a 12.4 percent share in 2035. The larger lever is already legislated: the alignment of the RPI with CPIH in February 2030 lowers indexation by about 5.6 billion pounds a year, 39 billion over 2030 to 2035. Until then, the United Kingdom has 40 months of full RPI exposure to an oil market at war.
1. Introduction: a meter on the gilt bill
Most governments pay for an oil shock indirectly and late: through weaker growth, lower receipts and, if central banks react, higher interest rates on new borrowing. Governments that have issued inflation-linked bonds pay a part of it directly and early. Their bonds promise a real return, so the principal is revalued with consumer prices, and national accounts record that revaluation as interest as it accrues. An oil shock therefore runs a meter on the debt interest bill, with a delay set by the indexation lag of the bonds.
In 2026 that meter has been running fast. The war in the Middle East that broke out on 28 February disrupted the Strait of Hormuz. Brent averaged 70.9 dollars a barrel in February, 117.3 in April, 83.8 in July during a lull in the fighting, then 114.2 in September and 127.0 in October. In the United Kingdom, central government debt interest reached 10.9 billion pounds in September 2026, the highest September since monthly records began in 1997, of which 4.0 billion was the capital uplift on index-linked gilts, driven, in the words of the ONS, mainly by a 0.6 percent increase in the RPI between June and July. Over April to September debt interest was 60.8 billion pounds, 3.8 billion above the OBR’s March forecast.
This note asks three questions. How exactly does a fuel price become a fiscal cost, and how much has the 2026 shock added? Why is the cost so much larger in the United Kingdom than in four comparable countries, given that the shock to prices was not? And should the United Kingdom respond by issuing fewer linkers, or does the RPI reform scheduled for 2030 change the calculus? It does not repeat the analysis of Decoded No. 1, which compared how fast the 2026 rise in yields reaches budgets through bills, reserves, maturities and indexed debt. Here the subject is the inflation channel alone, traced from the barrel to the accounts.
Section 2 describes the five linker markets. Section 3 builds the oil-to-interest chain for the United Kingdom and Section 4 measures what the 2026 shock has added. Section 5 compares the five countries and Section 6 gives sensitivity tables. Section 7 quantifies the 2030 cliff, Section 8 the issuance debate and Section 9 scenarios to 2028. A dashboard, implications and a dated watch list close the note.
2. Five linker markets in 2026
2.1 Stocks and shares
The five countries use the same instrument for different reasons and on very different scales. Table 1 sets out the 2026 picture from the debt managers’ own statistics.
Table 1. Inflation-linked government debt in five countries, 2026. Stock includes the inflation uplift. Shares are of marketable debt as defined by each debt manager (UK: gilts; France: negotiable state debt; United States: marketable Treasury securities; Germany: federal securities, year-end 2026 projection; Canada: market debt, 2025-26 estimate). GDP in local currency is the author’s estimate described in the methodology notes. Sources: DMO Quarterly Review April to June 2026; Agence France Tresor monthly bulletin, August 2026; US Treasury Monthly Statement of the Public Debt, 30 September 2026; Deutsche Finanzagentur; Bank of Canada; Department of Finance Canada; calculations by the author.
| Country | Instrument and index | Stock, bn (local) | Share of debt | Stock, % of GDP | Indexation lag | Issuance status | Cost of 1 point of inflation for a year |
|---|---|---|---|---|---|---|---|
| United Kingdom | Index-linked gilts, RPI | 686.8 GBP | 23.8% | 21.5% | 3 months (8 months on 5% of stock) | Active: 9.3% of 2026-27 gilt sales | 6.87 bn GBP (0.21% of GDP) |
| France | OATi (French CPI ex tobacco), OAT€i (euro area HICP ex tobacco) | 313 EUR | 10.9% | 10.2% | 3 months | Active | 3.13 bn EUR (0.10%) |
| United States | TIPS, CPI-U | 2,170 USD | 6.8% | 6.6% | 3 months | Active | 21.7 bn USD (0.07%) |
| Germany | Bund/€i, euro area HICP ex tobacco | about 61 EUR (47.05 nominal) | 2.9% | 1.3% | 3 months | No issuance since 2024 | 0.61 bn EUR (0.01%) |
| Canada | Real Return Bonds, CPI | about 74 CAD | 4.6% | 2.2% | 3 months | Stopped November 2022 | 0.74 bn CAD (0.02%) |
The United Kingdom stands apart. At the end of June 2026 the DMO’s gilt portfolio held 691.9 billion pounds of index-linked gilts in gross terms (686.8 billion net of the DMO’s own holdings) out of 2,908 billion of gilts, 23.8 percent; including Treasury bills the net share is 24.4 percent. Relative to GDP, the British stock, 21.5 percent, is larger than the four others combined, 20.3 percent. Fitch Ratings noted in 2023 that the British share of index-linked debt was about double Italy’s, the second-highest among the advanced economies it compared. Index-linked gilts are also long: their average maturity is 16.7 years against 13.0 years for the whole debt portfolio, so the exposure cannot be run off quickly.
France holds the second position. At the end of July 2026, indexed bonds made up 313 billion euros of a negotiable debt of 2,882 billion euros, 10.9 percent. The thirteen OAT€i lines, indexed to euro area inflation, total 186.7 billion euros, about three-fifths of the indexed stock; the rest are OATi indexed to French inflation. The United States has the largest stock in absolute terms, 2.17 trillion dollars of TIPS at the end of September 2026, but only 6.8 percent of 31.83 trillion dollars of marketable debt.
Germany and Canada have left the market. The German Finance Agency announced on 22 November 2023 that from 2024 it would issue no new inflation-linked securities and reopen none; three Bund/€i lines remain, 47.05 billion euros in nominal terms, about 61 billion with the author’s estimate of their uplift. Canada ceased Real Return Bond issuance “effective immediately” in its Fall Economic Statement of 3 November 2022, citing low demand. The Bank of Canada recorded 71.2 billion Canadian dollars of inflation-adjusted RRBs in February 2025; rolled forward with the CPI, about 74 billion, 4.6 percent of market debt.
2.2 A policy that has already changed course
The British share is high because of past choices, and those choices have already been partly reversed. In the five years before 2018-19, index-linked gilts made up around 25 percent of annual gilt issuance. At Budget 2018 the government decided to reduce index-linked issuance “in a measured fashion over the medium term” to lower the inflation exposure of the debt. In 2025-26 index-linked sales were 31.1 billion pounds, 10.2 percent of gilt sales of 303.9 billion. The 2026-27 remit, published on 3 March 2026, plans 23.5 billion of index-linked gilts out of 252.1 billion, 9.3 percent, with a further 30.5 billion unallocated that can go to any type of gilt. Demand has not been the constraint: index-linked auctions were covered 3.46 times on average in 2025-26, against 3.28 times in 2024-25.
The stock moves slowly in spite of this. The index-linked share of the portfolio, measured by the DMO in uplifted terms, was 25.3 percent in 2025-26 against 25.4 percent a year earlier. The reason is the uplift itself: every year of RPI inflation adds several percent to the principal of the existing stock, which offsets much of the effect of lower issuance.
A first look at the results
The full note goes much further, with original models, scenarios and a dashboard of leading indicators. Two of its 13 charts and diagrams are shown below.
Continue reading
Get the full note: 25 pages, 13 charts and diagrams, 9 tables
This page shows the first part of the note. The full PDF adds: the oil-to-interest chain; how much has the 2026 oil shock added in the United Kingdom?; five countries, one shock; sensitivity tables; the 2030 cliff: what the RPI reform changes; should the DMO cut linker issuance?; scenarios to 2028; leading-indicators dashboard; implications for the Treasury, pension funds and investors.
29 USD, instant PDF download, secure card payment.
Buy the full noteNeed this analysis for your organisation?
We prepare confidential briefings, executive talks and studies on countries, markets and policies, built on the same method as this article.
Request a briefingSupport independent analysis
Our studies are free to read and carry no advertising. If this one was useful, a small contribution helps us publish the next.
Support our workGo further: books by Global Strategy Files

Frequently asked questions
How do oil prices increase UK debt interest?
Through index-linked gilts. Higher crude raises petrol, diesel and heating oil prices, which lift the Retail Prices Index. The principal of index-linked gilts is uplifted with the RPI, and the ONS records that uplift as interest two to three months later. In 2026 oil raised the RPI level by about 1.0 percent and gas by 0.35 percent, adding about 8.8 billion pounds to the uplift booked from April to November.
Why is the UK more exposed to inflation than other G7 countries?
Because of the size of its inflation-linked debt, not the size of its inflation shock. Index-linked gilts are 23.8 percent of the gilt stock and 21.5 percent of GDP, against 10.2 percent of GDP in France, 6.6 in the United States, 2.2 in Canada and 1.3 in Germany. For a similar 2026 energy shock, the indexation cost to December 2026 is 0.28 percent of GDP in the UK, 1.5 times France and 3.5 times the United States.
How much does one point of RPI inflation cost the UK Treasury?
About 6.9 billion pounds in the first year, or 0.21 percent of GDP, on the June 2026 stock of 686.8 billion pounds of index-linked gilts including uplift. That is 1.7 times the 4.1 billion pounds in the Office for Budget Responsibility’s 2017 ready reckoner. Each 10 dollars on Brent adds about 1 billion pounds a year through oil alone and about 1.5 billion when gas prices move with oil as in 2026.
What happens to index-linked gilts when the RPI is reformed in 2030?
From February 2030 the RPI will be calculated with the methods and data of CPIH, as the UK Statistics Authority and the Treasury announced in November 2020, without compensation for holders. The OBR projects RPI inflation falling from about 3.0 percent to 2.3 percent as a result. On a projected stock of about 802 billion pounds, that lowers annual indexation by about 5.6 billion pounds, roughly 39 billion over 2030 to 2035.
Sources
- Office for National Statistics, “Consumer price inflation, UK: September 2026”, 21 October 2026, and the bulletins for March, June and July 2026; ONS time series CHAW (RPI all items index), D7G7, DKO8, D7G8, and RPI weights DOHB and CZXN.
- Office for National Statistics, “Public sector finances, UK: September 2026”, 21 October 2026.
- Office for National Statistics, “The calculation of interest payable on government gilts”, methodology.
- UK Debt Management Office, Quarterly Review, January to March 2025, July to September 2025, October to December 2025, January to March 2026 and April to June 2026.
- UK Debt Management Office, “Financing Remit Announcement 2026-27”, 3 March 2026, and Gilt Market Annual Review 2025-26.
- HM Treasury and UK Statistics Authority, “Response to the joint consultation on reforming the methodology of the Retail Prices Index”, 25 November 2020.
- Office for Budget Responsibility, Economic and fiscal outlook, November 2025; Fiscal risks and sustainability, July 2025; “Outlook for debt interest spending” (ready reckoner, March 2017 forecast); box “The sensitivity of debt interest spending”, November 2020; OBR monthly public finances commentary, 19 June 2026.
- Spring Forecast 2026 (OBR, March 2026), as reported by ICAEW and EY UK Pre-Budget Fiscal Outlook, 5 October 2026.
- Ofgem, “Energy price cap will rise by 13% from July”, 27 May 2026, and “Energy price cap will rise by 4% from October 2026”, 26 August 2026.
- Agence France Tresor, Monthly bulletin No. 435, August 2026; list of OAT€i lines (AFT data, October 2026).
- US Treasury, Monthly Statement of the Public Debt, 30 September 2026 (via Treasury Fiscal Data); Bureau of Labor Statistics, “Consumer Price Index, September 2026”, 14 October 2026.
- Deutsche Finanzagentur, “Federal government discontinues programme for inflation-linked bonds”, press release, 22 November 2023; inflation-linked federal securities page; Investor Presentation, October 2026; Gesetz zur Errichtung eines Sondervermogens “Vorsorge fur Schlusszahlungen fur inflationsindexierte Bundeswertpapiere”.
- Department of Finance Canada, Fall Economic Statement 2022, Annex 2 (3 November 2022); Spring Economic Update 2026, Annex 3 (Debt management strategy); Bank of Canada, Government of Canada treasury bills and bonds outstanding, 28 February 2025.
- INSEE, Insee Premiere No. 2105, May 2026 (GDP 2025); Destatis, press release No. 017, 15 January 2026.
- IMF, World Economic Outlook and Fiscal Monitor, October 2026 (DataMapper).
- FRED: DCOILBRENTEU, CPIAUCSL, CPILFESL, T5YIE. Bank of England Database: IUMABEDR, IUMBV34, CFMHSDE. Bank of Canada Valet: V41690973, V41693242, STATIC_TOTALCPICHANGE. Eurostat HICP (prc_hicp_minr): France, Germany, euro area, total, core and energy.
- Bank of England, Monetary Policy Committee dates for 2026 and 2027; Federal Reserve, FOMC meeting calendars 2026 and 2027; ECB Governing Council calendar.
- Fitch Ratings, as reported by CNN, “Why inflation makes Britain’s debt the costliest among rich economies”, 22 August 2023.
- Gateley, “UKSA’s RPI reform will go ahead from 2030 with no compensation for index-linked gilt holders”, 26 November 2020 (estimates of the Pensions Policy Institute and Association of British Insurers).
- Evelyn Partners, “Autumn Budget 2026: the key dates and signals to watch”, 2026; Pensions Age, “Chancellor confirms first Budget will be held on 28 October”, 2026.
- Global Strategy Files, Decoded No. 1, “Five Bond Markets, One Shock”, and Decoded No. 3, “Oil Shock, Not Yet a Wage Shock”, 2026.
- Data retrieved on or before 24 October 2026; data files fetched on 20 October 2026.
Books from Global Strategy Files
Go further on this topic


