
The Great Labour Divergence: Why US Unemployment Stays Low While Canada, Britain, France and Germany Slacken

Driss EFFINA, PhD Independent Researcher, Global Strategy Files Decoded, analysis note No. 11, 24 October 2026. Reading time: about 55 minutes
Key takeaways
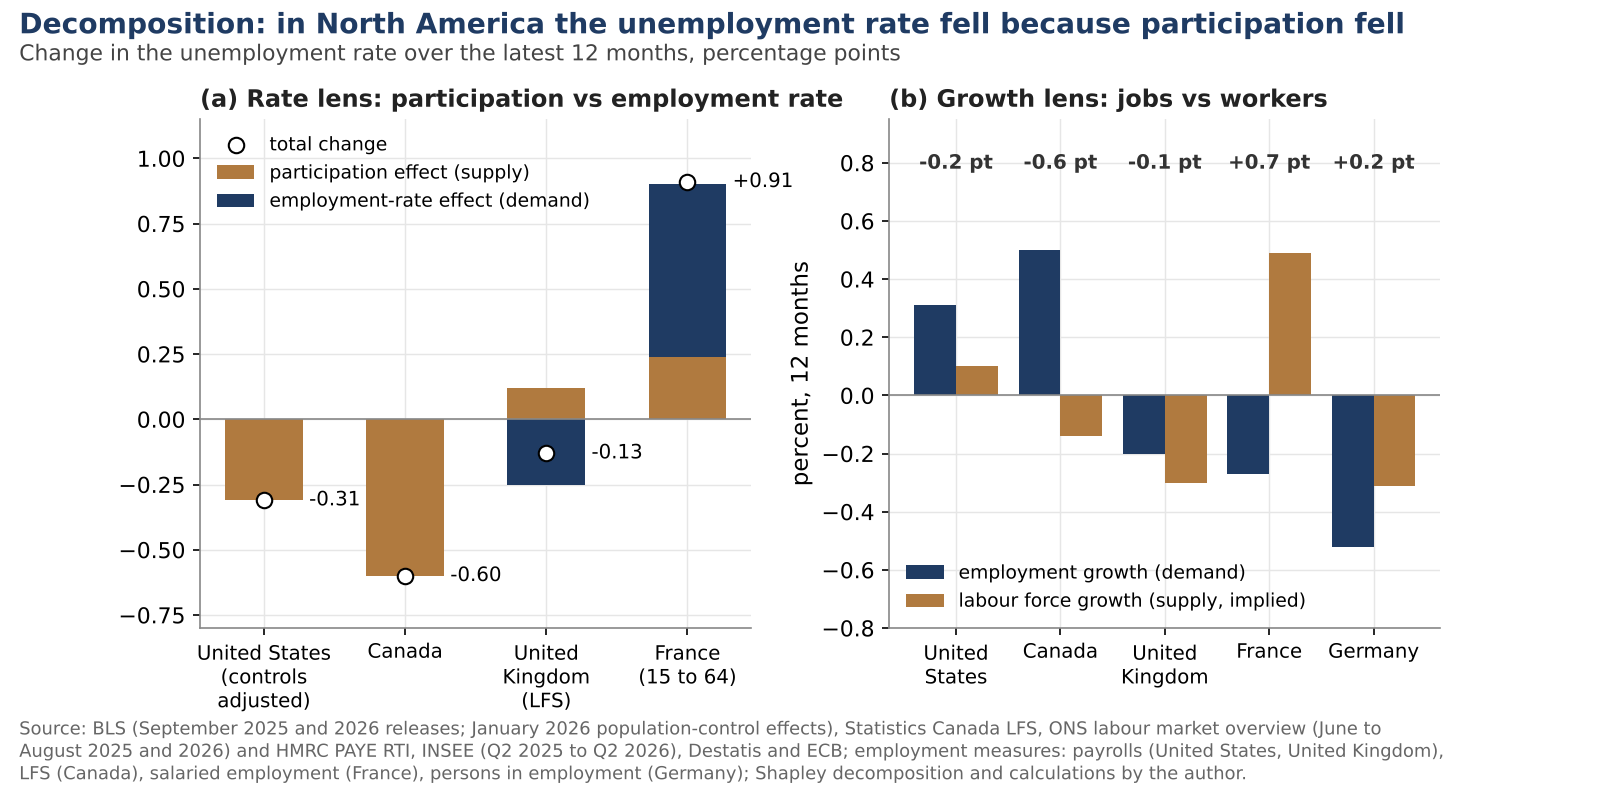
- The fall in US and Canadian unemployment over the past year came entirely from lower participation: adjusted for population controls, the US employment rate was unchanged at 59.7 percent and Canada’s at 60.6 percent.
- Had US net immigration followed CBO’s January 2025 projection, the labour force would be about 1.3 million larger and unemployment 4.5 to 5.0 percent rather than 4.2 percent.
- European slack is demand-led: German industrial jobs fell 2.0 percent while a shrinking labour force absorbed three-fifths of the job losses; French unemployment rose with falling jobs and rising participation.
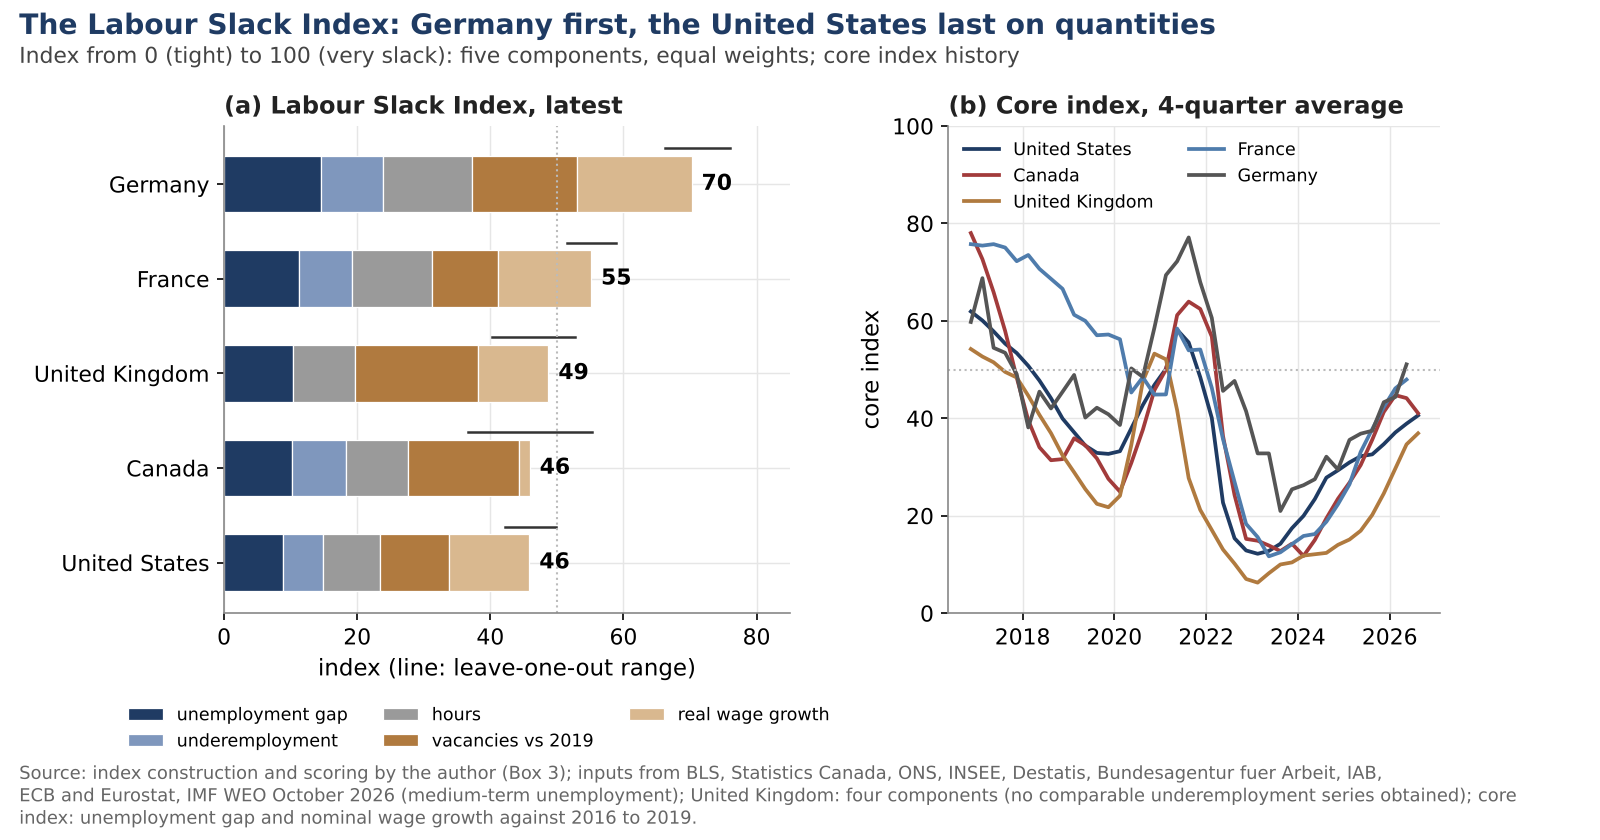
- The author’s Labour Slack Index puts Germany at 70, France at 55, the United Kingdom at 49 and Canada and the United States at 46; probability-weighted scenarios see the divergence narrowing from the American side by end-2027.
Abstract
In the autumn of 2026 five large labour markets tell different stories. US unemployment is 4.2 percent in September, below its 4.5 percent high of November 2025. Canada’s has fallen from 7.1 to 6.5 percent in a year and the United Kingdom’s from 5.2 to 4.7 percent. France’s has risen to 8.3 percent, its highest since the third quarter of 2020, and Germany’s to 4.0 percent, a full point above its 2023 low. The usual reading is a strong American labour market against weak ones elsewhere. This note tests that reading and finds it mostly wrong. It decomposes each change in unemployment into labour supply (population, migration, participation) and labour demand, places each market on its Beveridge curve, estimates an Okun’s law whose speed limit moves with the working-age population, maps sectors and builds an original Labour Slack Index. The resilience of the US unemployment rate is above all a supply story: net immigration fell from 2.3 million people in 2024 to 0.41 million in 2025, payrolls have grown by only 41,000 a month and the employment rate has not risen. Canada’s improvement is entirely a fall in participation. Europe’s slack is demand-led, and in Germany a shrinking labour force hides part of it. Scenarios to the end of 2027, a dashboard and a dated calendar complete the analysis.
Keywords: labour market, unemployment, labour supply, immigration, participation, Beveridge curve, Okun’s law, labour hoarding, vacancies, breakeven employment, slack, United States, Canada, United Kingdom, France, Germany
JEL codes: E24, J11, J21, J23, J61, E32
Key findings
1. The divergence is about workers more than jobs. Over the latest twelve months unemployment fell by 0.2 point in the United States and 0.6 point in Canada and rose by 0.7 point in France and 0.2 point in Germany. In North America the whole fall came from lower participation: adjusted for the January 2026 population controls, the US employment rate was unchanged at 59.7 percent, and Canada’s held at 60.6 percent. At constant participation, Canada’s unemployment rate would still be 7.1 percent. 2. Migration did the work of a strong US labour market. Had net immigration followed CBO’s January 2025 projection, the US labour force would be about 1.3 million people larger and, in the author’s counterfactual, unemployment would be 4.5 to 5.0 percent rather than 4.2 percent. Payroll growth of 41,000 a month sits inside a breakeven range of only 15,000 to 87,000. 3. Europe’s slack is demand-led, and German demography hides part of it. German employment fell by 0.5 percent in a year while the labour force shrank by about 0.3 percent: demography absorbed three-fifths of the job losses. Industrial employment is down 2.0 percent and output per hour up 1.5 percent: firms are shedding labour, not hoarding it. In France, rising participation explains about a quarter of the rise in unemployment. 4. Vacancies have normalised everywhere; matching has not. Vacancies are 40 to 51 percent below their 2022 peaks in four of the five economies. US openings are back to their 2019 level but sit 7 percent above the pre-pandemic Beveridge curve. The British market sits 9 percent below its curve, which at current vacancies implies unemployment of 6.0 percent, 1.2 points above the survey rate. 5. Output explains the divergence; a common residual explains the level. In a supply-adjusted Okun’s law, output explains none of the 0.6 point rise in US unemployment from 2023 to 2026, but 0.26 to 0.73 point of the 0.9 to 1.2 point rises elsewhere. A residual of 0.5 to 0.7 point, common to all five, reflects the unwinding of the 2022 overheating. Canada’s stall speed fell from 3.9 percent in 2023 to 2024 to 1.5 percent in 2026. 6. Germany is the slackest market, and the divergence should narrow from the American side. The author’s Labour Slack Index (0 tight, 100 very slack) stands at 70 for Germany, 55 for France, 49 for the United Kingdom and 46 for Canada and the United States; on quantities alone the United States is the tightest (42). In the author’s scenarios, probability-weighted unemployment at the end of 2027 is 4.6 percent in the United States (+0.4 point), 6.8 in Canada, 5.0 in the United Kingdom, 8.5 in France and 4.1 in Germany (+0.1).
1. Introduction
The contrast of 2026 is usually read through demand: the United States runs a large fiscal deficit, enjoys a data-centre investment boom and grew at 2.5 and 2.2 percent annualised in the first two quarters of 2026, while France stagnated, Germany emerged slowly from three weak years and Canada absorbed new US tariffs.
That reading misses half of the arithmetic. The unemployment rate falls when employment grows faster than the labour force, and it falls just as surely when the labour force stops growing. In 2025 and 2026, for the first time in a generation, labour supply moved sharply and in different directions. US net immigration fell by four-fifths. Canada capped temporary residents and its population growth fell from about 3 percent to 0.5 percent. British net migration fell from a peak of 944,000 to 171,000. German net migration almost halved while the baby-boom generation retired. France alone saw its labour supply rise, as older workers stayed in work longer.
Figure 1 sets out the framework. Labour supply depends on the working-age population, which moves with migration and ageing, and on participation. Labour demand depends on output, on whether firms hoard or shed labour, and on the sectoral mix. The change in the unemployment rate is, to a close approximation, labour force growth minus employment growth. The bottom strip previews the conclusion: North America is supply-led, France and Germany demand-led, the United Kingdom mixed.
Section 2 sets out the divergence, Section 3 the supply shock and Section 4 the decomposition of the past twelve months. Section 5 tells the five national stories. Sections 6 to 9 turn to Beveridge curves, Okun’s law and hours, sectors and the Labour Slack Index. Sections 10 to 13 present scenarios, a dashboard, implications and a calendar. Decoded No. 3 used Beveridge curves to show that labour markets were too slack in 2026 for the oil shock to become a wage shock; this note asks a different question, why the slack is distributed so unevenly.
2. The divergence in numbers
All five unemployment rates fell to multi-decade lows in 2022 and early 2023, as reopening demand met constrained supply, and all five then rose (Figure 2). The divergence is in what happened next. The US rate peaked at 4.5 percent in November 2025 and has eased to 4.2 percent. Canada’s peaked at 7.1 percent in August and September 2025 and has fallen to 6.5 percent. The British rate peaked at 5.2 percent around the turn of the year and fell to 4.7 percent in the three months to August 2026. France and Germany have not turned. The monthly French rate reached 8.4 percent in May 2026, and INSEE’s survey put it at 8.3 percent in the second quarter, up 0.7 point in a year. Germany’s rate on the ILO definition has reached 4.0 percent, its highest in a decade outside the pandemic.
Since their 2022 to 2023 lows, unemployment has risen by 0.8 point in the United States, 1.0 to 1.1 points in the United Kingdom, France and Germany, and 1.7 points in Canada. Since their recent highs it has fallen by 0.3 point in the United States, 0.5 point in the United Kingdom and 0.6 point in Canada, while France is only 0.2 point below its May peak and Germany is at its peak.
Table 1 adds context. Relative to the IMF’s medium-term unemployment rates (the 2031 projections of the October 2026 World Economic Outlook, adjusted for differences between national and IMF series), the gap is 0.3 point in the United States and the United Kingdom, 0.5 point in Canada, 0.7 point in France and 1.2 points in Germany. It also shows that employment growth is weak or negative almost everywhere: the economies with falling unemployment are not those with the fastest job growth.
Table 1. Five labour markets in October 2026. Sources: BLS, Statistics Canada, ONS and HMRC, INSEE, Destatis, ECB and Eurostat, IMF WEO October 2026; calculations by the author.
| United States | Canada | United Kingdom | France | Germany | |
|---|---|---|---|---|---|
| Unemployment rate, latest | 4.2% (Sep) | 6.5% (Sep) | 4.7% (Jun to Aug) | 8.3% (Q2) | 4.0% (Aug) |
| Change over 12 months, points | -0.2 | -0.6 | -0.1 | +0.7 | +0.2 |
| Difference from 2019 average, points | +0.52 | +0.82 | +0.85 | -0.26 | +1.05 |
| Gap to IMF medium-term rate, points | +0.3 | +0.5 | +0.3 | +0.7 | +1.2 |
| Employment growth, 12 months | +0.3% (payrolls) | +0.5% (LFS) | -0.2% (payrolls) | -0.3% (salaried) | -0.5% (persons employed) |
| Participation | 61.8% (16+) | 64.8% (15+) | 79.1% (16 to 64) | 75.4% (15 to 64) | n.a. |
| Vacancies relative to 2019 | -1% | -20% | -15% | about level | -17% |
| Wage growth, latest | 3.0% (hourly earnings) | 3.2% (weekly earnings) | 3.7% (regular pay) | 2.1% (labour cost index) | 2.9% (labour cost index) |
A first look at the results
The full note goes much further, with original models, scenarios and a dashboard of leading indicators. Two of its 14 charts and diagrams are shown below.
Continue reading
Get the full note: 28 pages, 14 charts and diagrams, 16 tables
This page shows the first part of the note. The full PDF adds: the supply shock: migration and demography; supply or demand? Decomposing the last twelve months; five national stories; beveridge curves: where each market sits; okun's law with a moving speed limit; sectoral divergence; a Labour Slack Index; scenarios to the end of 2027; leading-indicators dashboard.
29 USD, instant PDF download, secure card payment.
Buy the full noteNeed this analysis for your organisation?
We prepare confidential briefings, executive talks and studies on countries, markets and policies, built on the same method as this article.
Request a briefingSupport independent analysis
Our studies are free to read and carry no advertising. If this one was useful, a small contribution helps us publish the next.
Support our workGo further: books by Global Strategy Files

Frequently asked questions
Why is US unemployment low in 2026 despite weak job growth?
Because labour supply stopped growing. CBO estimates net immigration fell from 2.3 million in 2024 to 410,000 in 2025, and participation fell. Payrolls grew by only 41,000 a month in the year to September 2026, but the St. Louis Fed puts the breakeven pace that keeps unemployment stable at just 15,000 to 87,000 jobs a month, so a weak hiring pace was enough to hold unemployment at about 4.2 percent.
Why did Canada’s unemployment rate fall in 2026?
Canada’s unemployment rate fell from 7.1 to 6.5 percent between September 2025 and September 2026 because participation dropped from about 65.2 to 64.8 percent, its lowest since 1997 outside the pandemic. The employment rate stayed at 60.6 percent and the job-finding rate fell to 30.6 percent. At constant participation, unemployment would still be 7.1 percent, which points to hidden slack.
Is the UK labour market tighter or looser than it looks?
Looser. The survey unemployment rate fell to 4.7 percent, but payrolled employees fell by 66,000 over the year and vacancies dropped to 691,000, the lowest since the pandemic. The survey implies employment growth about one point higher than tax records. On its pre-pandemic Beveridge curve, today’s vacancies are consistent with unemployment of about 6 percent.
Is Germany hoarding labour as in 2009 and 2020?
No. In the year to the second quarter of 2026 German output rose 1.0 percent while hours fell 0.5 percent, so productivity per hour rose 1.5 percent. Industrial employment fell 2.0 percent and short-time workers dropped to about 118,000. Firms are restructuring rather than hoarding, and a shrinking labour force means unemployment, at 4.0 percent, understates the fall in labour demand.
Sources
- US Bureau of Labor Statistics: The Employment Situation, September 2026 (2 October 2026) and September 2025 (20 November 2025, via Calculated Risk); Job Openings and Labor Turnover, August 2026 (29 September 2026); Productivity and Costs, Second Quarter 2026, Revised (3 September 2026); Population control adjustments to the CPS, January 2026.
- First Trust (2 October 2026), Economic Policy Institute (2 October 2026) and Trading Economics on the September 2026 jobs report and U-6.
- US Bureau of Economic Analysis, GDP (Third Estimate), Second Quarter 2026 (30 September 2026).
- Congressional Budget Office, The Demographic Outlook: 2026 to 2056 (7 January 2026).
- Bick, A., “Breakeven Employment Growth: Estimate Range Widens in 2026” (24 March 2026) and “What’s Behind the Sharp Drop in Labor Force Participation?” (4 August 2026), Federal Reserve Bank of St. Louis, On the Economy.
- National Foundation for American Policy, “US Labor Force Analysis, January 2025 to June 2026” (July 2026).
- Statistics Canada: Labour Force Survey, September 2026 (9 October 2026, as reported by the Nova Scotia Department of Finance, Desjardins, The Hub and HR Reporter) and September 2025; Job Vacancy and Wage Survey, second quarter 2026 (Advisor.ca, HCAMag), 2022 and 2019; quarterly demographic estimates (Global News, Daily Hive, Moving2Canada); labour productivity and GDP, second quarter 2026; BNN Bloomberg (9 October 2026).
- Unifor, Labour Market Indicators, July 2026.
- Immigration, Refugees and Citizenship Canada, 2026 to 2028 Immigration Levels Plan, CIMM briefing (18 November 2025).
- Office for National Statistics: Labour market overview, UK, October 2026 (20 October 2026; Scottish Government, Labour Market Trends) and October 2025 (FE News); PAYE Real Time Information, October 2026; Public sector employment, June 2026; Long-term international migration, year ending December 2025 (21 May 2026); GDP first quarterly estimate and productivity flash estimate, April to June 2026 (The Productivity Institute).
- UK Home Office, changes to the Immigration Rules effective 22 July 2025 (Centuro Global); HM Treasury, Autumn Budget 2024; Professional Pensions, Autumn Budget 2026 date (August 2026).
- INSEE: Chômage au sens du BIT, deuxième trimestre 2026 (7 August 2026); Estimation d’emploi salarié, deuxième trimestre 2026 (28 August 2026); Comptes nationaux trimestriels, deuxième trimestre 2026 and quatrième trimestre 2025; Bilan démographique 2025 (13 January 2026).
- DARES and France Travail, job seekers in the second quarter of 2026 (Club Patrimoine); Unédic, “Comprendre les emplois vacants, les offres non pourvues, les tensions” (5 October 2026); DARES, job vacancies, first quarter 2022 (Actu-Juridique).
- Bundesagentur für Arbeit, Der Arbeitsmarkt im September 2026 (30 September 2026) and Veröffentlichungstermine 2026.
- Destatis: Erwerbstätigkeit im 2. Quartal 2026 (AnwaltOnline); GDP second quarter 2026 (Produktion, 25 August 2026); net migration 2025 (1 June 2026); population 2025 (16 June 2026).
- IAB: Arbeitszeitrechnung, second quarter 2026 (ms-aktuell); job vacancy survey, 2019, 2022 and first quarter 2026 (Abendzeitung, ZfK, dpa-AFX).
- Eurostat, job vacancy statistics, second quarter 2026 (Hellenic Shipping News, Cyprus Mail) and 2021 to 2022 (release of 20 March 2023); DBnomics, teilm310.
- IMF, World Economic Outlook database, October 2026: LUR, NGDP_RPCH (retrieved 20 October 2026). World Bank: SP.POP.1564.TO, SP.POP.TOTL (retrieved 20 October 2026); SL.TLF.CACT.ZS, SL.UEM.1524.ZS (retrieved 23 October 2026).
- Data series: FRED UNRATE, JTSJOL, CES0500000003, ECIWAG, CPIAUCSL, CPILFESL; Statistics Canada v2062815, v79311153; ONS MGSX, AP2Y, KAI9, DKO8; Eurostat lc_lci_r2_q, prc_hicp_minr; Bank of Canada CPI_TRIM, CPI_MEDIAN.
- Global Strategy Files, Decoded No. 3, No. 7 and No. 8 (October 2026), for central bank decisions and meeting calendars.
- Data retrieved on or before 24 October 2026; data files fetched on 20 October 2026.
Books from Global Strategy Files
Go further on this topic


