
The End of Cheap Duration: Long-Term Interest Rate Scenarios to 2035

Driss EFFINA, PhD Independent Researcher, Global Strategy Files Foresight, prospective note No. 6, 24 October 2026. Reading time: about 55 minutes
Key takeaways
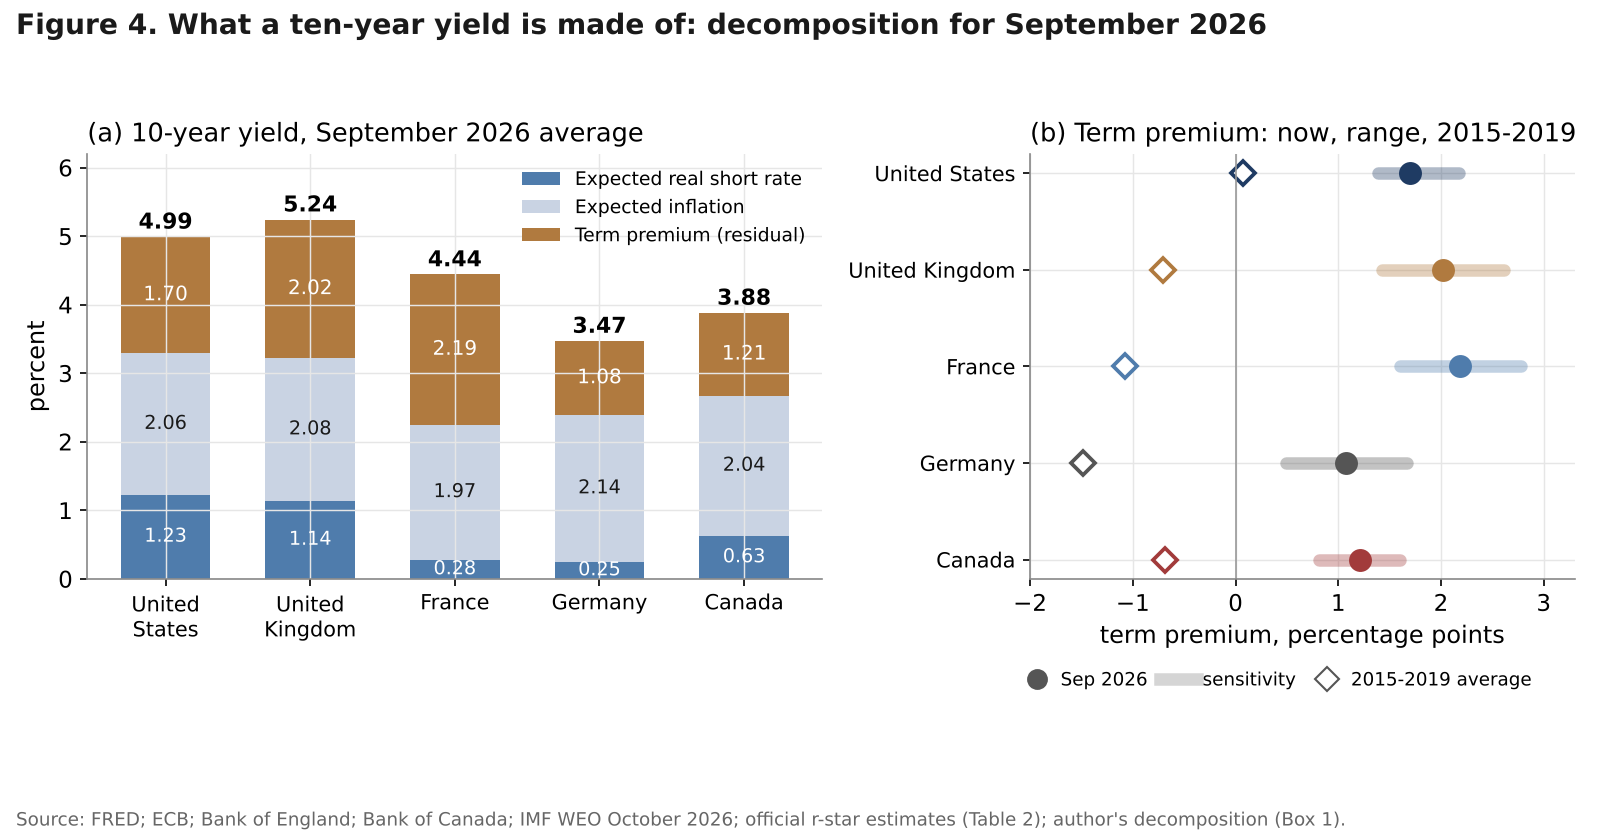
- The term premium, not the neutral rate, ended cheap duration: it now makes up 31 to 49 percent of ten-year yields and has risen by 1.7 to 3.2 points since 2015 to 2019, while official r-star estimates rose by 0.6 points at most.
- The term premium is a global price: one common factor explains 82 percent of its monthly moves in five countries, and deficits raise it mainly when they rise together across the advanced world.
- Higher deficits, AI investment, the energy transition and defence lift the neutral real rate by 27 to 62 basis points by 2035 in the central case; the probability of a return to 2015 to 2019 yields is 4 percent or less.
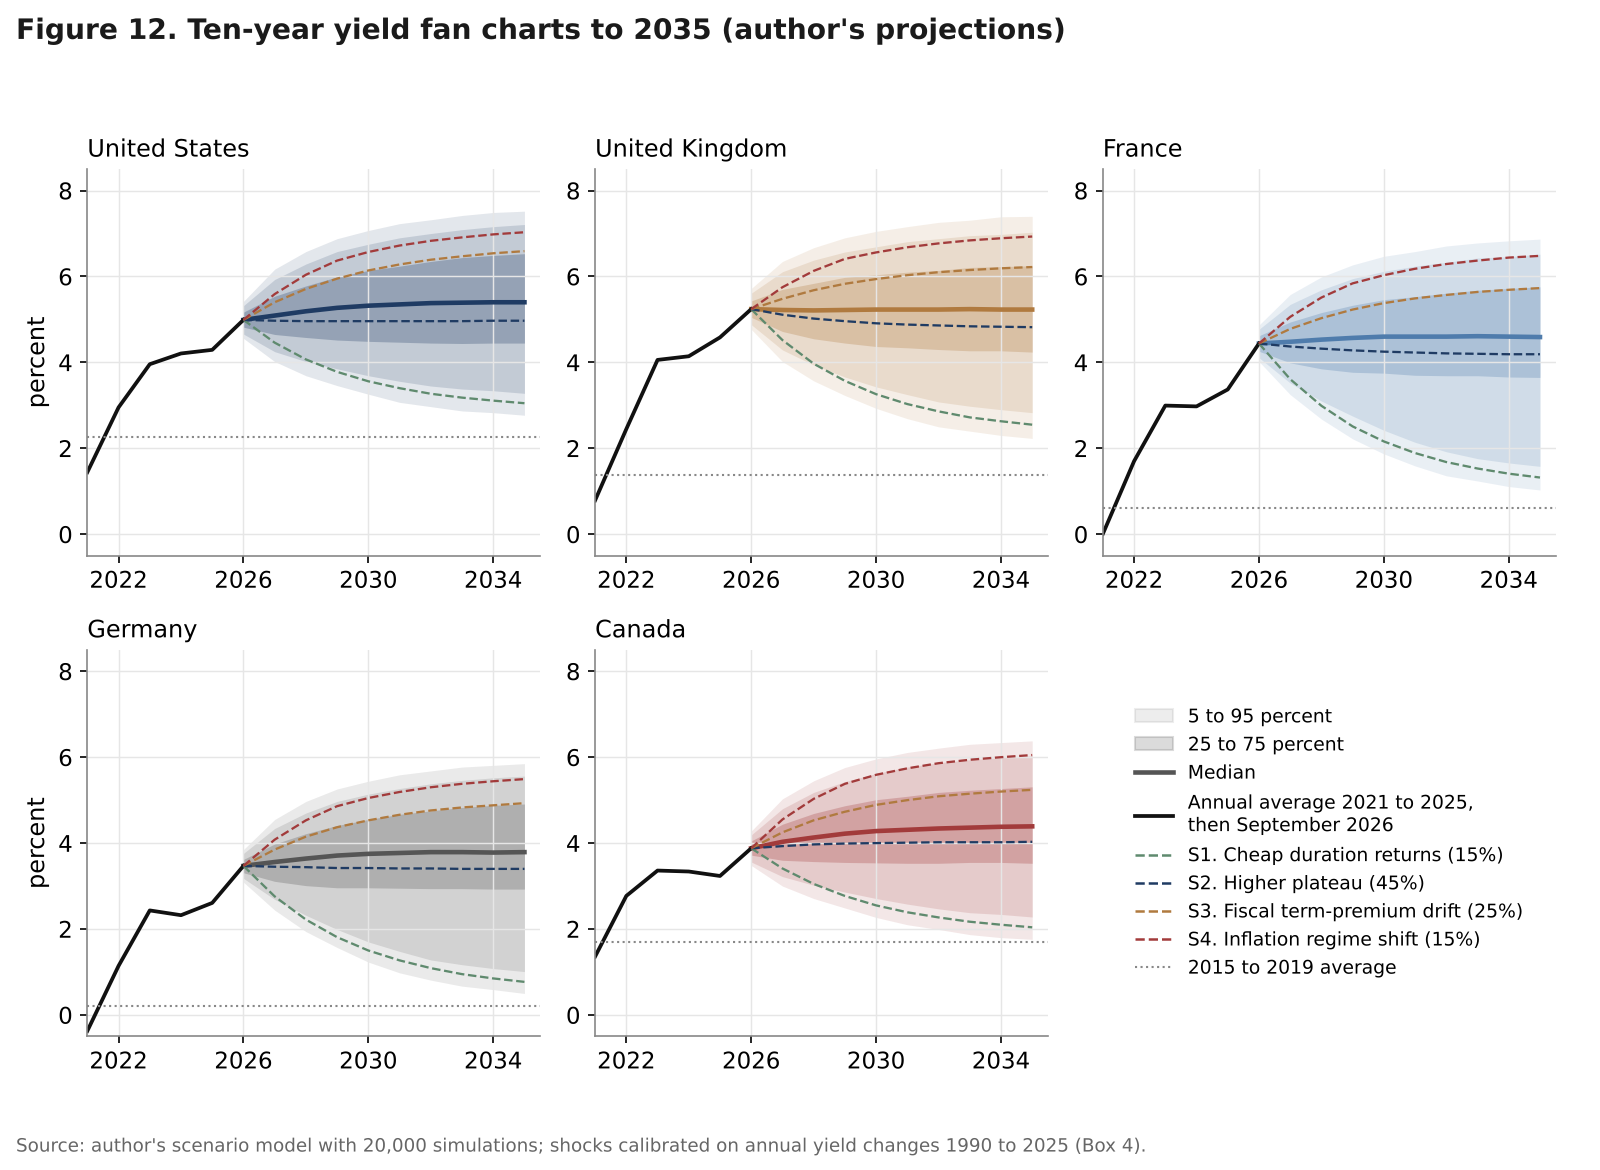
- Probability-weighted ten-year yields in 2035 are 5.4 percent in the United States, 5.2 in the United Kingdom, 4.5 in France, 3.7 in Germany and 4.3 in Canada; the yields that stabilise debt are 1.9 percent in the United States and 2.9 in France.
Abstract
For a decade, governments, home buyers and pension funds could borrow for ten years at rates that barely covered expected inflation: between 2012 and 2021 the German ten-year yield averaged 0.44 percent, the French 0.93 percent and the British 1.49 percent. That era is over. In September 2026 ten-year yields averaged 4.99 percent in the United States, 5.24 percent in the United Kingdom, 4.44 percent in France, 3.47 percent in Germany and 3.88 percent in Canada; for the United Kingdom this was the highest monthly average since 2007, for France since 2008 and for Germany since 2009. The question is not whether rates fall back after the 2026 oil shock, but what level of long rates is structural, and whether public finances can live with it.
This note answers in four steps. It decomposes the ten-year yield of five economies into an expected real short rate anchored on official estimates of the neutral rate (r-star), expected inflation and a term premium, checked against the Federal Reserve Board’s Kim-Wright measure. It identifies the drivers of the term premium with a five-country panel and a pressure matrix. It builds a saving-investment model of the neutral rate to 2035. It then runs four scenarios to 2035 with probabilities and 20,000 simulated paths, and traces their consequences for interest bills, r minus g and a new indicator, the sustainable yield ceiling. All projections are the author’s.
Keywords: long-term interest rates, term premium, neutral rate, r-star, public debt, interest burden, r minus g, scenarios, United States, United Kingdom, France, Germany, Canada
JEL codes: E43, E44, E52, G12, H63
Key findings
1. The term premium, not the neutral rate, ended cheap duration. In September 2026 the estimated term premium was 1.70 points in the United States, 2.02 in the United Kingdom, 2.19 in France, 1.08 in Germany and 1.21 in Canada, 31 to 49 percent of the ten-year yield. Since 2015 to 2019 it has risen by 1.7 to 3.2 points, against 0 to 0.6 points for official r-star estimates. The estimate tracks the Kim-Wright measure (correlation 0.98) and stays positive under every sensitivity tested. 2. The term premium is a global price with a national surcharge. One common factor explains 82 percent of monthly changes in the five term premia. Outside the pandemic years, one point of GDP of deficit is associated with 24 basis points of term premium and one point of debt with 3.7, close to Laubach’s (2009) estimates, but the effect disappears once common year effects are removed: deficits matter mainly because they move together across the advanced world. 3. The neutral rate is more likely to drift up than down by 2035. In the author’s saving-investment model, deficits, AI investment, the energy transition and defence add about 1.7 points of GDP to the demand for saving, against 0.17 points of extra supply from surplus economies. Real r-star rises by 27 basis points in the United Kingdom to 62 in the United States in the central case, within a range from -33 to +109. 4. A return to cheap duration is a tail scenario. The probability-weighted ten-year yield in 2035 is 5.39 percent in the United States, 5.15 in the United Kingdom, 4.49 in France, 3.70 in Germany and 4.33 in Canada. The simulated probability of a return to 2015 to 2019 average yields by 2035 is 4 percent or less everywhere. 5. At these yields, three of five budgets fail the arithmetic. The sustainable yield ceiling, the yield that stabilises debt at the IMF’s 2031 primary balances, is 1.87 percent in the United States, 2.88 percent in France and below zero in Germany, against 5.83 percent in the United Kingdom and 5.92 percent in Canada. In the central scenario American gross interest rises from 4.21 to 6.75 percent of GDP by 2035, about 22 percent of revenue, and r minus g turns positive in four of five countries.
1. Introduction
Between 2012 and 2021 the price of time almost disappeared. A German investor lending to the federal government for ten years received on average less than half a percent a year, and for several years less than nothing. Governments borrowed below the growth rate of their tax base, central banks bought much of what was issued, and the debate on public debt shifted from how much it costs to whether it costs anything at all.
Long rates rose with inflation in 2022, stayed high from 2023 to 2025 and jumped again in 2026, when the war involving Iran that began at the end of February disrupted traffic through the Strait of Hormuz. The monthly average Brent price rose from 70.9 dollars a barrel in February to 114.2 dollars in September and about 127 dollars in October. Between February and September ten-year yields rose by 86 basis points in the United States, 81 in the United Kingdom, 104 in France, 73 in Germany and 59 in Canada. Decoded No. 1 analysed who pays for that shock through debt maturities and refinancing. This note asks a longer question: once the shock fades, where will long rates settle, and is the era of cheap long-term money over for good?
The answer depends on three building blocks: the neutral real rate, r-star, set by the balance between desired saving and investment across the world economy; expected inflation over the life of the bond; and the term premium, the extra return investors demand for holding a long bond rather than rolling over short ones, as compensation for the risk that inflation, policy rates or bond supply turn out differently from expected.
The argument of this note is that the end of cheap duration has so far been an event in the third block more than in the first. Official r-star estimates have moved up modestly since 2019; the term premium has moved up by two to three points. The distinction matters: a higher r-star is slow, global and hard to reverse, while a higher term premium can fall quickly if central banks, budgets and inflation become predictable again, or keep rising if they do not.
Section 2 sets the historical frame. Sections 3 to 5 build the decomposition, the drivers of the term premium and the r-star model. Sections 6 and 7 present the scenarios and their debt-service consequences, and Sections 8 to 11 give country verdicts, a dashboard, implications and a calendar. Figure 1 shows how the parts fit together.
2. Thirty-five years of long rates: what cheap duration was
Long rates in the five economies fell for three decades. In the 1990s the ten-year yield averaged 6.66 percent in the United States, 8.03 percent in the United Kingdom, 7.03 percent in France, 6.62 percent in Germany and 7.62 percent in Canada (Table 1). From 2000 to 2007 the five averages converged between 4.29 and 4.83 percent. After the financial crisis they fell again, and in the decade 2010 to 2019 they ranged from 1.06 percent in Germany to 2.41 percent in the United States.
The period from 2012 to 2021 deserves its name of cheap duration. Annual average ten-year yields were below 2 percent in all ten of those years in Germany, in eight of them in France and the United Kingdom, in seven in Canada and in four in the United States. The low point came in 2019 and 2020. The German ten-year yield averaged -0.65 percent in August 2019 and the French -0.34 percent; in July 2020 the United States yield averaged 0.62 percent, the British 0.21 percent and the Canadian 0.52 percent.
Table 1. Ten-year government bond yields across eras, percent
| Period | United States | United Kingdom | France | Germany | Canada |
|---|---|---|---|---|---|
| 1990 to 1999 average | 6.66 | 8.03 | 7.03 | 6.62 | 7.62 |
| 2000 to 2007 average | 4.71 | 4.81 | 4.37 | 4.29 | 4.83 |
| 2010 to 2019 average | 2.41 | 2.05 | 1.59 | 1.06 | 2.08 |
| 2015 to 2019 average | 2.27 | 1.37 | 0.61 | 0.21 | 1.69 |
| 2012 to 2021 average (cheap duration) | 2.04 | 1.49 | 0.93 | 0.44 | 1.69 |
| 2020 to 2021 average | 1.17 | 0.58 | -0.07 | -0.44 | 1.06 |
| 2023 to 2025 average | 4.15 | 4.26 | 3.11 | 2.45 | 3.31 |
| September 2026 average | 4.99 | 5.24 | 4.44 | 3.47 | 3.88 |
| Latest weekly, 15 to 19 October 2026 | 5.10 | 5.34 | n.a. | 3.49 | 3.84 |
| Years below 2 percent, 2012 to 2021 | 4 | 8 | 8 | 10 | 7 |
Sources: FRED (OECD long-term rates IRLTLT01 series, GS10, DGS10); ECB Data Portal (IRS dataflow); Bank of England; Bank of Canada; Bundesbank zero-coupon yield for the latest German value; calculations by the author.
Three features of the recent rise stand out in Figure 2. First, yields are now above their 2000 to 2007 averages in the United States, the United Kingdom and France; only Germany and Canada remain below them, by 82 and 95 basis points. Second, the gap between ten-year yields and policy rates, negative for most of 2023 and 2024, reached 1.1 to 2.1 points in September 2026 (panel c): investors again demand to be paid for duration. Third, in the United States the 2026 rise has been carried by real yields. Between 27 February and 15 October 2026 the ten-year Treasury yield rose from 3.97 to 5.10 percent, the inflation-indexed yield from 1.72 to 2.78 percent, and breakeven inflation only from 2.25 to 2.35 percent (panel d). The oil shock has raised the required return on duration, not only inflation expectations.
The long view corrects a common reading. A ten-year yield of 4 to 5 percent is roughly the norm of the years before 2008; what was unusual was the decade before 2022. The real question is whether anything in the world economy still points back to those lows.
A first look at the results
The full note goes much further, with original models, scenarios and a dashboard of leading indicators. Two of its 14 charts and diagrams are shown below.
Continue reading
Get the full note: 27 pages, 14 charts and diagrams, 14 tables
This page shows the first part of the note. The full PDF adds: decomposing the ten-year yield; what drives the term premium; a saving-investment model of the neutral rate to 2035; four scenarios to 2035; the debt-service consequences; is cheap duration over? A verdict by country; leading indicators dashboard; implications for policy and for investors; what to watch.
29 USD, instant PDF download, secure card payment.
Buy the full noteNeed this analysis for your organisation?
We prepare confidential briefings, executive talks and studies on countries, markets and policies, built on the same method as this article.
Request a briefingSupport independent analysis
Our studies are free to read and carry no advertising. If this one was useful, a small contribution helps us publish the next.
Support our workGo further: books by Global Strategy Files

Frequently asked questions
Is the era of cheap long-term interest rates over?
Very likely. In the author’s four scenarios, the probability that ten-year government yields in the United States, United Kingdom, France, Germany or Canada return to their 2015 to 2019 averages by 2035 is 4 percent or less. Probability-weighted yields in 2035 range from 3.7 percent in Germany to 5.4 percent in the United States, close to today’s levels, because a higher term premium and a slightly higher neutral rate offset lower inflation.
What is the term premium and why has it risen?
The term premium is the extra return investors demand for holding a long bond rather than rolling over short-term ones. Estimated as a residual after expected short rates and expected inflation, it was negative in most countries between 2015 and 2019 and reached 1.1 to 2.2 points in September 2026. Large deficits, central bank balance sheet run-off, inflation uncertainty after two energy shocks and weaker pension demand for long bonds explain the rise.
What level of ten-year yields is sustainable for public debt?
The note computes a sustainable yield ceiling: the yield at which debt stabilises once refinanced, given the IMF’s 2031 primary balances and growth. It is 1.87 percent for the United States, 2.88 percent for France and below zero for Germany, but 5.83 percent for the United Kingdom and 5.92 percent for Canada. Where expected yields exceed the ceiling, debt keeps rising unless primary balances improve.
Will r-star, the neutral interest rate, rise by 2035?
In the author’s saving-investment model, public deficits, AI and data-centre investment, the energy transition and defence add about 1.7 points of GDP to the demand for saving in five advanced economies by 2035, against 0.17 points of extra supply from surplus economies. Real r-star rises by 27 to 62 basis points in the central case, with a plausible range from a fall of 33 to a rise of 109 basis points.
Sources
- Federal Reserve Economic Data (FRED), Federal Reserve Bank of St. Louis: GS10, DGS10, DGS2, DGS30, DFII10, T10YIE, THREEFYTP10 (Kim-Wright term premium, Federal Reserve Board), IRLTLT01USM156N, IRLTLT01GBM156N, IRLTLT01CAM156N, IRLTLT01DEM156N, IRLTLT01USA156N, IRLTLT01CAA156N, IRLTLT01FRA156N, FEDFUNDS, ECBDFR, DCOILBRENTEU, CPIAUCSL, BAMLH0A0HYM2. Retrieved 20 to 24 October 2026.
- European Central Bank, Data Portal, long-term interest rate statistics for convergence purposes (IRS dataflow), ten-year government bond yields, January 2007 to September 2026. Retrieved 21 October 2026.
- Bank of England, Database: IUMABEDR (Bank Rate); nominal gilt yields at 5, 10 and 20 years. Retrieved 20 October 2026.
- Bank of Canada, Valet API: V39079 (target for the overnight rate); benchmark bond yields. Retrieved 20 October 2026.
- Deutsche Bundesbank, zero-coupon yields on listed federal securities, 2, 10 and 30 years. Retrieved 20 October 2026.
- International Monetary Fund, World Economic Outlook and Fiscal Monitor, October 2026 (DataMapper: GGXWDG_NGDP, GGXCNL_NGDP, GGXONLB_G01_GDP_PT, GGR_G01_GDP_PT, NGDP_RPCH, PCPIPCH, NGDPD, BCA_NGDPD); IMF Public Finances in Modern History (interest expense). Retrieved 20 and 21 October 2026.
- Board of Governors of the Federal Reserve System, Summary of Economic Projections, 16 September 2026; FOMC statement, 16 September 2026; FOMC communications related to policy normalization (decision of 29 October 2025 to end the run-off of securities holdings on 1 December 2025).
- Bloomberg Government, “Fed Quells Market Angst With 40 Billion Dollar Monthly Bill Purchases”, December 2025.
- Bank of Canada, Alves, F. and others, “Assessing the US and Canadian neutral rates: 2026 update”, Staff Analytical Paper 2026-21, May 2026; “The Neutral Rate in Canada: 2019 Update”, Staff Analytical Note 2019-11; press release of 29 January 2025 on the end of quantitative tightening.
- Brand, C., Lisack, N. and Mazelis, F., “Natural rate estimates for the euro area: insights, uncertainties and shortcomings”, ECB Economic Bulletin, Issue 1/2025, February 2025.
- Bank of England, Monetary Policy Report, February 2025, Box A, “The long-run equilibrium interest rate”.
- Bank of England, “Asset Purchase Facility: Gilt Sales, Market Notice 17 September 2026”; Monetary Policy Summary, September 2026.
- Holston, K., Laubach, T. and Williams, J. C., “Measuring the Natural Rate of Interest after COVID-19”, Federal Reserve Bank of New York Staff Report 1063, 2023; Federal Reserve Bank of New York, “Measuring the Natural Rate of Interest” (release schedule 2026).
- Williams, J. C., “R-star: A Global Perspective”, ECB Forum on Central Banking, Sintra, 2024.
- Kliesen, K. L., “Comparing the FOMC’s Estimate of R-Star with Alternative Estimates”, Federal Reserve Bank of St. Louis, On the Economy, 4 May 2026.
- Del Negro, M., Elbarmi, E. and Pham, M., “The Post-Pandemic Global R*”, Liberty Street Economics, Federal Reserve Bank of New York, 25 February 2026.
- Laubach, T., “New Evidence on the Interest Rate Effects of Budget Deficits and Debt”, Journal of the European Economic Association, 7(4), 2009.
- Rachel, L. and Smith, T. D., “Secular drivers of the global real interest rate”, Bank of England Staff Working Paper No. 571, 2015.
- Congressional Budget Office, The Budget and Economic Outlook: 2026 to 2036, February 2026, as summarised by the Committee for a Responsible Federal Budget.
- International Energy Agency, World Energy Investment 2026.
- 24/7 Wall St., “Hyperscalers Hit 700 Billion Dollars in 2026 AI Spending Plans”, republished by Yahoo Finance, 1 May 2026.
- NATO, The Hague Summit Declaration, 25 June 2025; International Centre for Defence and Security, “Defence Spending: Who Is Doing What? July 2026”, 9 July 2026.
- ING Think, “Dutch pension reforms are bumping up rates from the long end”, 10 December 2025.
- National Institute of Economic and Social Research, Aikman, D., “Gilts Are Getting Shorter: Does It Matter?”, 6 March 2026.
- United States Department of the Treasury, Quarterly Refunding Statement, August 2026.
- United States Government Accountability Office, GAO-26-107529; UK Debt Management Office, Quarterly Review; Agence France Tresor, Bulletin mensuel; Government of Canada, Debt Management Report 2024-25 (maturity and holder structure, as compiled for Decoded No. 1).
- European Central Bank, press release on monetary policy decisions, 10 September 2026; Bank of England, Monetary Policy Committee dates for 2026; Bank of Canada, schedule for 2026 policy interest rate announcements; ECB, schedule of Governing Council meetings; Federal Reserve, FOMC meeting calendars 2026 and 2027; UK Budget 2026 date (28 October 2026), as reported by Coutts, “Autumn Budget 2026: the key dates to look out for”, August 2026.
Books from Global Strategy Files
Go further on this topic
The Tariff GambleHow America’s trade war is reshaping power, prices and prosperity.24.99 USD, see the book Future-Proofing AmericaEconomic challenges and the road to reform.20 USD, see the book
 Kill KennedyWhat the 2025 declassified files reveal about the machinery of American power.20 USD, see the book
