
Tariffs plus Oil: The Double Cost Shock on North American Supply Chains

Driss EFFINA, PhD Independent Researcher, Global Strategy Files Decoded, analysis note No. 13, 24 October 2026. Reading time: about 55 minutes
Key takeaways
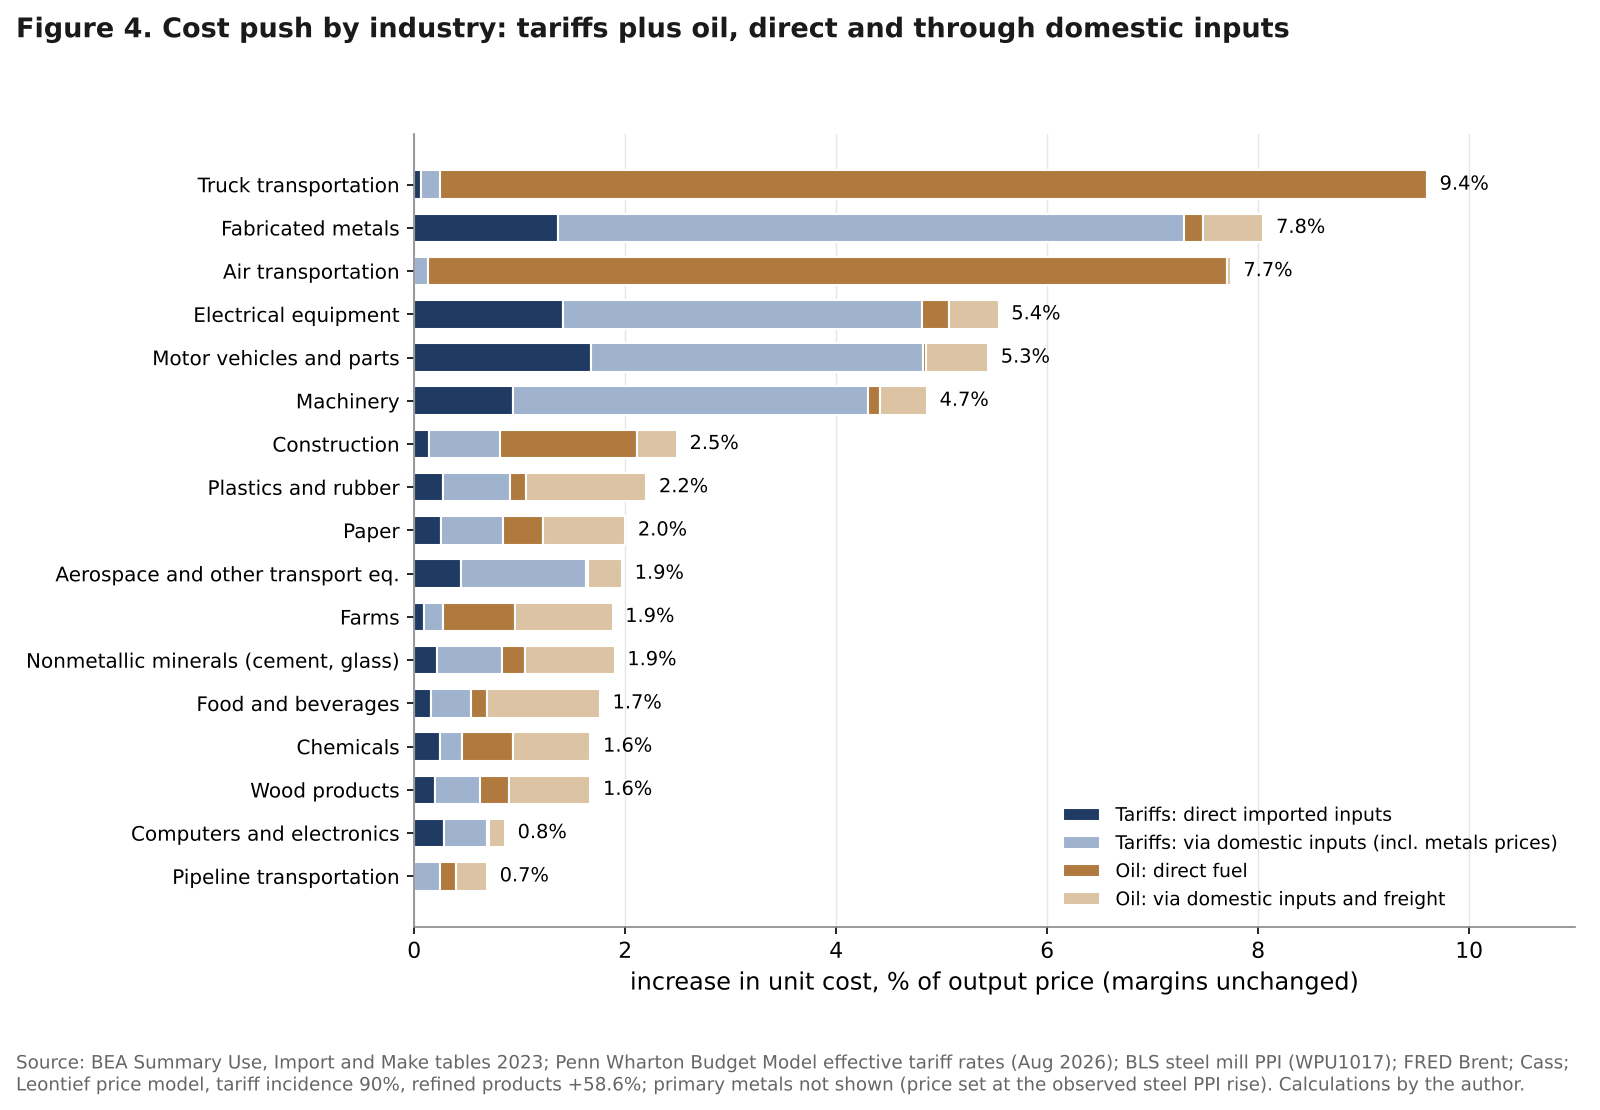
- At October 2026 oil prices and the August 2026 tariff layer, unit costs in US manufacturing outside refining rise by about 4.3 percent, 277 billion dollars a year; tariffs, including higher protected metal prices, are 3.5 points and oil 0.9.
- Autos are the most exposed chain: a 5.3 percent cost push equal to 53 percent of operating surplus, ahead of machinery (4.7 and 27 percent). Chemicals, food processing and construction materials face smaller pushes driven mainly by oil.
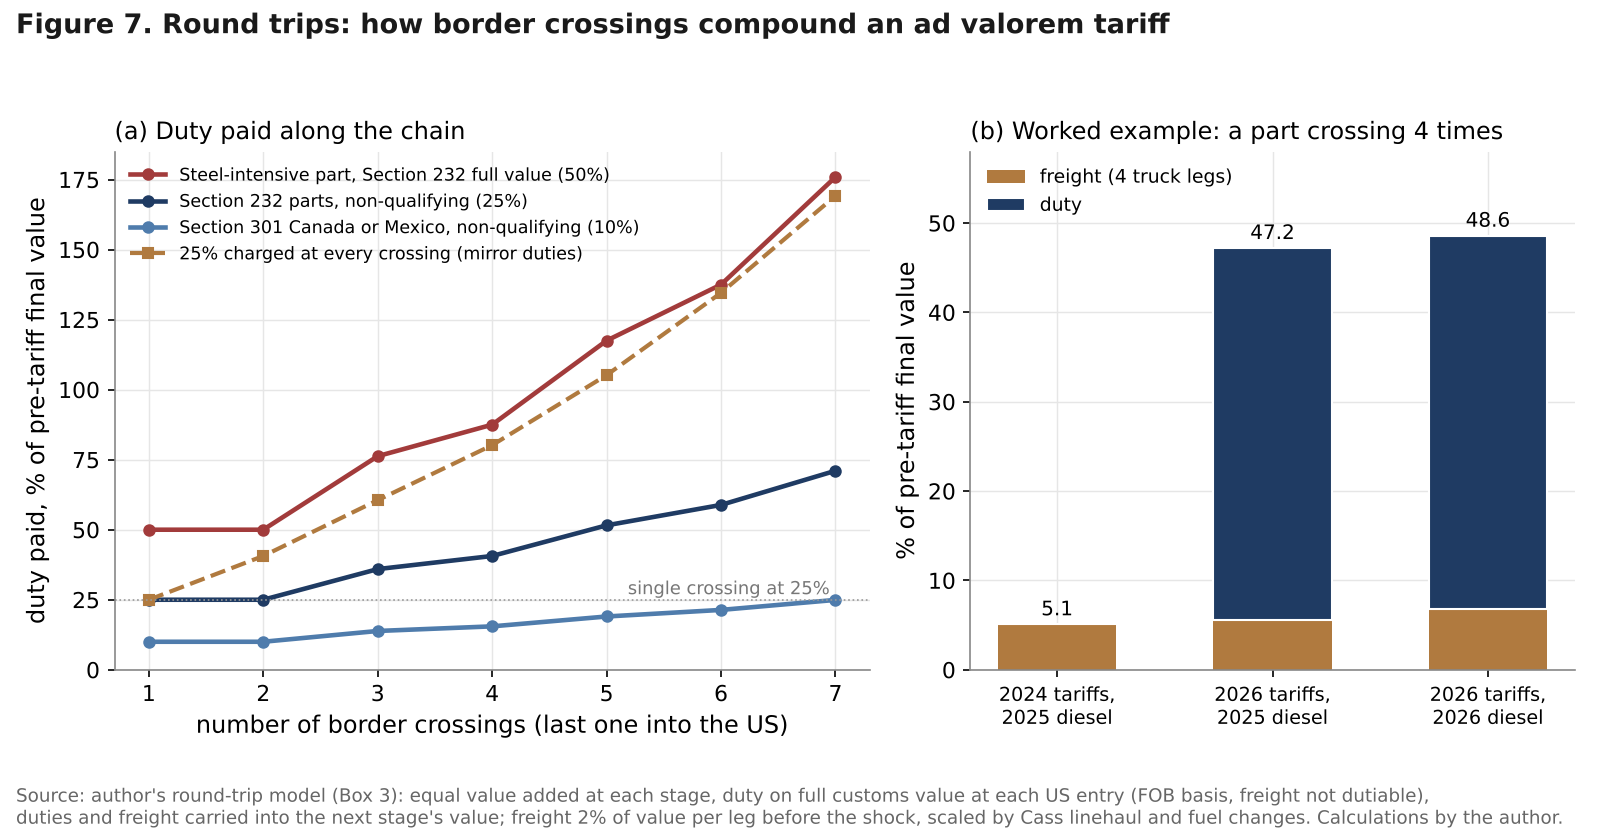
- Duties on full customs value compound across borders: a non-qualifying part crossing four times pays 40.6 percent of its value at a 25 percent rate. So far the auto chain has absorbed about 89 percent of its cost push, while upstream prices rose faster than costs.
- In the author’s scenarios the probability-weighted manufacturing cost push is still 4.0 percent at end-2027 with Brent at 91 dollars, because tariffs are the sticky part; only a North American truce (10 percent) cuts it to about 2.2 percent.
Abstract
North American manufacturers entered the autumn of 2026 with two cost shocks stacked on the same balance sheet. The first is a tariff layer that has been rebuilt three times since February: Section 232 duties on metals, vehicles and parts, Section 301 duties of 10 percent on Canada and Mexico for goods that do not enter under the trade agreement, and, from 22 August, a 50 percent Section 338 duty on a list of Canadian goods. The second is the oil shock that followed the disruption of the Strait of Hormuz: Brent averaged 127 dollars a barrel in October, 84 percent above its 2025 average, and US diesel cost 6.28 dollars a gallon on 19 October, 73 percent more than a year earlier. This note measures the two shocks together, in the units a supply chain manager uses: cost per unit of output, industry by industry, and margin at risk. It builds a Leontief price model on the 2023 input-output tables of the Bureau of Economic Analysis, feeds it the measured 2026 tariff rates, the observed rise in domestic steel prices and the refined-product and freight costs implied by Brent and the Cass freight bills, and compares the result with producer, import and consumer prices for September 2026. Three further tools follow: a model of parts that cross the border several times, an exposure ranking of five supply chains, and four scenarios to the end of 2027 with explicit probabilities. The central result is that the two shocks are not the same kind of problem. In manufacturing, tariffs are four times the size of oil and they are sticky; in transport, construction, farming and food, oil dominates and it is volatile. The automotive chain sits where both meet, and it is absorbing most of the bill in its margins.
Keywords: tariffs, oil prices, input-output, cost push, supply chains, CUSMA, Section 232, pass-through, automotive industry, freight
JEL codes: F13, F14, L62, Q43, E31
Key findings
1. The double shock raises unit costs in US manufacturing outside refining by about 4.3 percent, or 277 billion dollars a year, and tariffs are four-fifths of it. At October 2026 oil prices and the August 2026 tariff layer, the input-output model gives a cost push of 3.5 percent from tariffs (including the rise in protected domestic metal prices) and 0.9 percent from oil. Brent would have to reach about 295 dollars a barrel for oil to cost manufacturing as much as tariffs do. Oil dominates elsewhere: 9.4 percent for trucking, 7.6 percent for air transport, 1.7 percent for construction and 1.6 percent for farms, against tariff pushes below 1 percent.
2. Autos are the most exposed chain, ahead of machinery; chemicals, food and construction materials are oil stories with thick cushions. The combined cost push is 5.3 percent for motor vehicles and parts, equal to 53 percent of the industry’s gross operating surplus, and 4.7 percent for machinery (27 percent of surplus). Fabricated metals, which feed both chains, face the largest single push in manufacturing, 7.8 percent. Chemicals (1.6 percent of costs, 4.5 percent of surplus), food processing (1.7 and 13.3 percent) and construction materials (1.8 and 8.8 percent) are exposed mainly through oil. 37 percent of the tariff push and 77 percent of the oil push reach manufacturers indirectly, through domestic suppliers who never import anything.
3. Round trips turn a 25 percent tariff into a 41 percent one. Because US duties are charged on the full customs value at each entry, a part that does not qualify under the agreement and crosses the border four times pays duty equal to 40.6 percent of its final value, 1.6 times a single crossing, and a steel-intensive part at 50 percent pays 87.5 percent. With mirror duties at every crossing the bill reaches 80 percent. Freight adds a second, smaller compounding: four truck legs cost 5.0 percent of value at 2025 diesel prices and 6.0 percent at 2026 prices. Qualification is the firewall: 70.9 percent of auto parts and 94.7 percent of vehicles from Canada and Mexico claimed it in 2025.
4. Downstream absorbs, upstream passes on. The duty-inclusive cost of an imported vehicle rose by about 12.7 percent in the year to September 2026, while the consumer price of new vehicles rose 0.6 percent: against a modelled cost push of 5.3 percent, the auto chain absorbed about 89 percent. Upstream the opposite holds. Producer prices of materials and components for manufacturing rose 9.6 percent, more than the 6.3 percent the cost model implies; steel mill prices rose 30.6 percent between January 2025 and April 2026; truck freight bills rose 20.4 percent, twice the fuel effect. The 13.4-point gap between intermediate processed goods (14.1 percent) and core consumer goods (0.7 percent) is a margin squeeze in the middle of the chain.
5. The evidence points to disruption more than reshoring, and the tariff layer keeps the shock alive after oil eases. Private manufacturing construction fell 19.8 percent in the year to August 2026, to 168.2 billion dollars a year; vehicle assemblies fell 7.2 percent between May and September; Mexican light-vehicle output fell 15.1 percent in September and German vehicle exports to the United States fell 17.2 percent in the first half. Machinery output rose 6.9 percent. In the author’s scenarios the probability-weighted cost push for manufacturing is still 4.0 percent at the end of 2027 with Brent at 91 dollars, because tariffs make up about 90 percent of what remains; only a North American tariff truce (10 percent probability) cuts it to about 2.2 percent.
1. Introduction: two shocks on one cost base
A tariff and an oil shock look alike on a cost sheet: both raise the price of something a firm buys, both travel along the chain to firms that do not buy it directly, and both end in some mix of higher prices, thinner margins and lower volumes. They differ in almost everything else. Oil prices move every day and fall as fast as they rise; a tariff stays until a legal or political event removes it. Oil reaches every firm through fuel and freight; tariffs fall on what crosses a border, which in North America means a supply chain designed over thirty years to cross borders often.
In 2026 the two arrived together. The tariff layer was rebuilt after the Supreme Court held in February that the International Emergency Economic Powers Act does not authorise tariffs, which ended the broad duties of 2025. What replaced them matters more for North American industry than for most of world trade: sectoral duties under Section 232 that ignore the trade agreement for metals and partly ignore it for vehicles; Section 301 duties of 10 percent on Canadian and Mexican goods that are not entered as qualifying under the agreement; and a 50 percent Section 338 duty, the first use of that 1930 statute, on a list of Canadian goods that does respect qualification. At the same time, the war involving Iran that began at the end of February disrupted the Strait of Hormuz. Brent averaged 70.9 dollars in February, 117 in April, 84 to 85 in June and July, 114 in September and 127 in October. Diesel, the fuel of the trucks that carry parts across the border, reached 6.28 dollars a gallon on 19 October, 2.66 dollars more than a year earlier.
Decoded No. 4 asked who pays for tariffs at the level of the household. This note asks a different question: what the two shocks together do to the cost of making things in North America, where along the chain the cost lands, and who is absorbing it. It works at the level of industries and supply chains, not households, and it treats oil as an equal partner of tariffs rather than as background.
Section 2 describes the two layers in October 2026. Section 3 builds the price model, Section 4 ranks five supply chains and Section 5 models round trips across the border. Section 6 confronts the model with prices, Section 7 looks for reshoring and Section 8 sets out scenarios to the end of 2027. A dashboard, implications and a dated watch list close the note.
2. The two layers in October 2026
2.1 Oil, diesel and freight
Figure 2 sets out the context. Brent spent most of 2025 between 62 and 79 dollars and averaged 69.1 dollars. The disruption of Hormuz lifted it to 103.1 dollars in March and 117.3 in April. A partial retreat in early summer took it to 85.4 dollars in June and 83.8 in July, before a second leg brought it to 114.2 dollars in September and 127.0 in October, 83.7 percent above the 2025 average.
For supply chains the relevant price is not crude but diesel and the freight bill it drives. The weekly survey of the Energy Information Administration put on-highway diesel at 6.276 dollars a gallon on 19 October 2026, against 3.62 dollars a year earlier, a rise of 73.4 percent. Gasoline rose 41.9 percent over the same year, to 4.284 dollars. Regional dispersion is large: diesel cost 7.394 dollars on the West Coast and 5.903 dollars on the Gulf Coast. The Cass Freight Index for September shows what that does to shippers. Shipments rose only 1.9 percent from a year earlier, but freight expenditures rose 20.4 percent. Truckload linehaul rates excluding fuel rose 10.1 percent, so about 9.4 points of the rise in expenditures came from fuel and other surcharges; Cass reported diesel up 68 percent in September.
Producer prices confirm that the shock sits at the top of the chain. Final demand prices rose 1.3 percent in September and 6.3 percent over twelve months; intermediate processed goods were 14.1 percent above their level of a year earlier and unprocessed goods 21.5 percent. The consumer end is calmer. Headline consumer prices rose 3.7 percent in the year to September, with energy up 20.4 percent, but core inflation was 2.6 percent and core goods only 0.7 percent. In Canada, consumer price inflation was 3.1 percent in September. The Federal Reserve’s policy rate averaged 3.75 percent in September and the Bank of Canada’s 2.25 percent in October.
Table 1. The double shock: latest official readings. Sources: EIA (19 October 2026), Cass via FreightWaves (13 October), BLS PPI (15 October), BLS import prices (16 October), BLS CPI (September), Federal Reserve G.17 (16 October), Census Bureau (1 October), Statistics Canada (15 October), INEGI (7 October), Destatis (20 August and 8 October), Penn Wharton Budget Model (14 October). Retrieved 24 October 2026.
| Area | Indicator | Latest | Change |
|---|---|---|---|
| Energy | Brent, monthly average | 127.0 USD (Oct) | +83.7% vs 2025 average |
| Energy | US on-highway diesel | 6.276 USD/gal (19 Oct) | +73.4% y/y |
| Freight | Cass expenditures / linehaul ex fuel | Sep | +20.4% / +10.1% y/y |
| Tariffs | US average effective tariff (measured) | 7.1% (Aug) | 2.3% in Jan 2025 |
| Tariffs | Effective rate, steel and aluminium / vehicles | 39.8% / 13.8% (Aug) | |
| Producer prices | Intermediate processed goods | Sep | +14.1% y/y |
| Producer prices | Materials and components for manufacturing / construction | Sep | +9.6% / +5.7% y/y |
| Import prices (ex duty) | Nonfuel industrial supplies / capital goods / vehicles | Sep | +13.0% / +8.4% / +1.1% y/y |
| Consumer prices | Core goods / new vehicles | Sep | +0.7% / +0.6% y/y |
| US output | Manufacturing / machinery / motor vehicles and parts | Sep | +1.1% / +6.9% / -0.8% y/y |
| US investment | Private manufacturing construction | 168.2 bn USD SAAR (Aug) | -19.8% y/y |
| Canada | Manufacturing sales / volume | 79.9 bn CAD (Aug) | +1.5% / 0.0% m/m |
| Mexico | Light-vehicle production | 301,803 units (Sep) | -15.1% y/y |
| Germany | Vehicle exports to the US | H1 2026 | -17.2% y/y |
2.2 The tariff layer
The layer that North American firms face is the sum of four instruments, summarised in Table 2 and Figure 3.
The first and heaviest is Section 232. Since the proclamation of 2 April 2026, effective 6 April, metal duties apply to the full customs value of covered goods, not only to their metal content, at three tiers: 50 percent for articles made entirely or almost entirely of steel, aluminium or copper, 25 percent for derivatives, and 10 percent for products made with US-melted or US-smelted metal. The duties do not stack with each other, and they offer no relief for goods that qualify under the trade agreement. A temporary 15 percent rate for industrial and grid equipment expires on 1 January 2028. Vehicles have paid 25 percent since April 2025; for qualifying vehicles the duty applies only to non-US content. Parts have paid 25 percent since May 2025, but qualifying parts remain exempt until the Commerce Department sets up a process to tax only their non-US content, which had not been published when the US Trade Representative reported to Congress in July 2026. Automakers that assemble in the United States receive an offset of 3.75 percent of the suggested retail price of their US-assembled vehicles. Medium and heavy trucks have paid 25 percent since November 2025.
The second is Section 301. When the temporary Section 122 surcharge expired at 12:01 a.m. on 24 July 2026, it was replaced by duties on 60 economies found to have failed to enforce bans on imports made with forced labour: 10 percent for 17 economies including Canada, Mexico and the United Kingdom, 10 percent net of the normal duty for the European Union and Taiwan, and 12.5 percent for others. Goods that qualify under the agreement are exempt, and auto parts already subject to Section 232 are excluded. A legal challenge by 25 states is pending at the Court of International Trade.
The third is specific to Canada. Three proclamations signed on 20 July 2026 under Section 338 of the Tariff Act of 1930 imposed a 50 percent duty, effective 22 August after a three-day suspension, on lists covering about 20 billion dollars of 2024 imports, about 5 percent of imports from Canada. The lists answer three Canadian measures: the surtax on US vehicles, the cheese quota and provincial boycotts of US alcohol. The vehicle list has 439 tariff lines worth 19.3 billion dollars, but despite its name it covers furniture, plywood, textiles, paper and other goods; products already under Section 232 were exempt in the original proclamations. Qualification under the agreement does not exempt a good from this duty. Proclamations of 8 September adjusted the lists from 15 September and turned some dairy, alcohol and motorcycle lines into import bans from 29 September. Canada answered on 8 September with counter-tariffs of 15, 25 and 50 percent on 27.6 billion Canadian dollars of US goods, and a support package of 7.5 billion dollars.
The fourth is the frame itself. At the joint review of 1 July 2026, the United States declined to confirm the extension of the agreement for 16 years. The agreement stays in force until July 2036, but it is now reviewed every year, and its preferences can no longer be treated as permanent.
Table 2. The 2026 US tariff layer on North American supply chains. Sources: White & Case (7 April and July 2026); PwC Canada (6 August 2026); USTR, 2026 USMCA Autos Report to Congress (July 2026); Thomson Reuters (10 September 2026); Government of Canada (25 August 2026); Penn Wharton Budget Model (14 October 2026). Retrieved 24 October 2026.
| Instrument | Rate | Coverage | Treatment of qualifying goods | In force |
|---|---|---|---|---|
| Section 232 metals | 50% / 25% / 10% on full value | Steel, aluminium, copper articles and derivatives | No relief | Full-value basis since 6 Apr 2026 |
| Section 232 vehicles | 25% | Passenger vehicles, light trucks | Duty on non-US content only | Since 3 Apr 2025 |
| Section 232 parts | 25% | Auto parts | Exempt pending a non-US content process | Since 3 May 2025 |
| Section 232 trucks | 25% (buses 10%) | Medium and heavy vehicles | Non-US content for vehicles; parts pending | Since 1 Nov 2025 |
| Section 301 | 10% Canada, Mexico | Nearly all goods | Exempt | Since 24 Jul 2026 |
| Section 338 | 50% | About 20 bn USD of Canadian goods (2024) | Not exempt | Since 22 Aug 2026 |
| Measured outcome | 7.1% average; 39.8% metals; 13.8% vehicles | All imports, Aug 2026 | 81.4% of imports from Canada and Mexico claimed the exemption |
What matters for cost is not the statutory schedule but the rate actually paid. The Penn Wharton Budget Model measured an average effective tariff of 7.1 percent in August 2026, against 2.3 percent in January 2025, with 39.8 percent on steel and aluminium and 13.8 percent on vehicles. Before buyers switched suppliers, the same tariffs would have been 10.1 percent; the Yale Budget Lab put the statutory average at 11.0 percent in August. About 126 billion dollars of the 166 billion collected under the struck-down IEEPA duties had been certified for refund by 2 October, a cash flow that eased the margins of importers this autumn but does not change the cost of the current layer.
A first look at the results
The full note goes much further, with original models, scenarios and a dashboard of leading indicators. Two of its 14 charts and diagrams are shown below.
Continue reading
Get the full note: 26 pages, 14 charts and diagrams, 8 tables
This page shows the first part of the note. The full PDF adds: an input-output model of the double shock; ranking the supply chains; round trips: why border crossings compound; margins or prices: the 2025 to 2026 evidence; reshoring or disruption; scenarios to end-2027; leading-indicators dashboard; implications for firms, investors and policy; what to watch.
29 USD, instant PDF download, secure card payment.
Buy the full noteNeed this analysis for your organisation?
We prepare confidential briefings, executive talks and studies on countries, markets and policies, built on the same method as this article.
Request a briefingSupport independent analysis
Our studies are free to read and carry no advertising. If this one was useful, a small contribution helps us publish the next.
Support our workGo further: books by Global Strategy Files

Frequently asked questions
How much do tariffs and oil together raise US manufacturing costs in 2026?
An input-output price model built on the 2023 BEA tables puts the combined cost push for manufacturing outside refining at about 4.3 percent of output, or 277 billion dollars a year, at October 2026 oil prices (Brent 127 dollars) and the August 2026 tariff layer (7.1 percent measured average). Tariffs, including the rise in protected domestic metal prices, account for 3.5 points and oil for 0.9 points.
Which North American supply chains are most exposed to tariffs and oil?
Autos rank first: a 5.3 percent cost push that would consume 53 percent of the industry’s operating surplus if nothing were passed on, with 18 percent of output value in imported goods. Machinery follows with 4.7 percent and 27 percent of surplus. Food processing, chemicals and construction materials face pushes of 1.6 to 1.8 percent, mostly from oil, and have thicker cushions.
Why do tariffs hurt more when parts cross the border several times?
US duties are charged on the full customs value at each entry, including value added and duties paid earlier in the chain. A part that does not qualify under the CUSMA and enters the United States twice in four crossings pays duty equal to 40.6 percent of its final value at a 25 percent rate, and 87.5 percent at the 50 percent metal rate. Qualifying under the agreement removes most of this compounding.
Are US automakers passing tariff and fuel costs on to car buyers?
Mostly not, so far. The duty-inclusive cost of imported vehicles rose about 12.7 percent in the year to September 2026, and the modelled cost push on the domestic chain is 5.3 percent, but the consumer price of new vehicles rose only 0.6 percent. That implies the auto chain absorbed about 89 percent of its cost push in margins, while upstream metals, materials and freight prices rose as fast as costs or faster.
Sources
- Bureau of Economic Analysis, Input-Output Accounts: Summary Use Table (producer prices, before redefinitions), Import Matrix and Make Table, 2023, 2017 schema; as distributed in US EPA, useeior R package, data directory (Summary_Use_2023_PRO_BeforeRedef_17sch, Summary_Import_2023_BeforeRedef_17sch, Summary_Make_2023_BeforeRedef_17sch). Retrieved 24 October 2026.
- Federal Reserve Bank of St. Louis, FRED: DCOILBRENTEU (Brent), CPIAUCSL, CPILFESL, FEDFUNDS. Retrieved 20 October 2026.
- Bank of Canada, Valet API: V39079 (overnight rate target), STATIC_TOTALCPICHANGE (CPI). Retrieved 20 October 2026.
- Eurostat, HICP energy for Germany (DE_HICP_energy_yoy). Retrieved 20 October 2026.
- U.S. Energy Information Administration, Gasoline and Diesel Fuel Update, 20 October 2026 (prices for 19 October 2026).
- U.S. Bureau of Labor Statistics, Producer Price Indexes, September 2026 (15 October 2026), and PPI Detailed Report, September 2026.
- U.S. Bureau of Labor Statistics, U.S. Import and Export Price Indexes, September 2026 (16 October 2026).
- U.S. Bureau of Labor Statistics, Consumer Price Index, September 2026, Table 1.
- U.S. Bureau of Labor Statistics, PPI series WPU1017, Steel mill products, as published by the Montana Department of Transportation, 2026 Steel Prices.
- Board of Governors of the Federal Reserve System, G.17 Industrial Production and Capacity Utilization, 16 October 2026.
- U.S. Census Bureau, Monthly Construction Spending, August 2026, release CB26-158 (1 October 2026).
- Cass Information Systems, Cass Freight Index, September 2026, as reported by FreightWaves, “Cass: TL linehaul rates up 10% in September, shipment counts remain positive” (13 October 2026).
- Penn Wharton Budget Model, Effective Tariff Rates and Revenues (updated 14 October 2026).
- Yale Budget Lab, The State of U.S. Tariffs (24 August 2026).
- Office of the U.S. Trade Representative, 2026 USMCA Autos Report to Congress (July 2026).
- White & Case, “United States modifies steel, aluminum, and copper Section 232 tariffs” (7 April 2026).
- White & Case, “USMCA 2026 Joint Review: United States declines to extend Agreement, triggering annual reviews” (July 2026).
- White & Case, “Trump administration imposes 50% tariffs on certain Canadian products in first use of Section 338” (July 2026).
- PwC Canada, Tax Insights, “USTR imposes final section 301 tariffs on 60 economies: Canada subject to a 10% tariff” (6 August 2026).
- Thomson Reuters ONESOURCE, “US Section 338 duties on Canadian vehicles and parts” (10 September 2026); Zonos, Section 338 Tariffs on Canada (15 September 2026); Strix, Section 338 import ban update (29 September 2026).
- Department of Finance Canada, “Canada announces targeted countermeasures and substantive support for workers and businesses in response to U.S. tariffs” (25 August 2026).
- Statistics Canada, The Daily, Monthly Survey of Manufacturing, August 2026 (15 October 2026).
- INEGI, Registro Administrativo de la Industria Automotriz de Vehiculos Ligeros, Boletin 618/26 (7 October 2026).
- Destatis, Press release No. 296 (20 August 2026) on foreign trade in the first half of 2026, and Press release No. 356 (8 October 2026) on August 2026 exports.
- Supply Chain Dive, “Trump targets EU cars, trucks with 25% tariff” (1 May 2026); Bloomberg Law, “US to adopt 25% car levy soon unless EU clears trade deal” (6 May 2026); Hungarian Chamber of Commerce and Industry, “EU-US trade: Parliament gives its green light to tariff legislation” (19 June 2026).
Books from Global Strategy Files
Go further on this topic
The Tariff GambleHow America’s trade war is reshaping power, prices and prosperity.24.99 USD, see the book The Trump ProphecyPopulism, power and the remaking of US politics.20 USD, see the book
 Kill KennedyWhat the 2025 declassified files reveal about the machinery of American power.20 USD, see the book
