
Profits Up 14 Percent, Household Income Up 1.4 Percent: Who Really Gains from Trump’s Economic Policy

Driss EFFINA, PhD Independent Researcher, Global Strategy Files Decoded, analysis note No. 4, 20 October 2026. Reading time: about 50 minutes
Key takeaways
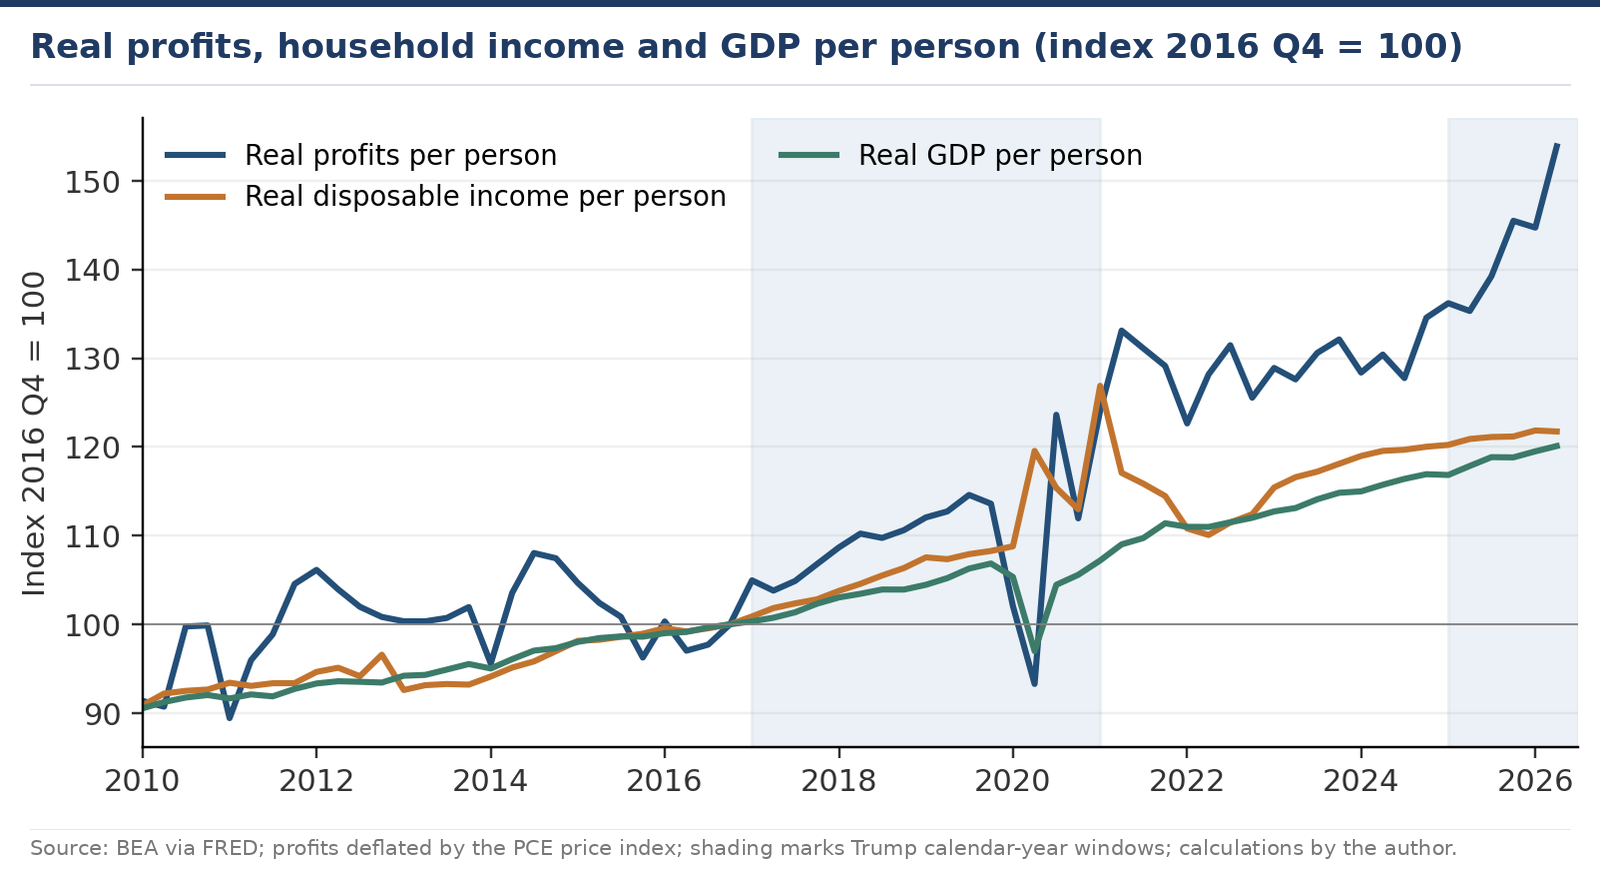
- Corporate owners are the clearest winners: real after-tax profits per person rose 13.6 percent from 2016 Q4 to 2019 Q4 and 14.4 percent from 2024 Q4 to 2026 Q2, against 8.3 and 1.4 percent for real household disposable income per person.
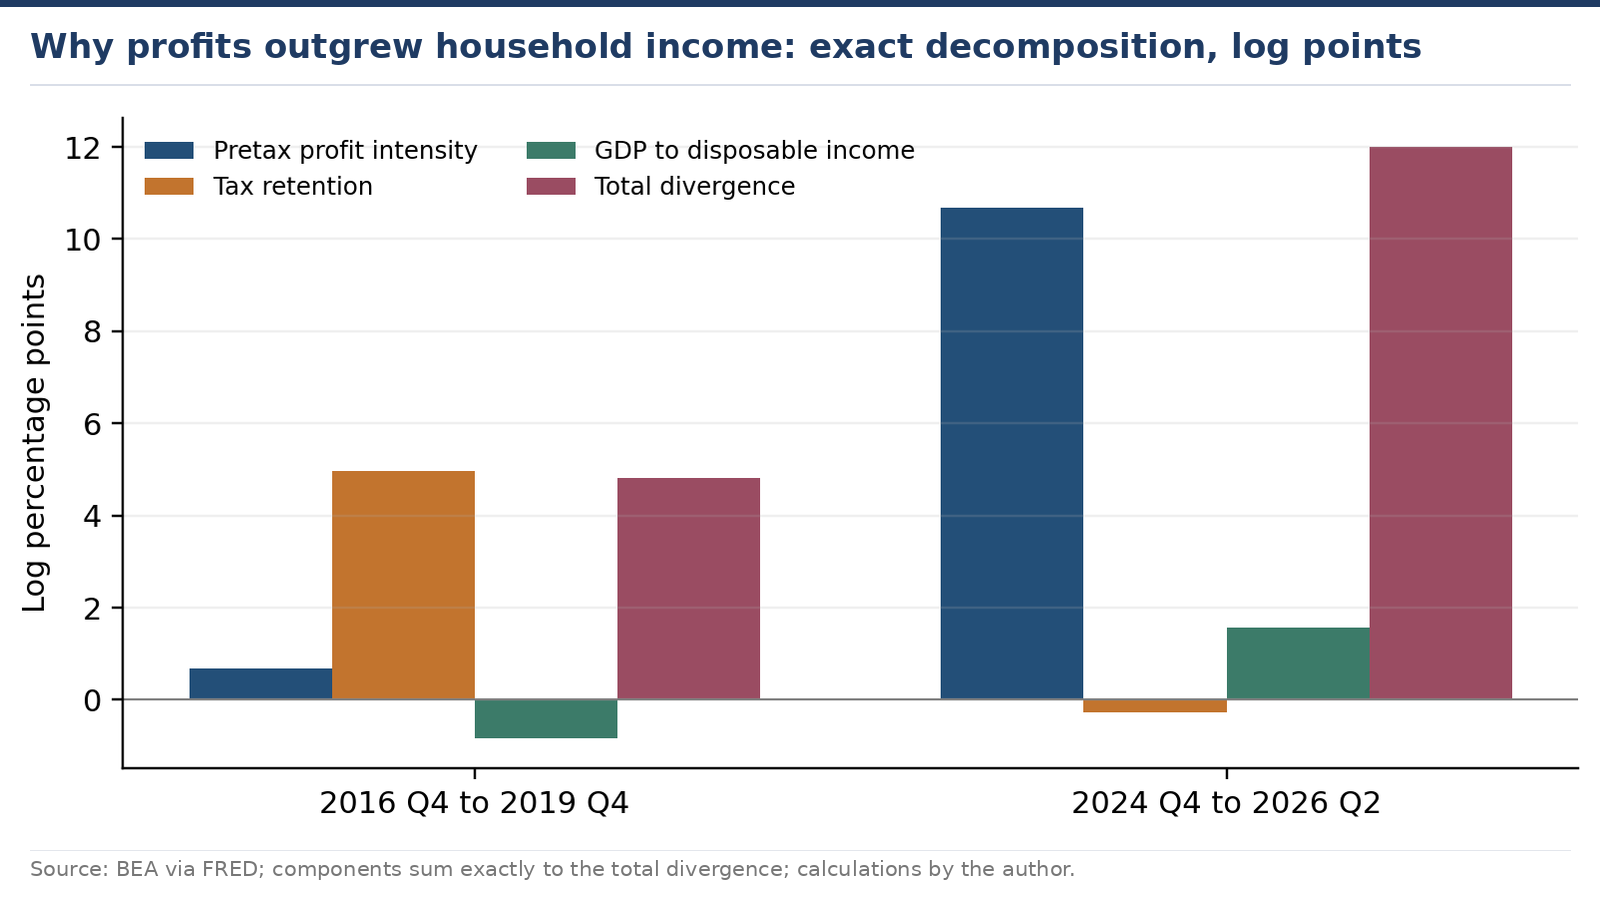
- The engine changed: in the first term higher tax retention explains the whole relative rise of profits (+4.96 of 4.80 log points); in the second, wider pretax margins do (+10.68 of 11.99).
- Gains reach households unevenly: the top 10 percent hold about 88 percent of household equities, real hourly pay lagged productivity by about 2.7 points, and CBO projects the 2025 law cuts the lowest decile’s resources by 3.1 percent while raising the top decile’s by 2.7 percent.
- Tariffs are paid at home: about 90 percent of the 2025 border burden fell on US firms and consumers, and after the Supreme Court ruling, Section 122 and then Section 301 duties left the average statutory tariff at about 11 percent in August 2026.
Abstract
Who gains from Donald Trump’s economic policies: businesses, households or the US economy as a whole? This note answers the question with 26 official time series for 2007 to 2026, an exact accounting decomposition, a set of time-series tests and the strongest published causal research. The answer is asymmetric. Corporate owners are the first and clearest winners in both presidencies. From 2016 Q4 to 2019 Q4, real after-tax corporate profits per person rose 13.6 percent, against 8.3 percent for real disposable income per person and 6.9 percent for real GDP per person. From 2024 Q4 to 2026 Q2 the gap became a chasm: profits up 14.4 percent, household income up 1.4 percent, output up 2.7 percent. The engine has also changed. In the first term, higher tax retention accounts for the whole relative rise in profits; in the second, wider pretax margins do. Households did gain, through jobs and real income before the pandemic and through a higher median income in 2025. But pay is lagging productivity, equity ownership is concentrated at the top, the 2025 tax and spending law lowers the resources of the poorest decile, and about 90 percent of the tariff burden at the border falls on US firms and consumers. Investment responded to the corporate tax cut. Whether the economy as a whole gains depends on whether that investment reaches wages before debt and prices erode household purchasing power.
Keywords: tax incidence, tariffs, corporate profits, disposable income, profit margins, distribution, policy evaluation, local projections
JEL codes: E25, E62, F13, H22
Key findings
1. Profits beat household income in both terms, by far more in the second. From 2016 Q4 to 2019 Q4, real after-tax profits per person rose 13.6 percent, real disposable income per person 8.3 percent and real GDP per person 6.9 percent. From 2024 Q4 to 2026 Q2, the figures are 14.4, 1.4 and 2.7 percent. In the second term, profits per person are growing about ten times faster than household income.
2. The engine switched from tax cuts to margins. In the first window, the ratio of after-tax profits to disposable income rose 4.80 log points, and higher tax retention alone contributed 4.96. In the second window, the ratio rose 11.99 log points, and pretax profit intensity contributed 10.68 while tax retention subtracted 0.27. Today’s profit boom is a margin story, not a tax story.
3. Corporate gains reach a narrow group, and pay is lagging. The top 10 percent of households by wealth hold about 88 percent of household corporate equities and mutual fund shares; the bottom half holds about 0.6 percent. Between 2024 Q4 and 2026 Q2, real hourly compensation rose 0.38 percent against 3.07 percent for productivity, and manufacturing payrolls fell 0.79 percent, about 100,000 jobs.
4. The 2025 law takes from the bottom and gives most at the top. The Congressional Budget Office projects that Public Law 119-21 lowers the resources of the lowest income decile by 3.1 percent, about 1,200 dollars a year, and raises those of the top decile by 2.7 percent, about 13,600 dollars, on average over 2026 to 2034.
5. Tariffs are paid at home. About 90 percent of the 2025 tariff burden at the border fell on US firms and consumers. In the first term, protection raised steel and aluminum output by 1.9 and 3.6 percent but cut downstream production by 0.6 percent. Since the Supreme Court struck down the IEEPA tariffs in February 2026, a temporary 10 percent surcharge and then, from 24 July 2026, Section 301 duties of 10 or 12.5 percent on 60 economies have replaced them, leaving the average statutory tariff at about 11 percent in August.
1. The question and the short answer
Asking who benefits from an economic policy is more demanding than asking whether the economy grew while a president was in office. A government can support corporate cash flows while raising consumer prices, lift investment while weakening public finances, or protect one industry while damaging its customers. A credible evaluation must identify who receives a policy change first, trace how it travels, and record who pays for it. The right comparison is with an economy in which policy was different, not with the economy on inauguration day.
Both presidencies make the test hard. The first began in an established expansion and ended in a pandemic; the second began after an inflation episode and monetary tightening, during a boom in data-centre investment.
This note therefore measures four dimensions separately and does not add them into one score. Corporate gains are measured by after-tax profits and by the share of pretax profits that firms keep after tax. Household gains are measured by real disposable income per person, real median household income, employment and real hourly compensation. Economy-wide gains require evidence on output per person, investment and productivity. Financing records whether present gains are paid for by public borrowing or by burdens on other domestic agents. Adding an investor’s capital gain to a worker’s pay rise would double-count, since the same corporate income can appear first as profits and later as dividends.
The short answer is that corporate owners and specifically favored firms are the most immediate and visible beneficiaries in both presidencies. Households gained in the first term through jobs and real income, and the median household gained in 2025, but in the second term the transmission from profits to pay has been weak, and gains that flow through share ownership go overwhelmingly to the wealthiest households. Tariffs create clear winners among protected producers and clear losers among their customers. The economy as a whole gains only if the extra investment raises capacity and pay by more than the cost of the debt, prices and distortions that finance it. The evidence shows an investment response and unequal incidence, not a net gain for the typical household.
The note makes three analytical contributions: an exact decomposition showing that the driver of the profit boom changed between the two terms, a specification audit showing how much standard time-series tests depend on the comparison window, and a distributional break-even exercise asking how much extra price pressure would cancel the household gains projected for the 2025 law. It closes with a dashboard of leading indicators, scenarios to 2028, implications for policy and for investors, and a dated calendar of what to watch.
Box 1. How to read the evidence
The note uses four levels of evidence and never promotes a finding from one level to a stronger one. Measurement asks what happened to official series over explicitly defined periods: profits, income, jobs, prices. Accounting asks which components reconcile an observed change exactly; the decomposition in Section 6 is an identity, so it explains arithmetic, not causes. Conditional econometrics asks whether a series breaks from its earlier path around a policy date, given chosen trends and dynamics; the interrupted time series, dynamic regression and local projections in Section 9 belong here. Causal research uses differences in exposure across firms, industries or products, such as the tax and tariff studies in Section 10, and is the only level that can attribute an effect to a policy.
Four limits apply throughout. There is no untreated United States, so national time series cannot fully separate presidential policy from monetary policy, global demand, commodity prices and technology. Official data will be revised. National corporate profits include income earned abroad, so their ratios to domestic GDP and household income are diagnostics, not factor shares. The second-term window covers only six quarters, and projections such as CBO’s are never mixed with realized outcomes. Within these limits, the rest of the note states its results plainly.
2. Policy episodes and the timing problem
Policy timing is not the same as presidential timing. Table 1 sets out the episodes and how the note treats them.
| Episode | Main economic channels | Treatment in this note |
|---|---|---|
| 2017 | Policy anticipation and inherited expansion | Observed separately from the 2018 tax break |
| 2018 to 2019 | Corporate tax reform and escalating trade restrictions | Main pre-pandemic evaluation window |
| 2020 | Pandemic disruption and emergency fiscal response | Separate full-term endpoint comparison |
| 2021 to 2024 | Intervening presidency and persistent earlier policies | Context and second-term baseline |
| 2025 to 2026 Q2 | Tax and spending law, IEEPA tariffs, then Section 122 and Section 301 duties | Six observed quarters, limited causal leverage |
| After 2026 Q2 | Implementation, litigation and longer-run adjustment | Dashboard and author’s scenarios only |
Table 1. Policy episodes and their treatment. Sources: IRS, USITC, White House, USTR, Supreme Court; classification by the author.
The Tax Cuts and Jobs Act was enacted in December 2017, and the federal corporate rate generally became 21 percent for tax years beginning after that year, so the main statistical interruption is 2018 Q1; anticipation during 2017 and blended rates for fiscal years spanning the change blur the date. The first-term steel and aluminum tariffs began in March 2018 and were followed by successive measures on Chinese goods; the US International Trade Commission’s retrospective covers outcomes over 2018 to 2021, a window that crosses presidential terms.
The second term needs its own clocks. Public Law 119-21 was enacted in July 2025, and its distributional effects phase in over later years. The broad tariffs imposed in 2025 under the International Emergency Economic Powers Act (IEEPA) ended when the Supreme Court held, in Learning Resources, Inc. v. Trump on 20 February 2026, that IEEPA does not authorize tariffs. A proclamation of the same day imposed a temporary 10 percent import surcharge under Section 122 of the Trade Act of 1974 from 24 February, for the statutory maximum of 150 days. It expired at 12:01 a.m. on 24 July 2026 and was replaced at the same minute by Section 301 duties, announced by the US Trade Representative on 23 July, on products of 60 economies covering 99.4 percent of US imports. The rate is 10 percent for 17 economies that ban imports made with forced labor, have committed to do so or maintain a partial regime, among them Canada, Mexico, India and the United Kingdom, and 12.5 percent for the others; for some products of the European Union, Japan, Korea, Switzerland and Taiwan, the rate is set net of the normal MFN duty. Goods subject to Section 232 tariffs, USMCA-qualifying goods and some raw materials are exempt.
The Yale Budget Lab estimated on 24 August 2026 that the average statutory tariff rate stood at 11.0 percent, rising to 11.8 percent by the end of the year under current law, with an ultimate effect on the consumer price level of about 0.7 percent and a cost of about 1,100 dollars per household per year. Twenty-five states filed suit against the Section 301 action at the Court of International Trade on 3 August 2026 (State of Oregon v. Trump), alongside a separate challenge by small businesses; the court heard oral argument at the end of September, and no ruling had been reported by 20 October. The duties are still being collected. A single permanent “Trump tariff” variable would therefore be misleading: the legal authority, coverage and rates have changed twice since February 2026 alone.
The common endpoint for the quarterly comparison is 2026 Q2; the advance estimate of third-quarter GDP is due on 29 October 2026, and no unobserved quarter is filled with a forecast. The first presidency is assessed twice, from 2016 Q4 to 2019 Q4 before the pandemic and from 2016 Q4 to 2020 Q4 over its final year. The second comparison starts in 2024 Q4.
A first look at the results
The full note goes much further, with original models, scenarios and a dashboard of leading indicators. Two of its 14 charts and diagrams are shown below.
Continue reading
Get the full note: 25 pages, 14 charts and diagrams, 10 tables
This page shows the first part of the note. The full PDF adds: how policy reaches beneficiaries; profits, household income and output; jobs, pay and manufacturing; corporate gains: from tax retention to margins; investment, productivity and pay; trade balances and the financing of gains; what the time-series tests can and cannot show; what the causal research establishes; the second term so far.
29 USD, instant PDF download, secure card payment.
Buy the full noteNeed this analysis for your organisation?
We prepare confidential briefings, executive talks and studies on countries, markets and policies, built on the same method as this article.
Request a briefingSupport independent analysis
Our studies are free to read and carry no advertising. If this one was useful, a small contribution helps us publish the next.
Support our workGo further: books by Global Strategy Files

Frequently asked questions
Who benefits most from Trump’s economic policy?
Corporate owners benefit first and most visibly. From 2024 Q4 to 2026 Q2, real after-tax corporate profits per person rose 14.4 percent while real disposable income per person rose 1.4 percent. Because the top 10 percent of households hold about 88 percent of household corporate equities, most of that gain flows to the wealthiest households, while wage earners have seen pay lag productivity.
Did households gain under Trump’s first term?
Yes. From 2016 Q4 to 2019 Q4, real disposable income per person rose 8.3 percent, payrolls grew by about 6.4 million and unemployment fell from 4.77 to 3.60 percent. Profits rose faster, by 13.6 percent, mainly because firms kept a larger share of pretax profits after the 2017 corporate tax cut, but household gains were real.
Who pays for Trump’s tariffs?
Mostly Americans. Federal Reserve Bank of New York researchers estimate that about 90 percent of the 2025 tariff burden at the border fell on US firms and consumers. Protected producers such as steel and aluminum gained output, but downstream users lost more. Consumer pass-through was about 26 percent in a later study, so more of the cost is still reaching households.
How does the 2025 tax and spending law affect different income groups?
The Congressional Budget Office projects that Public Law 119-21 lowers the resources of the lowest income decile by about 3.1 percent, or 1,200 dollars a year, and raises those of the top decile by about 2.7 percent, or 13,600 dollars, on average over 2026 to 2034. Middle deciles gain about 0.8 to 1.0 percent, a gain that tariffs could largely offset.
Sources
- U.S. Bureau of Economic Analysis (2026), GDP (Third Estimate), Industries, Corporate Profits, State GDP and State Personal Income, 2nd Quarter 2026, 30 September 2026. bea.gov
- U.S. Bureau of Economic Analysis, Release Schedule 2026 and 2027. bea.gov/news/schedule
- Kollar, M. and Z. Scherer (2026), Income in the United States: 2025, Current Population Reports P60-289, U.S. Census Bureau, 15 September 2026.
- Federal Reserve Bank of St. Louis, FRED: series GDPC1, GDP, A939RX0Q048SBEA, A229RX0Q048SBEA, DSPI, MEHOINUSA672N, CPROFIT, CPATAX, PNFIC1, PNFI, PAYEMS, MANEMP, UNRATE, OPHNFB, COMPRNFB, PRS85006173, PCEPI, CPIAUCSL, CPILFESL, CES0500000003, FEDFUNDS, DCOILBRENTEU, BOPGSTB, FYGFDPUN, FYFSGDA188S, WFRBSB50203, WFRBSN09149, WFRBLT01014, WFRBLN40068. Retrieved 20 October 2026.
- Internal Revenue Service, 2018 Fiscal Year Blended Tax Rates for Corporations.
- Chodorow-Reich, G., M. Smith, O. Zidar and E. Zwick (2026), Tax Policy and Investment in a Global Economy, manuscript dated 7 January 2026 (American Economic Review).
- U.S. International Trade Commission (2023), Economic Impact of Section 232 and 301 Tariffs on U.S. Industries, Publication 5405, March 2023.
- Flaaen, A. and J. Pierce (2019), Disentangling the Effects of the 2018-2019 Tariffs on a Globally Connected U.S. Manufacturing Sector, Finance and Economics Discussion Series 2019-086, Federal Reserve Board.
- Fajgelbaum, P., P. Goldberg, P. Kennedy and A. Khandelwal (2020), The Return to Protectionism, Quarterly Journal of Economics 135(1), 1-55.
- Amiti, M., C. Flanagan, S. Heise and D. Weinstein (2026), Who Is Paying for the 2025 U.S. Tariffs?, Liberty Street Economics, Federal Reserve Bank of New York, 12 February 2026.
- Amiti, M., S. Heise and D. Weinstein (2026), The Anatomy of Tariff Pass-Through into Consumer Prices, Federal Reserve Bank of New York Staff Report 1201, August 2026, revised September 2026.
- Amiti, M., S. Heise and D. Weinstein (2026), How Fast Do Tariffs Pass Through into Consumer Prices?, Liberty Street Economics, 6 October 2026.
- Congressional Budget Office (2025), Distributional Effects of Public Law 119-21, 11 August 2025.
- Congressional Budget Office (2026), The Budget and Economic Outlook: 2026 to 2036, February 2026.
- The White House (2026), Imposing a Temporary Import Surcharge to Address Fundamental International Payments Problems, proclamation of 20 February 2026.
- Supreme Court of the United States (2026), Learning Resources, Inc. v. Trump, decided 20 February 2026 (summary: Thomson Reuters, Supreme Court rejects IEEPA as a tariff statute, 20 February 2026).
- Office of the U.S. Trade Representative (2026), Notice of Actions in Section 301 Investigations of Acts, Policies, and Practices of Various Economies Related to the Failure of Each Economy To Impose and Effectively Enforce a Prohibition on the Importation of Goods Produced With Forced Labor, Federal Register, 28 July 2026.
- EY Tax News (2026), USTR takes final action imposing tariffs on 60 trading partners as Section 122 tariffs expire, July 2026.
- The Budget Lab at Yale (2026), State of U.S. Tariffs, 24 August 2026.
- Nakachi Eckhardt and Jacobson (2026), Twenty-Five States Sue to Block the Section 301 Forced-Labor Tariffs, 7 August 2026 (State of Oregon v. Trump, Court of International Trade No. 26-03467).
- WiseVoter (2026), Court Heard Arguments Over Forced-Labor Tariffs, 30 September 2026.
- U.S. Bureau of Labor Statistics, Employment Situation news release schedule, and 2025 Federal Government Shutdown Impact on the Current Population Survey.
- Board of Governors of the Federal Reserve System, Meeting calendars, statements and minutes (FOMC 2026 and 2027), and Distributional Financial Accounts.
- Jorda, O. (2005), Estimation and Inference of Impulse Responses by Local Projections, American Economic Review 95(1), 161-182.
Books from Global Strategy Files
Go further on this topic
The Tariff GambleHow America’s trade war is reshaping power, prices and prosperity.24.99 USD, see the book The Trump ProphecyPopulism, power and the remaking of US politics.20 USD, see the book
 Kill KennedyWhat the 2025 declassified files reveal about the machinery of American power.20 USD, see the book
