
The Sovereignty Ledger: Canada Between Deeper US Integration and Diversification, Scenarios to 2035


Driss EFFINA, PhD Independent Researcher, Global Strategy Files Foresight, prospective note No. 11, 24 October 2026. Reading time: about 55 minutes
Key takeaways
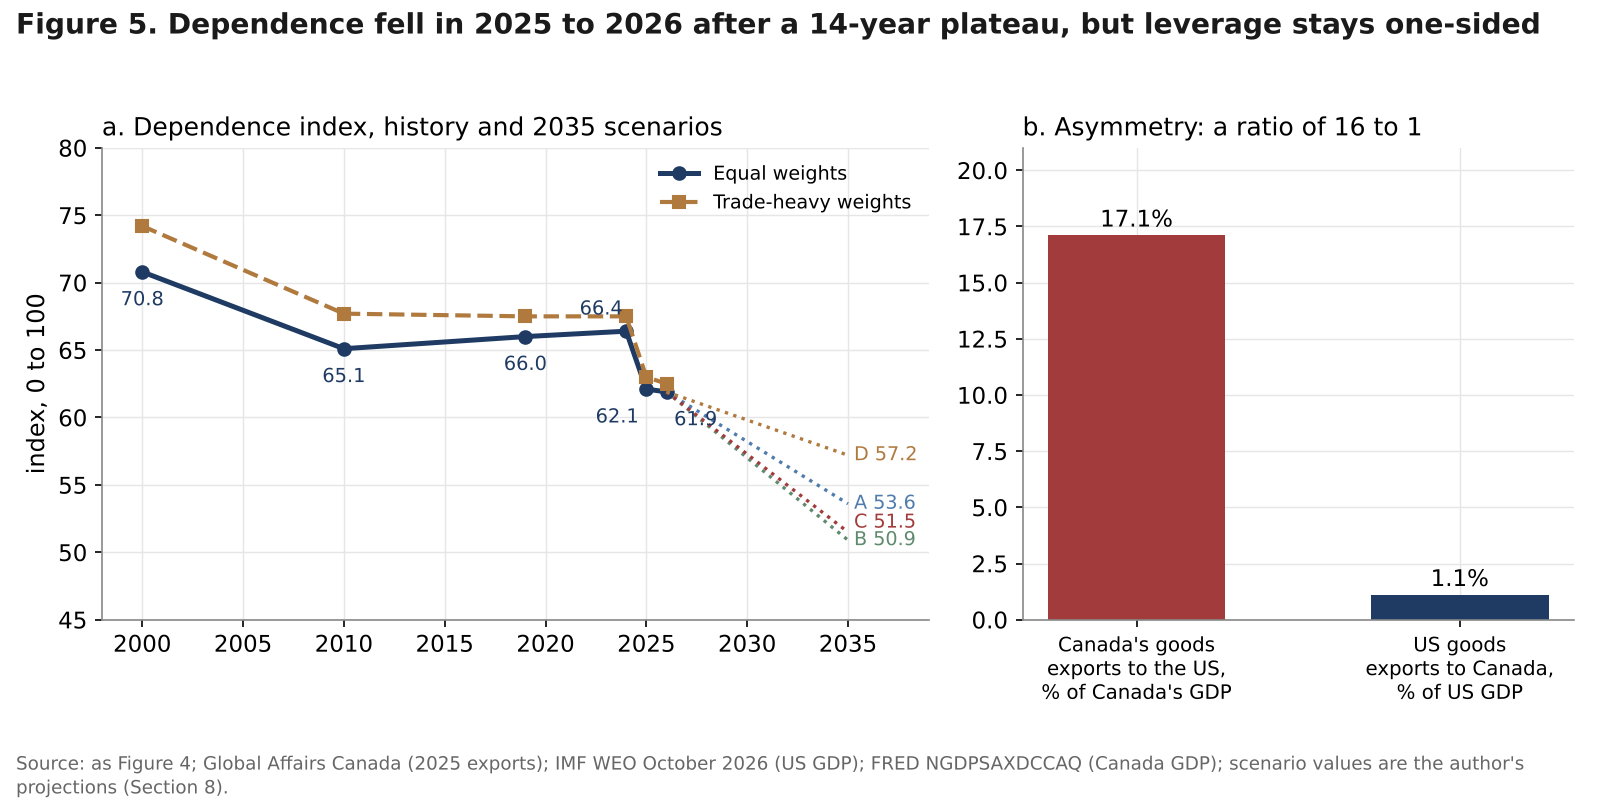
- Canada’s economic dependence index fell from 66.4 in 2024 to 61.9 in 2026, after fourteen flat years, but the fall is in goods: the US share of Canadian portfolio holdings rose from 42.7 percent in 2010 to 73 percent in 2024.
- US duties on Canadian goods total about 24.9 billion US dollars a year at 2025 values and cost about 1.3 percent of GDP; the threatened 50 percent auto tariff would add 0.22 points and hit Ontario hardest.
- A realistic diversification path multiplies non-US goods exports by 1.84 by 2035, short of the doubling goal, and still leaves the United States with 61 to 68 percent of goods exports.
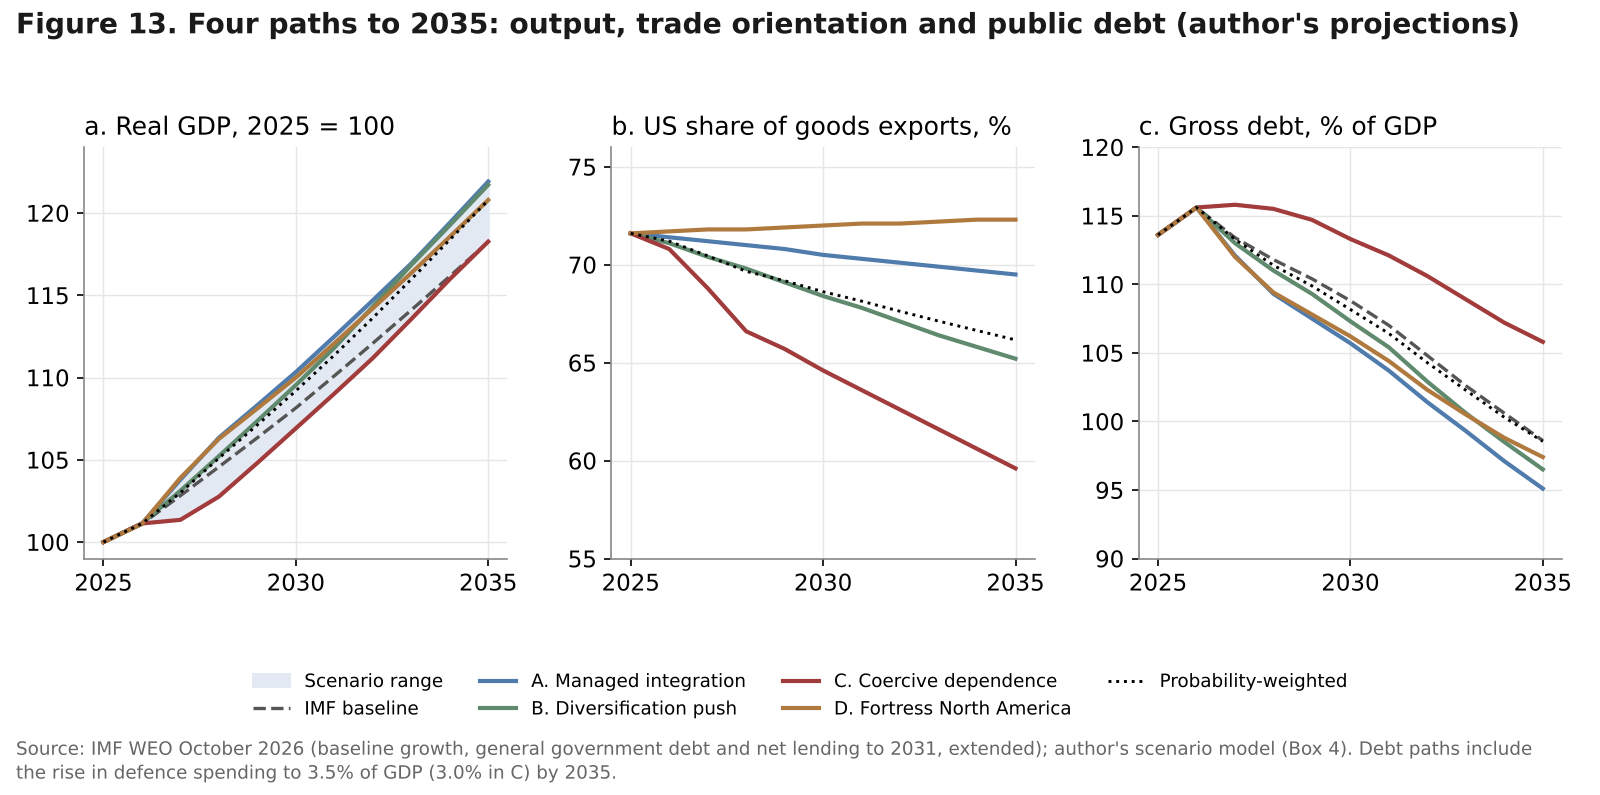
- In the author’s scenarios, GDP in 2035 is 3.1 (managed integration), 2.9 (diversification push), 0.0 (coercive dependence) and 2.2 percent (fortress North America) above the IMF baseline; internal trade reform is the largest single lever.
Abstract
In twenty months Canada has lived through more trade policy than in the previous twenty years. The United States imposed tariffs under four different laws, saw its emergency tariffs struck down by its own Supreme Court on 20 February 2026, declined on 1 July to confirm the 16-year extension of the Canada-United States-Mexico Agreement (CUSMA), applied 50 percent duties under the long-dormant Section 338 of the Tariff Act of 1930 from 22 August, and now threatens 50 percent tariffs on Canadian vehicles and parts from 1 January 2027. Canada answered with counter-tariffs on 27.6 billion Canadian dollars of US goods, a trade deal with China on electric vehicles and canola, a free trade agreement with Indonesia, a law on internal trade, a new oil pipeline to the Pacific listed as a project of national interest, and a defence industrial strategy that aims to place 70 percent of procurement at home. On 19 October Albertans voted by about three to one to stay in Canada.
This note asks whether Canada can and should reduce its economic dependence on the United States by 2035, and at what cost. It builds five original tools: an economic dependence index across six channels (trade, value chains, investment, energy, finance and defence) from 2000 to 2026; a decomposition of the US tariff wall by legal layer, sector and province; a gravity benchmark of how much trade could realistically move to Europe, Asia and Mexico by 2035; a comparison of internal trade barriers with US tariffs; and four scenarios to 2035 (managed integration, diversification push, coercive dependence and fortress North America) with probabilities and paths for output, trade orientation and public debt. All projections are the author’s.
Keywords: Canada, economic sovereignty, United States, CUSMA, USMCA, tariffs, Section 232, Section 338, trade diversification, gravity model, interprovincial trade barriers, Trans Mountain, LNG, defence spending, scenarios
JEL codes: F13, F14, F15, F51, F52, H56, R12
Key findings
1. Dependence fell more in 2025 and 2026 than in the previous fourteen years, but only in goods. The author’s economic dependence index, the average US share across six channels, fell from 70.8 in 2000 to 65.1 in 2010, then stayed between 65 and 67 until 2024. It dropped to 61.9 in 2026, a fall of 4.5 points in two years. Trade, imports, energy and defence explain the fall. Capital went the other way: the US share of Canadian portfolio holdings rose from 42.7 percent in 2010 to 73 percent in 2024. Leverage is one-sided: goods exports to the United States equal 17.1 percent of Canada’s GDP, against 1.1 percent of US GDP for exports the other way, a ratio of about 16 to 1. 2. The US tariff wall costs about 1.3 percent of GDP, and the next layer is aimed at Ontario. At 2025 trade values, US duties on Canadian goods amount to about 24.9 billion US dollars a year, or 1.07 percent of Canada’s GDP, including 2.0 billion of lumber anti-dumping and countervailing duties. On a shock model calibrated to published estimates, the layers in force lower GDP by about 1.31 percent, of which 0.32 points come from Section 338. The threatened 50 percent auto tariff would add 0.22 points and lift the average US tariff on Canadian goods from 6.27 to about 8.1 percent. Ontario’s exposure would reach about 2.5 percent of provincial GDP. With sector-specific rates, Quebec (aluminum) and British Columbia (lumber) are more exposed than uniform-response estimates suggest. 3. Trade can move, but geography caps how far. On a gravity benchmark, the United States takes 79.3 percent of Canada’s exports to its eight largest markets, against 70.3 percent predicted by size and distance: about 9 points of dependence are a choice, not geography. The European Union, Mexico and India are the most under-traded partners. A realistic path, with partner growth, a one-third catch-up of under-traded markets and new agreements, multiplies non-US goods exports by 1.84 by 2035, short of the government’s doubling goal by about 32 billion dollars. Even then the United States still takes 61 to 68 percent of goods exports in 2035. 4. Canada’s own internal barriers are as high as the US tariff wall. Statistics Canada’s estimate of interprovincial barriers on goods, a 6.9 percent tariff equivalent, is slightly above the 6.27 percent average US tariff on Canadian goods. Full liberalisation of internal goods trade is worth about 4 percent of GDP (IMF), 3.1 times the GDP cost of the US tariffs in force and 12.5 times that of Section 338. Yet in July 2026, 69 percent of small firms reported no meaningful change since the 2025 reforms. 5. Domestic execution, not the choice between Washington and the world, decides the outcome. In the author’s scenarios (managed integration 30 percent, diversification push 30 percent, coercive dependence 25 percent, fortress North America 15 percent), GDP in 2035 is 3.1, 2.9, 0.0 and 2.2 percent above the IMF baseline. The two constructive paths end only 0.2 points apart, although integration leads by 0.7 points in 2030. Coercive dependence costs about 145 billion dollars of 2035 output relative to managed integration and leaves gross debt at 105.8 percent of GDP, against 95.1 to 97.4 percent in the other paths. Raising core defence spending to 3.5 percent of GDP adds 6.8 points to 2035 debt in every path that achieves it. 6. Two pipelines decide how much energy dependence can fall. The Trans Mountain system is moving from 890,000 to about 1.19 million barrels a day by the end of 2028. With the West Coast Oil Pipeline (1 million barrels a day, listed as a project of national interest on 1 October 2026) in service early in the 2030s, the US share of crude exports falls from 87 percent in 2025 to about 75 percent in 2035; without it, to only about 85 percent.
1. Introduction: the question Canada never had to answer
Since the 1989 free trade agreement, Canadian economic policy rested on an assumption rarely stated: the US market would stay open, on predictable terms, to Canadian goods and capital. The events of 2025 and 2026 broke that assumption in three ways.
First, the legal basis of access became unstable. Between March 2025 and October 2026 the United States used Section 232 of the Trade Expansion Act (steel, aluminum, autos, lumber, copper, heavy trucks), the International Emergency Economic Powers Act (the “fentanyl” tariffs of 25 and then 35 percent on goods outside CUSMA), Section 122 of the Trade Act of 1974 (a 150-day surcharge after the Supreme Court struck down the emergency tariffs), and Section 338 of the Tariff Act of 1930, unused for more than 75 years.
Second, the agreement itself is now on a one-year leash. At the first joint review on 1 July 2026, the United States did not agree to extend CUSMA for 16 years, as Canada and Mexico proposed. The agreement remains in force until 1 July 2036, but it now faces annual reviews until the parties confirm an extension, and its investment chapter has no survival clause if a party withdraws.
Third, the political cost of dependence became visible at home. The referendum in Alberta on 19 October 2026, called by a premier who opposes independence, produced a clear vote to remain in Canada, about 75 percent against 25 percent on unofficial results. But energy, trade and fiscal grievances are now debated in the vocabulary of sovereignty.
This note treats sovereignty as an economic question with measurable answers: how dependent Canada is on the United States, through which channels, how much of that dependence could realistically be reduced by 2035, and what each path would cost in output and public debt. It does not repeat the monetary analysis of Decoded No. 8, which examined the Bank of Canada’s short-run trade-off; the horizon here is structural. Figure 1 sets out the framework.
US shocks act through six channels of dependence. Canada has four broad levers: trade diversification, the internal market, export infrastructure, and defence and critical minerals policy. The combination of the US posture (settle or escalate) and the Canadian strategy (keep autonomy or align) selects one of four paths to 2035. Sections 2 to 7 quantify each part; Section 8 assembles the scenarios.
2. The rupture in numbers
2.1 Four laws, one target
Table 1 lists the US measures that affect Canadian goods as of 24 October 2026, together with Canada’s responses. The sequence matters, because it shows a steady shift from measures that CUSMA could soften to measures it cannot.
Table 1. US measures on Canadian goods and Canadian responses, as of 24 October 2026
| Measure | Legal basis | Rate | Trade covered | Status |
|---|---|---|---|---|
| Steel and aluminum, with derivatives | Section 232 | 25% from March 2025, 50% from June 2025 | US$30.8 bn | In force |
| Autos and parts | Section 232 | 25% on non-US content | CUSMA content deducted | In force; 50% threatened from 1 Jan 2027 |
| Softwood lumber | Section 232 plus AD/CVD | 10% plus 35.16% AD/CVD (24.75% after the October 2026 final review) | US$5.7 bn | In force |
| Heavy-vehicle parts | Section 232 | 25% | US$4.2 bn | In force since November 2025 |
| Copper | Section 232 | 50% | US$1.4 bn | In force |
| “Fentanyl” tariffs | IEEPA | 25%, then 35% (CUSMA goods exempt) | Non-certified goods | Struck down 20 Feb 2026 (6 to 3) |
| Global surcharge | Section 122 | 10% for 150 days | Non-exempt goods | Lapsed 24 July 2026 |
| Autos, dairy and alcohol “discrimination” | Section 338 | 50% (no CUSMA relief) | US$17.7 bn | In force since 22 Aug 2026; list revised from 30 Oct |
| Import bans | Executive action | Ban | Certain alcohol, dairy by-products, motorcycles | From 29 Sep 2026 |
| Canadian counter-tariffs (2025) | Customs Tariff | 25% | C$30 bn, then steel, aluminum, autos | Most lifted 1 Sep 2025; metals and autos kept |
| Canadian counter-tariffs (2026) | Customs Tariff | 15%, 25% or 50% | C$27.6 bn, 629 tariff items | In force since 8 Sep 2026 |
Source: Torys (20 February 2026); Global Trade Alert (August 2026); Gowling WLG and Blakes (August 2026); Global Affairs Canada, softwood lumber (2026); Covington (August 2026); Supply Chain Dive (23 October 2026); Money.ca (5 October 2026).
Three features stand out. The Supreme Court’s ruling in Learning Resources v. Trump removed the broadest tariffs, but it left Section 232 intact, and Section 338 then filled the gap with duties that CUSMA certification cannot reduce. According to Global Trade Alert, the share of Canadian exports to the United States that CUSMA can still shield fell from 85.6 percent in October 2025 to 82.3 percent after Section 338, and 59.9 billion US dollars of the 364.9 billion of US imports from Canada in 2025 now face tariffs that the agreement cannot lower. The irony is that Canadian firms adapted quickly to the earlier regime: the use of CUSMA certificates rose from 38 percent to 86 percent of eligible trade during 2025.
Second, the measures are designed as leverage. The Section 338 proclamations of 20 July 2026 cite Canadian treatment of US vehicles, dairy and alcohol, and the January 2027 auto threat is a negotiating deadline. On 1 October the US Trade Representative, Jamieson Greer, said the administration was not prepared to drop existing or proposed tariffs; on 21 October Prime Minister Mark Carney reported no breakthrough after a call with President Trump.
Third, Canada’s response has been calibrated. The September 2026 counter-tariffs match US coverage “dollar for dollar”, exclude oil, gas and potash, and come with a 7.5 billion dollar support package, on top of nearly 25 billion dollars of support since 2025 and a further 6.2 billion dollar federal and Ontario plan for steel and autos announced on 21 October.
The average tariff rate tells the same story (Figure 2, panel b). The Bank of Canada’s projection assumed an average US tariff on Canadian goods of 5.0 percent in July 2026, against 0.1 percent before 2025, and a Canadian counter-tariff rate of 1.5 percent after remissions. Global Trade Alert estimates that the trade-weighted US rate fell from 4.68 to 4.37 percent when the Section 122 surcharge lapsed, then rose to 6.27 percent with Section 338: the highest rate Canada has faced in the post-war period, and higher than the rate on many US partners without a trade agreement.
2.2 Trade moved
Trade flows responded fast. The US share of Canada’s goods exports fell from 75.9 percent in 2024 to 71.7 percent in 2025, the lowest since the early 1980s according to Global Affairs Canada, and to 69.6 percent in June and 69.8 percent in August 2026 (Figure 3, panel a). Exports to the United States fell by 5.9 percent in 2025, to 555.4 billion dollars, while exports to other countries rose by 17.2 percent, to a record.
Part of the shift is illusory. Gold shipments to the United Kingdom rose by 17.4 billion dollars in 2025 and explain most of the 67.6 percent jump in exports to Britain. Excluding that rise, the US share of goods exports in 2025 was 73.2 percent rather than 71.7 percent. But the rest of the shift is real and broad: exports to the European Union rose by 23.5 percent (crude oil, aluminum and canola), and exports to China by 15.0 percent, helped by crude oil shipped through the expanded Trans Mountain pipeline. The goods surplus with the United States fell from 101.3 to 81.6 billion dollars, while the deficit with other countries widened to 112.9 billion (panel c).
Capital tells a different story (panel d). The US share of foreign direct investment in Canada fell from 64.6 percent in 2001 to 43.6 percent in 2020, then rose to 46.1 percent in 2025, its highest since 2018. The US took 49.5 percent of Canada’s outward stock in 2025 (40.5 percent in 2010), and 73 percent of Canadians’ foreign securities in 2024. Trade began to leave the United States in 2025; savings did not.
A first look at the results
The full note goes much further, with original models, scenarios and a dashboard of leading indicators. Two of its 14 charts and diagrams are shown below.
Continue reading
Get the full note: 26 pages, 14 charts and diagrams, 9 tables
This page shows the first part of the note. The full PDF adds: an economic dependence index; decomposing the tariff wall: sectors and provinces; where can trade go? A gravity view; the wall inside: internal trade barriers; energy, minerals and defence: the strategic levers; four scenarios to 2035; a dashboard of leading indicators; implications for policy, businesses and investors; what to watch, October 2026 to mid-2027.
29 USD, instant PDF download, secure card payment.
Buy the full noteNeed this analysis for your organisation?
We prepare confidential briefings, executive talks and studies on countries, markets and policies, built on the same method as this article.
Request a briefingSupport independent analysis
Our studies are free to read and carry no advertising. If this one was useful, a small contribution helps us publish the next.
Support our workGo further: books by Global Strategy Files

Frequently asked questions
How dependent is Canada on the United States economically?
On an index averaging six channels (trade, imports, investment, energy, finance and defence), Canada’s dependence was 61.9 out of 100 in 2026, down from 70.8 in 2000 and 66.4 in 2024. The United States took 71.7 percent of goods exports in 2025 and 87 percent of crude exports, and 73 percent of Canadians’ foreign securities were American in 2024. Goods exports to the US equal 17.1 percent of Canada’s GDP.
How much do US tariffs cost Canada in 2026?
At 2025 trade values, US tariffs and lumber duties on Canadian goods amount to about 24.9 billion US dollars a year, or 1.07 percent of Canada’s GDP. On the author’s shock model, the layers in force lower GDP by about 1.3 percent, including 0.32 points from the Section 338 tariffs of August 2026. A 50 percent auto tariff from January 2027 would add about 0.22 points, mostly in Ontario.
Can Canada double its non-US exports by 2035?
Only with effort. A gravity benchmark shows the European Union, Mexico and India are the most under-traded partners. Partner growth, a partial catch-up and new agreements multiply non-US goods exports by about 1.84 by 2035, about 32 billion dollars short of doubling. Even if doubling is achieved, the United States would still take roughly 63 to 65 percent of Canada’s goods exports in 2035.
What are the scenarios for Canada’s economy to 2035?
The author assigns 30 percent to managed integration, 30 percent to a diversification push, 25 percent to coercive dependence and 15 percent to fortress North America. GDP in 2035 ends 3.1, 2.9, 0.0 and 2.2 percent above the IMF baseline, and gross debt between 95 and 106 percent of GDP. The constructive paths differ little; what matters most is opening the internal market and building Pacific export capacity.
Sources
- Alvarez, J., Krznar, I. and Tombe, T. (2019), “Internal Trade in Canada: Case for Liberalization”, IMF Working Paper 19/158.
- Axios, “Canada, like Europe, seeks to break U.S. defense dependency”, 25 February 2026.
- Bank of Canada, Monetary Policy Report, July 2026: “Overview” and “Tariff and other assumptions” (and earlier vintages, October 2025 to April 2026).
- Bank of Canada Valet API: V39079 (policy rate), STATIC_TOTALCPICHANGE (CPI), retrieved 20 October 2026.
- Blakes, “Canada imposes counter-tariffs on 27.6 billion of U.S. imports effective September 8, 2026”, 27 August 2026; “Canada removes tariffs on U.S. goods certified under CUSMA”, 2025.
- Canada Energy Regulator, Market Snapshot, “Canadian exports of crude oil to destinations other than the United States are mainly from Newfoundland and Labrador’s offshore”, 2020.
- Canada Gazette, Part II, SI/2026-30, Order fixing the date of entry into force of the Canada-Indonesia Comprehensive Economic Partnership Agreement, 1 July 2026.
- Canadian Association of Petroleum Producers, “Canadian Exports of Crude Oil and Natural Gas”, 17 April 2026.
- Canadian Federation of Independent Business, “Internal trade improving on paper, but not yet in practice”, 2026 State of Internal Trade report card, 15 July 2026.
- Covington, “Section 338 tariffs on Canada take effect as Canada announces retaliatory response”, August 2026.
- Desjardins Economic Studies, “Canada: International Trade”, 6 October 2026.
- Euronews, “Canada unveils $6.2bn plan to shield manufacturers as Trump trade tariffs bite”, 22 October 2026.
- Global Affairs Canada, Office of the Chief Economist, “State of Trade 2026”; Monthly Trade Report, December 2025; softwood lumber, recent developments.
- Global Trade Alert, “Section 338 and Canada”, August 2026.
- Gowling WLG, “Ottawa’s calibrated retaliatory tariffs”, August 2026.
- Government of Canada, “Government of Canada removes barriers to interprovincial trade and labour mobility”, 17 November 2025.
- Government of Quebec, “Portrait de l’industrie de l’aluminium”.
- Head, K. and Mayer, T. (2014), “Gravity Equations: Workhorse, Toolkit, and Cookbook”, Handbook of International Economics, vol. 4.
- IISD Investment Treaty News, “United States declines to renew USMCA at first joint review, triggering annual reviews”, 9 September 2026.
- IMF, World Economic Outlook database, October 2026 (NGDP_RPCH, NGDPD, GGXWDG_NGDP, GGXCNL_NGDP for Canada, the United States, the United Kingdom, China, India and eleven euro area economies); April 2026 values for Japan, Mexico and South Korea as reported by Capital.com (12 June 2026).
- Mining Weekly, “Canada launches C$2bn critical minerals sovereign fund”, 5 November 2025.
- Money.ca, “U.S.-Canada trade: auto tariffs January 2027”, 5 October 2026; Advisor.ca, “PBO trims economic forecast amid new U.S. tariffs”, 20 October 2026; BNN Bloomberg, federal budget date, 20 October 2026.
- NPR, “Alberta voters reject a move toward independence in referendum backing Canadian unity”, 20 October 2026.
- Prime Minister of Canada, “Prime Minister Carney announces new trade agreement with Indonesia”, 24 September 2025; “Canada has achieved NATO 2% defence spending target”, 26 March 2026.
- Privy Council Office, Major Projects Office, “West Coast Oil Pipeline”, page modified 13 October 2026.
- RBC Economics, “Six questions about the significance of interprovincial trade barriers in Canada”, 25 February 2025; Provincial Forecast Tables, Q4 2024.
- S&P Global Commodity Insights, “Canada, British Columbia sign pact to fast-track energy corridors”, 2 July 2026; Underground Infrastructure, May 2026.
- Scotiabank Economics, “US tariffs: provincial impacts”, 15 September 2025; “Canada-US Trade: Getting Up To Speed”, 31 January 2025.
- SIPRI, “Trends in International Arms Transfers, 2025”, March 2026, and 2024 edition.
- Statistics Canada, The Daily: merchandise trade releases of 19 February, 4 August and 6 October 2026; “Foreign direct investment, 2025”, 29 April 2026; “Foreign direct investment, 2010”, 15 April 2011; “Foreign direct investment, 2020”, 27 April 2021; Focus on Canada and the United States (trade, investment, GDP); Canada’s International Investment Position, 67-202-X, 2010 tables; series v2062815.
- Supply Chain Dive, “Trump tweaks Canada tariffs, removing certain goods while adding others”, 23 October 2026.
- The Canadian Press via CP24 and Advisor.ca, “Carney reaches ‘landmark’ tariff-quota deal with China on EVs, canola”, 16 January 2026.
- Torys, “United States Supreme Court strikes down emergency tariffs”, 20 February 2026; “Investing in Canada: LNG”, fall 2026.
- White and Case, “USMCA 2026 Joint Review: United States declines to extend Agreement, triggering annual reviews”, 2026.
- World Bank, World Development Indicators (MS.MIL.XPND.GD.ZS for Canada and the United States) and WITS country profiles for Canada, 2000, 2010 and 2019.
- FRED, NGDPSAXDCCAQ (Canada nominal GDP).
- Global Strategy Files, Decoded No. 8, “The Bank of Canada’s Silent Trap”, October 2026.
- All web sources retrieved on or before 24 October 2026; data files fetched on 20 October 2026.
Books from Global Strategy Files
Go further on this topic


