
Britain’s Stagflation Trap: Four Paths to 2030

Driss EFFINA, PhD Independent Researcher, Global Strategy Files Foresight, prospective note No. 10, 24 October 2026. Reading time: about 55 minutes
Key takeaways
- The United Kingdom is the only one of five large advanced economies to have combined below-trend growth and inflation more than half a point above target in each year from 2023 to 2026; its price level is 16.8 percent above a 2 percent path from 2020.
- British growth slowed by 0.71 point a year more than its peers between 2000 to 2007 and 2016 to 2025, mostly through productivity and capital; published Brexit estimates imply a drag of 0.56 to 0.75 point a year.
- On an original policy room measure, Britain has the least monetary and market room of the five; about 11 billion pounds of fiscal headroom would vanish with a 0.9 point rise in gilt yields and Bank Rate.
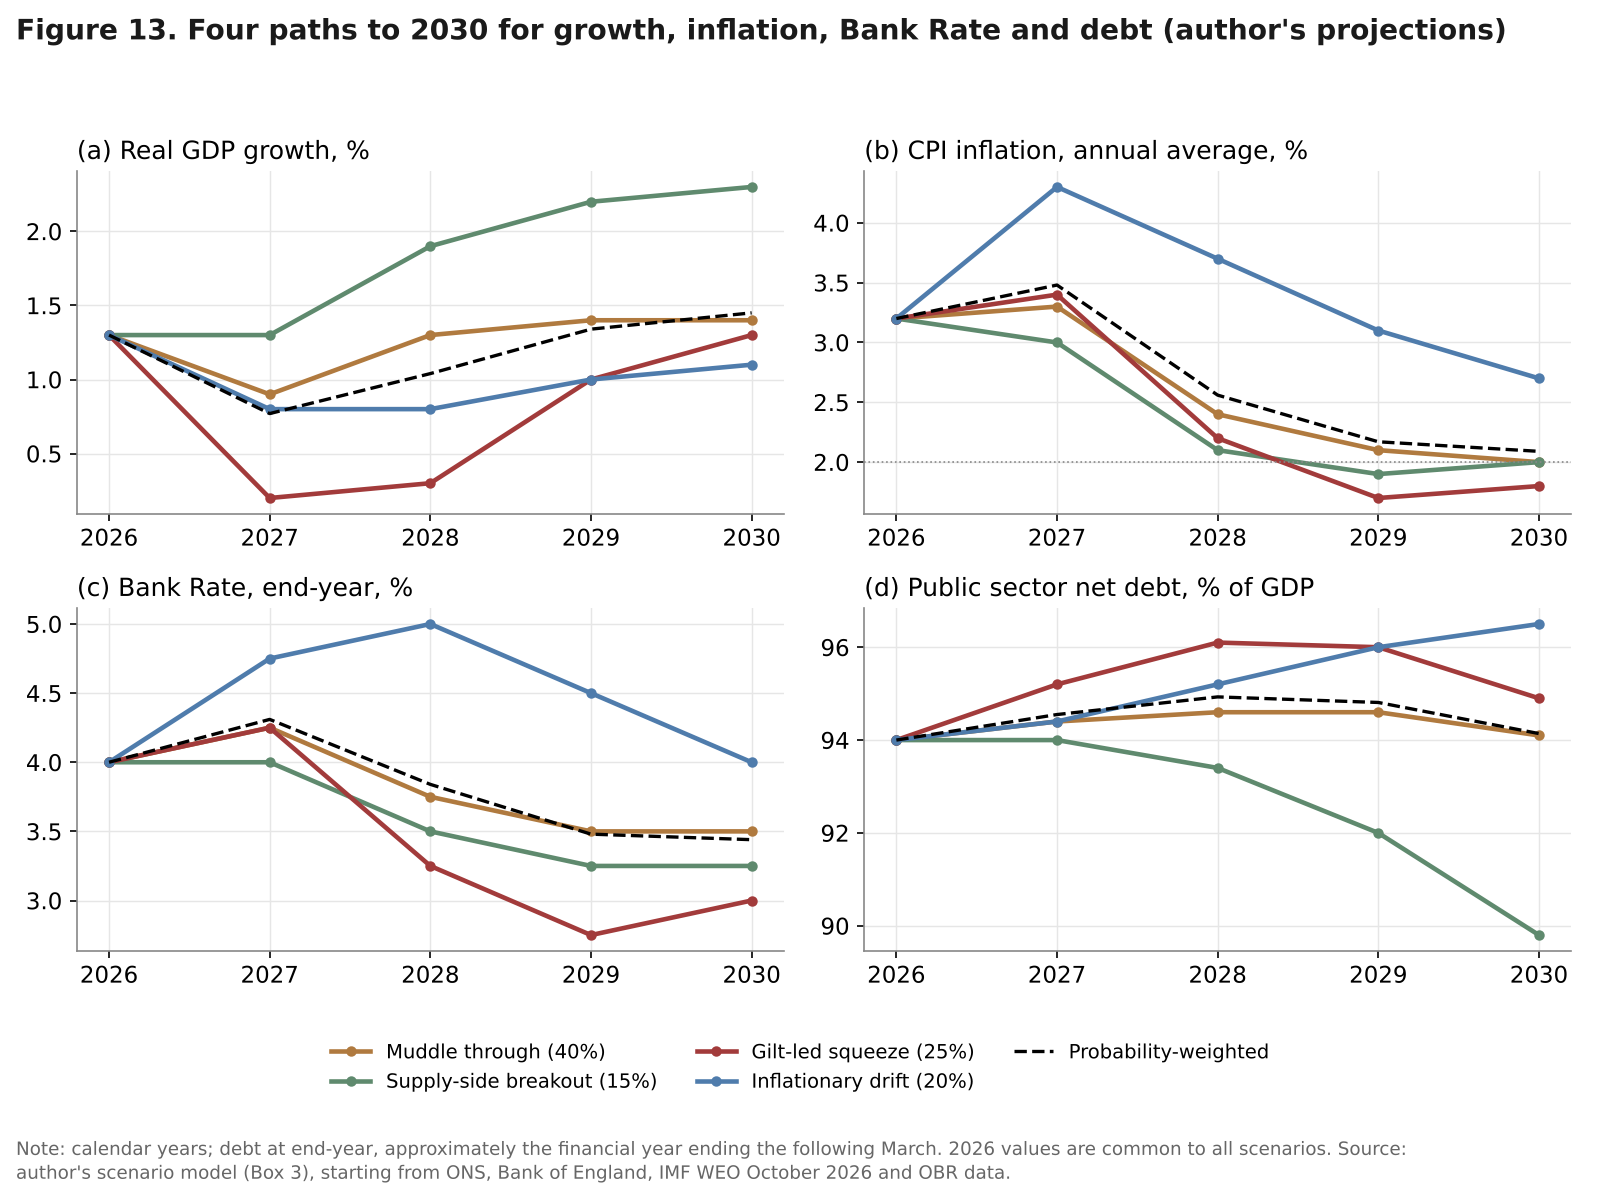
- In the author’s scenarios, muddle through is most likely (40 percent), but a gilt-led squeeze (25 percent) and inflationary drift (20 percent) together are almost as likely; in 2030 debt interest ranges from 120 to 154 billion pounds.
Abstract
Four days before the first Budget of Chancellor John Healey, the United Kingdom combines the two symptoms that define stagflation. Consumer price inflation rose from 3.1 percent in August to 3.5 percent in September 2026, with services inflation at 3.7 percent and petrol at its highest price since 2022. Growth is positive but modest: GDP rose by 0.6 percent in the first quarter and 0.5 percent in the second, and by 0.1 percent in August. Unemployment is 4.7 percent, vacancies are at a five-year low, and real regular pay growth has shrunk to well under 1 percent. The ten-year gilt yield was 5.44 percent on 20 October, and in September it was the highest of the five large advanced economies covered here; the thirty-year yield touched 6.03 percent on 1 October, a level last seen in January 1998. Bank Rate has been 3.75 percent since December 2025, but three of the nine members of the Monetary Policy Committee voted for an increase in July and again in September, and markets price a rise on 5 November.
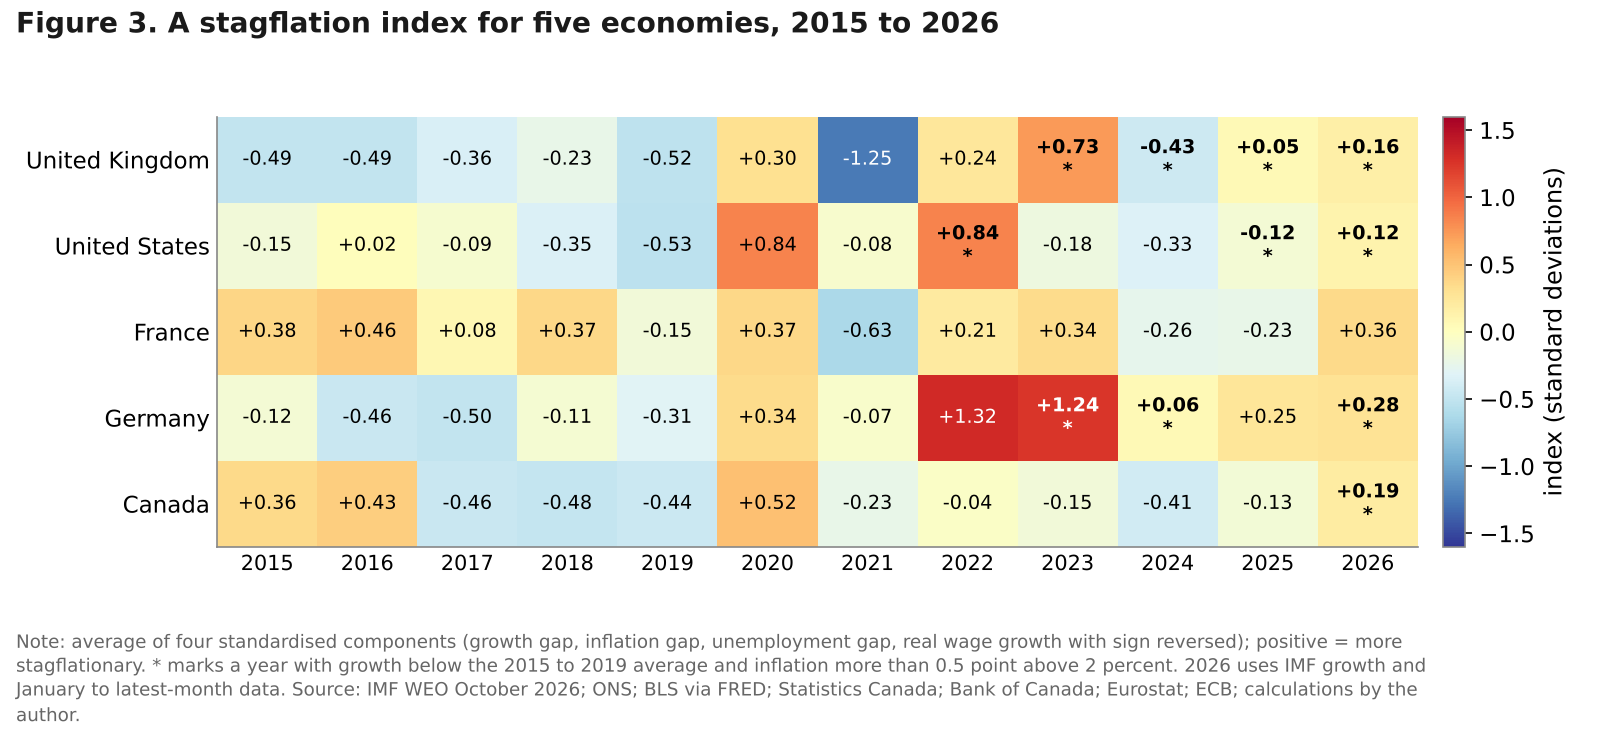
This note asks how deep the British trap is, where it comes from and how it can end by 2030. It builds four original tools. The first is a stagflation index for the United States, the United Kingdom, France, Germany and Canada from 2015 to 2026, built from growth, inflation, unemployment and real wages. The second is a supply-side decomposition of growth since 2000, which isolates the part of the British slowdown that peers did not share and sets it against published estimates of the cost of Brexit. The third is a “policy room” measure that puts the three British constraints (the fiscal rules, the inflation target and the gilt market) on a common scale. The fourth is a scenario model of growth, inflation, Bank Rate, debt and debt interest to 2030, with four paths and explicit probabilities, plus 20,000 stochastic simulations.
Keywords: United Kingdom, stagflation, inflation, productivity, Brexit, gilts, fiscal rules, Bank of England, Budget 2026, scenarios, growth accounting
JEL codes: E31, E52, E62, E66, O47, F15
Key findings
1. Britain’s stagflation is chronic rather than acute. On the author’s four-component index, France (+0.52) and Germany (+0.41) score higher than the United Kingdom (+0.15) on the latest data, because British unemployment is close to equilibrium and real pay is still rising. But the United Kingdom is the only one of the five economies to have combined below-trend growth and inflation more than half a point above target in each of the four years 2023 to 2026. Its price level is 16.8 percent above a 2 percent path from 2020, the largest overshoot of the five. 2. About 0.7 point a year of the slowdown is British-specific, and the published Brexit estimates explain most of it. UK growth fell from 2.48 percent a year in 2000 to 2007 to 1.24 percent in 2016 to 2025, while the peer average (United States, France, Germany) slowed by 0.53 point. The excess slowdown of 0.71 point comes mainly from total factor productivity (0.47) and capital (0.18). Mapped through the same accounting, the estimates of Bloom and co-authors (2025) imply a Brexit drag of 0.56 to 0.75 point a year, 79 to 105 percent of the excess. 3. The policy trilemma binds on all three sides at once. The United Kingdom has the least monetary room (a Taylor-type rule is 0.78 point above Bank Rate) and the least market room (the ten-year yield exceeds trend nominal growth by 2.0 points) of the five. Its policy room is minus 1.98 points at the 20 October gilt yield, against plus 0.15 in 2015 to 2019. The October estimate of fiscal headroom, about 11 billion pounds, would be absorbed by a parallel rise of 0.9 point in gilt yields and Bank Rate. 4. Muddling through is the most likely path, but the two stagflationary paths together are almost as likely. The author’s probabilities are 40 percent for muddle through, 25 percent for a gilt-led squeeze, 20 percent for inflationary drift and 15 percent for a supply-side breakout. The weighted path has growth of 0.8 percent in 2027 rising to 1.5 percent in 2030, inflation of 3.5 percent in 2027, Bank Rate peaking near 4.3 percent and net debt close to 94 percent of GDP in 2030. The simulated probability that 2027 combines growth below 1 percent and inflation above 3 percent is 49 percent. 5. The fiscal stakes are large relative to the headroom. In 2030, debt interest is 154 billion pounds under drift and 120 billion under the breakout, a gap three times the remaining headroom. Over four years, growth 1 point a year lower adds about 9 points to the 2030 debt ratio; gilt yields 1.5 points higher add about 1 point. Growth decides solvency; the gilt market decides the fiscal rules. 6. The way out runs through supply. Only faster supply growth relaxes the fiscal rules, the inflation target and the gilt constraint together. The published cost of Brexit, 6 to 8 percent of GDP per head, is more than twenty times the 0.3 percent of GDP the government expects from its 2025 reset with the European Union by 2040. The Budget of 28 October can buy time and credibility; it cannot open the trap on its own.
1. Introduction
Stagflation is a word British economists use with care. It recalls the 1970s, when inflation reached double digits while output stalled. Nothing in 2026 resembles that scale: inflation is 3.5 percent and GDP is growing. Yet the British economy has a milder version of the same disease, and it has had it for longer than its peers. Inflation has been above the 2 percent target for most of the last five years. Growth has not regained its pace of before the 2016 referendum. The bond market charges the British government more than the governments of the United States, France, Germany or Canada. And the war involving Iran that began at the end of February 2026 and disrupted the Strait of Hormuz has pushed inflation back up just as it was returning to target: Brent crude averaged 69 dollars a barrel in 2025, 71 dollars in February 2026 and 127 dollars in October.
The politics have changed too. Andy Burnham became Prime Minister on 20 July 2026, after Keir Starmer resigned, and appointed John Healey, Defence Secretary until June, as Chancellor of the Exchequer. Their first Budget, on 28 October, will be judged by a gilt market that lifted the ten-year yield by 8 basis points on the new Prime Minister’s first afternoon, and by a Bank of England that is close to raising rates.
This foresight note asks three questions, with a horizon of 2030. Is the United Kingdom in stagflation, and how does it compare with its peers? Where does the weakness of British growth come from, and how much is due to Brexit? And what are the paths out, when fiscal policy, monetary policy and the willingness of investors to hold gilts all seem constrained at once? Figure 1 sets out the argument: three causes (the 2026 supply shock, a weak supply side and persistent inflation) meet three constraints (the Bank of England, the gilt market and the fiscal rules), and the outcome is a trap that only higher supply growth can open.
The note does not repeat earlier work in this series. Foresight No. 6 projected long-term interest rates to 2035; here the gilt market enters as a constraint on British policy, not as an object of forecasting. Decoded No. 10 measured how the oil shock raises the cost of index-linked gilts; here that mechanism is one input into a broader debt-interest model. Section 2 sets out the facts, Section 3 builds the stagflation index, Section 4 decomposes the supply side, Section 5 measures the policy trilemma and Section 6 presents four paths to 2030, followed by a dashboard, implications and a calendar.
2. Britain in October 2026: the facts
2.1 Growth: better than feared, weaker than needed
Growth in 2026 has beaten official forecasts. In March, the Office for Budget Responsibility (OBR) expected 1.1 percent for the year. The Office for National Statistics (ONS) has since estimated growth of 0.6 percent in the first quarter and 0.5 percent in the second (revised up from 0.4), and monthly GDP rose 0.4 percent in July and 0.1 percent in August, against expectations of a fall. The three months to August were 1.8 percent above a year earlier. The composition is less reassuring. Second-quarter growth came mainly from net trade (exports up 2.8 percent, imports flat), while household consumption grew 0.3 percent and government consumption fell 0.5 percent. Business investment rose 1.8 percent in the quarter and 5.2 percent over the year, but whole-economy investment, at 19.0 percent of GDP, remains the lowest in the G7, and government investment fell 2.9 percent.
2.2 Inflation: the second wave
CPI inflation fell from 11.1 percent in October 2022 to 1.7 percent in September 2024, then rose again. It was 3.0 percent in February 2026, before the war, and 3.5 percent in September, above the consensus of 3.4 percent, as petrol reached 169.5 pence a litre. Core inflation rose from 2.6 to 2.8 percent and services inflation from 3.4 to 3.7 percent. Unlike 2022, the impulse is energy and fuel while the labour market loosens: services inflation had fallen from 4.5 percent in March to 3.4 percent in August, and food inflation to 1.3 percent. The Bank of England’s September minutes projected inflation of about 3.75 percent in the fourth quarter and a peak slightly above 4 percent in the first quarter of 2027, against a 3.2 percent peak projected in July.
2.3 Labour market and pay
The labour market is cooling, not collapsing. Unemployment was 4.7 percent in the three months to August, down from 4.9 percent a month earlier but up from 3.6 percent in 2022. Vacancies fell to 691,000 in the three months to September, a five-year low, against 1.29 million in May 2022 and 824,000 on average in 2019. Regular pay growth was 3.7 percent, half its August 2023 peak of 7.9 percent. Deflated by August inflation (3.1 percent), real regular pay grew 0.6 percent (0.8 percent on the ONS deflator); against September inflation, it is close to zero. Real pay has been the cushion of British households since 2023, and Figure 2 shows how fast it is thinning.
2.4 Rates, gilts and mortgages
The Bank of England cut Bank Rate to 3.75 percent on 18 December 2025, by five votes to four, and has held it since. In July and again on 17 September the vote was six to three, the minority (in July Megan Greene, Huw Pill and Catherine Mann) preferring 4 percent. In September the Committee also decided to run down its remaining gilt holdings, about 368 billion pounds, to zero by around 2034. After the September inflation data, markets priced a quarter-point rise on 5 November with a probability of about 96 percent, and at least three rises by April 2027.
The gilt market moved first. The ten-year yield averaged 4.43 percent in February and 5.24 percent in September, rose to 5.51 percent on 1 October (the highest since July 2007) and stood at 5.44 percent on 20 October. The thirty-year yield peaked at 6.03 percent on 1 October, the highest since January 1998, and a thirty-year syndication on 8 September priced at 5.82 percent, the highest coupon since the Debt Management Office (DMO) was created. The quoted two-year fixed mortgage rate at 75 percent loan-to-value rose from 3.97 percent in February to 5.13 percent in September.
2.5 Public finances and the Budget of 28 October
Public sector net debt was 3,005 billion pounds at the end of September, 94.0 percent of GDP; net financial liabilities were 82.7 percent. Borrowing in the first half of 2026-27 was 97.8 billion pounds, 6.0 billion above the OBR’s March forecast, and central government debt interest was 60.8 billion, 3.8 billion above forecast. Debt interest in 2025-26 was about 110 billion pounds.
The stability rule requires a current budget surplus in 2029-30, becoming a rolling third-year target thereafter; the investment rule requires net financial liabilities to fall as a share of GDP by 2029-30. The OBR’s Spring Forecast of 3 March put headroom against the stability rule at 23.6 billion pounds, up from 21.7 billion in November 2025, using market data from January, before the war. Independent estimates now put it at about 11 billion pounds (EY ITEM Club); Investec estimates that yields, Bank Rate and inflation could have eroded up to 15 billion. A survey of gilt investors reported in September suggested that headroom of about 14 billion would not trigger a large sell-off but that less than 20 billion could undermine confidence, and the Treasury has reportedly considered planning for less headroom than in March. The Budget is the first since the OBR cut its trend productivity assumption from 1.3 to 1.0 percent a year in November 2025, a downgrade worth about 25 billion pounds against the rules. Known measures include zero VAT on domestic electricity from 1 October 2026 (about 1 billion pounds a year), a 20 percent business rates cut for pubs and music venues in England and a bus fare cap. The manifesto locks on the main rates of income tax, employee National Insurance, VAT and corporation tax remain, the personal allowance is frozen until April 2031, and the fiscal rules have not been changed.
2.6 Politics
Mr Burnham was elected Labour leader unopposed on 17 July, after winning the Makerfield by-election in June. His first comments as Prime Minister referred to “flexibility” in the fiscal rules, which investors read as a hint of looser policy, and his 2025 remark about not being “in hock to the bond market” is well remembered. Polls have tightened: in late September YouGov had Reform UK on 25 percent, Labour 24 and the Conservatives 19, while Survation had Labour ahead, 29 to 23. The next general election is due by 2029, inside the horizon of this note. Table 1 summarises the starting point.
Table 1. The United Kingdom at a glance, October 2026
| Indicator | Latest | Period | Comparison |
|---|---|---|---|
| Real GDP growth, q/q | 0.5% | Q2 2026 | 0.6% in Q1; OBR 2026 forecast 1.1% |
| Real GDP, y/y | 1.8% | 3 months to Aug | 2.1% in August alone |
| CPI inflation | 3.5% | September | 3.1% in August; 2% target |
| Services CPI | 3.7% | September | 4.5% in March 2026 |
| Core CPI | 2.8% | September | 2.6% in August |
| Unemployment rate | 4.7% | 3 months to Aug | OBR 2026 peak 5.3% |
| Vacancies | 691,000 | 3 months to Sep | 824,000 average in 2019 |
| Regular pay growth | 3.7% | 3 months to Aug | Real: 0.6% (author) to 0.8% (ONS) |
| Bank Rate | 3.75% | since 18 Dec 2025 | 6-3 votes to hold in July and Sept |
| 10-year gilt yield | 5.44% | 20 October | 4.43% Feb average; 5.51% on 1 Oct |
| 30-year gilt yield | 6.03% | 1 October peak | Highest since January 1998 |
| Public sector net debt | 94.0% of GDP | end-September | GBP 3,005 bn |
| Borrowing, April to Sept | GBP 97.8 bn | FY 2026-27 | GBP 6.0 bn above OBR March forecast |
| Headroom, stability rule | about GBP 11 bn | October estimate (EY) | GBP 23.6 bn in March (OBR) |
Sources: ONS (GDP, labour market, CPI and public sector finances releases of 30 September, 15, 20 and 21 October 2026); Bank of England; Trading Economics; Reuters/LSEG; OBR Spring Forecast 2026; EY ITEM Club; calculations by the author.
A first look at the results
The full note goes much further, with original models, scenarios and a dashboard of leading indicators. Two of its 15 charts and diagrams are shown below.
Continue reading
Get the full note: 26 pages, 15 charts and diagrams, 8 tables
This page shows the first part of the note. The full PDF adds: is Britain in stagflation? An index for five economies; the supply side: why growth slowed after 2016; the policy trilemma; four paths to 2030; a dashboard of leading indicators; implications for policy and for investors; what to watch, October 2026 to mid-2027; conclusion.
29 USD, instant PDF download, secure card payment.
Buy the full noteNeed this analysis for your organisation?
We prepare confidential briefings, executive talks and studies on countries, markets and policies, built on the same method as this article.
Request a briefingSupport independent analysis
Our studies are free to read and carry no advertising. If this one was useful, a small contribution helps us publish the next.
Support our workGo further: books by Global Strategy Files

Frequently asked questions
Is the UK in stagflation in 2026?
In a mild form, yes. In September 2026 UK inflation was 3.5 percent while growth was modest and unemployment 4.7 percent. On the author’s index, France and Germany score higher today, but the United Kingdom is the only one of five large advanced economies to have combined growth below its pre-2016 pace with inflation more than half a point above target in every year from 2023 to 2026, so its stagflation is chronic rather than acute.
How much has Brexit slowed UK growth?
Between 2000 to 2007 and 2016 to 2025, UK growth slowed by 1.24 points a year, against 0.53 point for the average of the United States, France and Germany. The British-specific slowdown is therefore about 0.71 point a year. Mapping the estimates of Bloom and co-authors (NBER, 2025), which find GDP per head 6 to 8 percent lower by 2025, implies a drag of 0.56 to 0.75 point a year, most of the excess.
Why are UK gilt yields so high in 2026?
The ten-year gilt yield reached 5.51 percent on 1 October 2026 and the thirty-year yield 6.03 percent, the highest since 1998. The causes combine an energy shock that pushed inflation back up, a Bank of England close to raising rates, Bank gilt sales, a large index-linked share of debt and doubts about fiscal headroom ahead of the 28 October Budget. In September, UK yields were the highest of the five economies compared.
What are the scenarios for the UK economy to 2030?
The author sets four paths: muddle through (40 percent), with inflation back to 2 percent by 2030 and net debt near 94 percent of GDP; a gilt-led squeeze (25 percent), with near-recession in 2027 and 2028; inflationary drift (20 percent), with inflation above 3 percent until 2029; and a supply-side breakout (15 percent), with growth reaching 2.3 percent and debt falling below 90 percent of GDP.
Sources
- Office for National Statistics: GDP monthly estimate, UK: August 2026 (15 October 2026); GDP quarterly national accounts, April to June 2026, as reported by Trading Economics (30 September 2026); Business investment in the UK: April to June 2026 revised results; Labour market overview, October 2026 (20 October 2026), as reported by ITV and Trading Economics; Consumer price inflation, UK: September 2026 (21 October 2026), as reported by investingLive; Public sector finances, UK: September 2026 (21 October 2026); UK productivity introduction: April to June 2026 and January to March 2026; Growth accounting: multi-factor productivity estimates, UK (23 May 2025); release calendar entries for the GDP first quarterly estimate (12 November 2026) and quarterly national accounts (22 December 2026).
- ONS time series: D7G7, DKO8, D7NN, D7G8, KAI9, MGSX, AP2Y (retrieved 20 October 2026).
- ONS, component-based approach to measuring labour productivity (17 September 2026), as reported by Global Banking and Finance Review and Marginal Revolution (20 September 2026); Productivity Institute, “Q2 2026: Signs of UK productivity growth amid measurement uncertainty” and “The boom in the denominator”.
- Bank of England: Bankstats series IUMABEDR, IUMBV34, IUMBV42, CFMHSDE (retrieved 20 October 2026); Monetary Policy Summary and minutes, July and September 2026, as summarised by OrbitRemit and MTS Insights; decision of 18 December 2025 (Financial Reporter); Monetary Policy Committee dates for 2026 and 2027.
- Office for Budget Responsibility: Economic and fiscal outlook, March 2026 (Spring Forecast, 3 March 2026), as summarised by Ross Martin Tax Consultancy, ICAEW and HM Treasury (“Spring Forecast 2026: the right economic plan for Britain”, 3 March 2026); Brexit analysis (latest update October 2024).
- EY ITEM Club, UK pre-Budget fiscal outlook, October 2026. Investec, “Budget preview: do no harm” (20 October 2026). AJ Bell, “UK Treasury weighs smaller fiscal buffer to limit tax rises” (24 September 2026, citing the Financial Times). Mortgage Professional Adviser on gilts and the Budget (October 2026, citing Bloomberg).
- City AM, “Why Healey will miss a 25bn bonus from better productivity” (20 October 2026), including Deutsche Bank estimates.
- Reuters/LSEG via Brussels Signal, “UK borrowing costs rise to highest level since 1998” (1 October 2026). Trading Economics, UK government bond yield news (20 to 22 October 2026). investingLive on September CPI and market pricing (21 October 2026).
- Rathbones, “Burnham is prime minister, Healey Chancellor: what does this mean for investors?” (21 July 2026, updated 17 September 2026). Professional Adviser, “John Healey to deliver first Autumn Budget on 28 October” (3 August 2026). UK Tax Calculators, “Autumn Budget 2026: what’s on the mind of new Chancellor John Healey” (15 August 2026). Museum of the Prime Ministers, Andy Burnham. Al Jazeera, “The Burnham bounce” (30 September 2026).
- Bloom, N., Bunn, P., Mizen, P., Smietanka, P. and Thwaites, G., “The Economic Impact of Brexit”, NBER Working Paper 34459 (2025), and NBER Digest, February 2026. Centre for European Reform, Brexit cost estimate (June 2022).
- UK Government, UK-EU summit announcements (19 May 2025, via AJ Bell); Hogan Lovells, “From divergence to dynamic alignment: the UK-EU SPS agreement explained” (2 April 2026); Metro Global, UK-EU reset briefing (13 May 2026).
- Ofgem, “Energy price cap will rise by 4% from October 2026” (26 August 2026).
- Eurostat, EU trade in goods with the United Kingdom 2025 (via Sofia Globe, 22 June 2026). ONS trade figures for 2025 via Air Cargo Week.
- UK Debt Management Office, Quarterly Review (April to June 2026) and Financing Remit 2026-27.
- International Monetary Fund, World Economic Outlook and Fiscal Monitor, October 2026 (DataMapper: NGDP_RPCH, PCPIPCH, LUR, GGXWDG_NGDP, GGXONLB_G01_GDP_PT, GGXCNL_NGDP).
- World Bank, World Development Indicators: NE.GDI.FTOT.ZS, NY.GDP.MKTP.KD.ZG, SL.TLF.CACT.ZS, NY.GDP.PCAP.PP.KD, SP.POP.1564.TO, SP.POP.TOTL, SP.POP.65UP.TO.ZS.
- FRED, Federal Reserve Bank of St. Louis: CPIAUCSL, CPILFESL, UNRATE, CES0500000003, FEDFUNDS, ECBDFR, DCOILBRENTEU, IRLTLT01GBM156N, IRLTLT01USM156N, IRLTLT01CAM156N. ECB Data Portal (IRS dataflow, unemployment); Eurostat (prc_hicp_minr, lc_lci_r2_q); Bank of Canada Valet (STATIC_TOTALCPICHANGE, CPI_TRIM, CPI_MEDIAN, V39079); Statistics Canada (v2062815, v79311153).
- Data retrieved 20 October 2026; web sources consulted 20 to 24 October 2026.
Books from Global Strategy Files
Go further on this topic
The Tariff GambleHow America’s trade war is reshaping power, prices and prosperity.24.99 USD, see the book Future-Proofing AmericaEconomic challenges and the road to reform.20 USD, see the book
 Kill KennedyWhat the 2025 declassified files reveal about the machinery of American power.20 USD, see the book
