Pensions in a High-Rate World: Winners and Losers to 2035

Driss EFFINA, PhD Independent Researcher, Global Strategy Files Foresight, prospective note No. 14, 24 October 2026. Reading time: about 55 minutes
Key takeaways
- Real long yields in the five economies rose from an average of -0.30 percent in 2015 to 2019 to 2.35 percent in September 2026: in the author’s models, 100,000 now buys 24 to 47 percent more annuity income, and the contribution needed for a 25 percent replacement rate falls from 17.0 to 8.4 percent of pay.
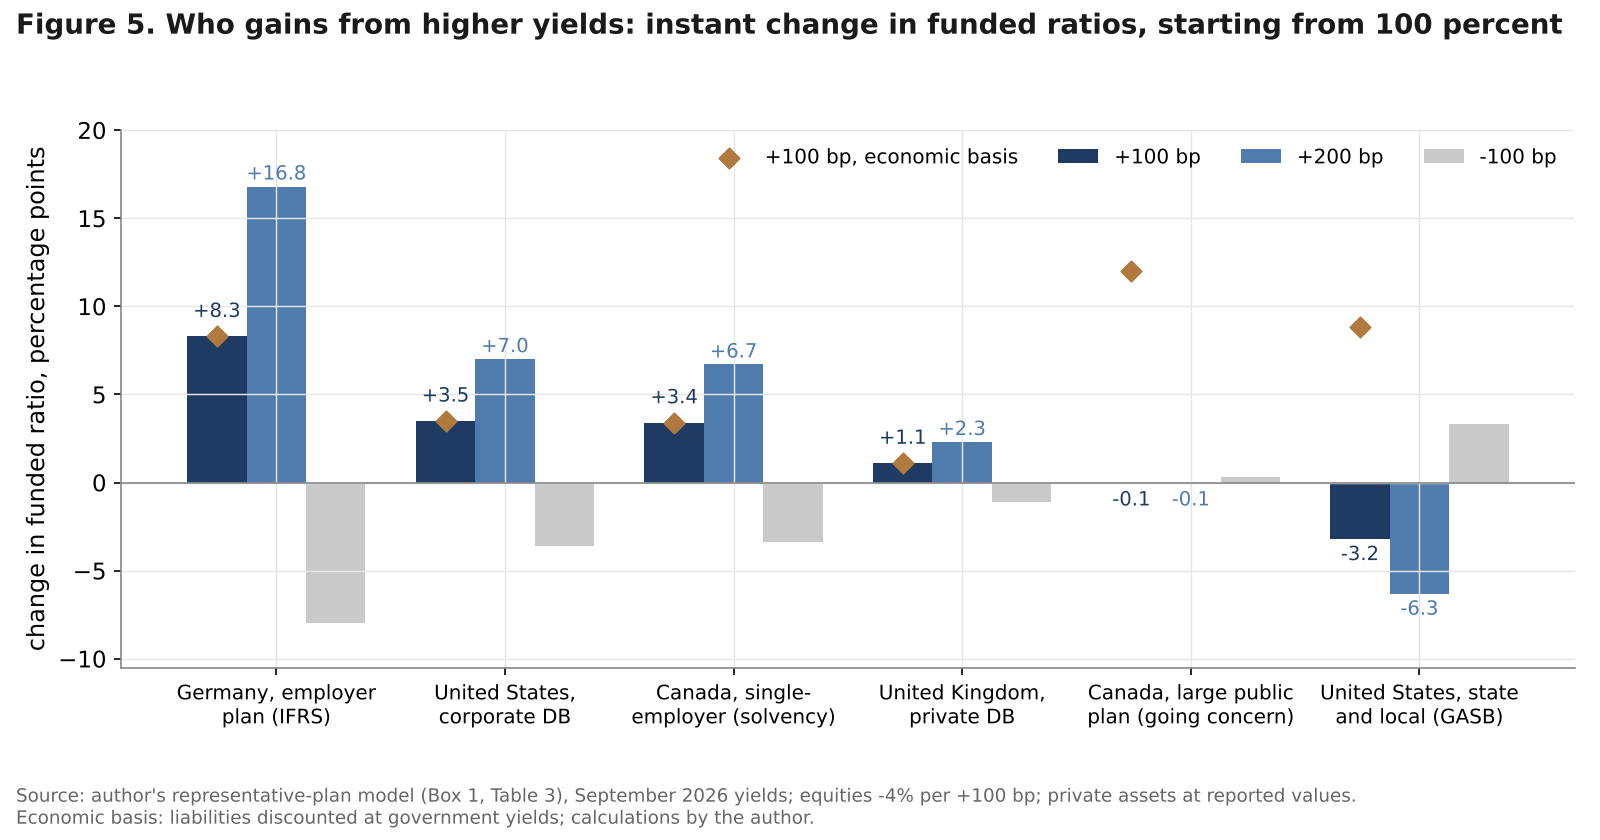
- Under-hedged sponsors win most: a 1 point rise in yields lifts funded ratios by 8.3 points for a German IFRS plan and 3.5 for a US corporate plan, against 1.1 for a 90 percent hedged UK scheme. US public plans report a loss of 3.2 points while their economic funded ratio rises by 8.8.
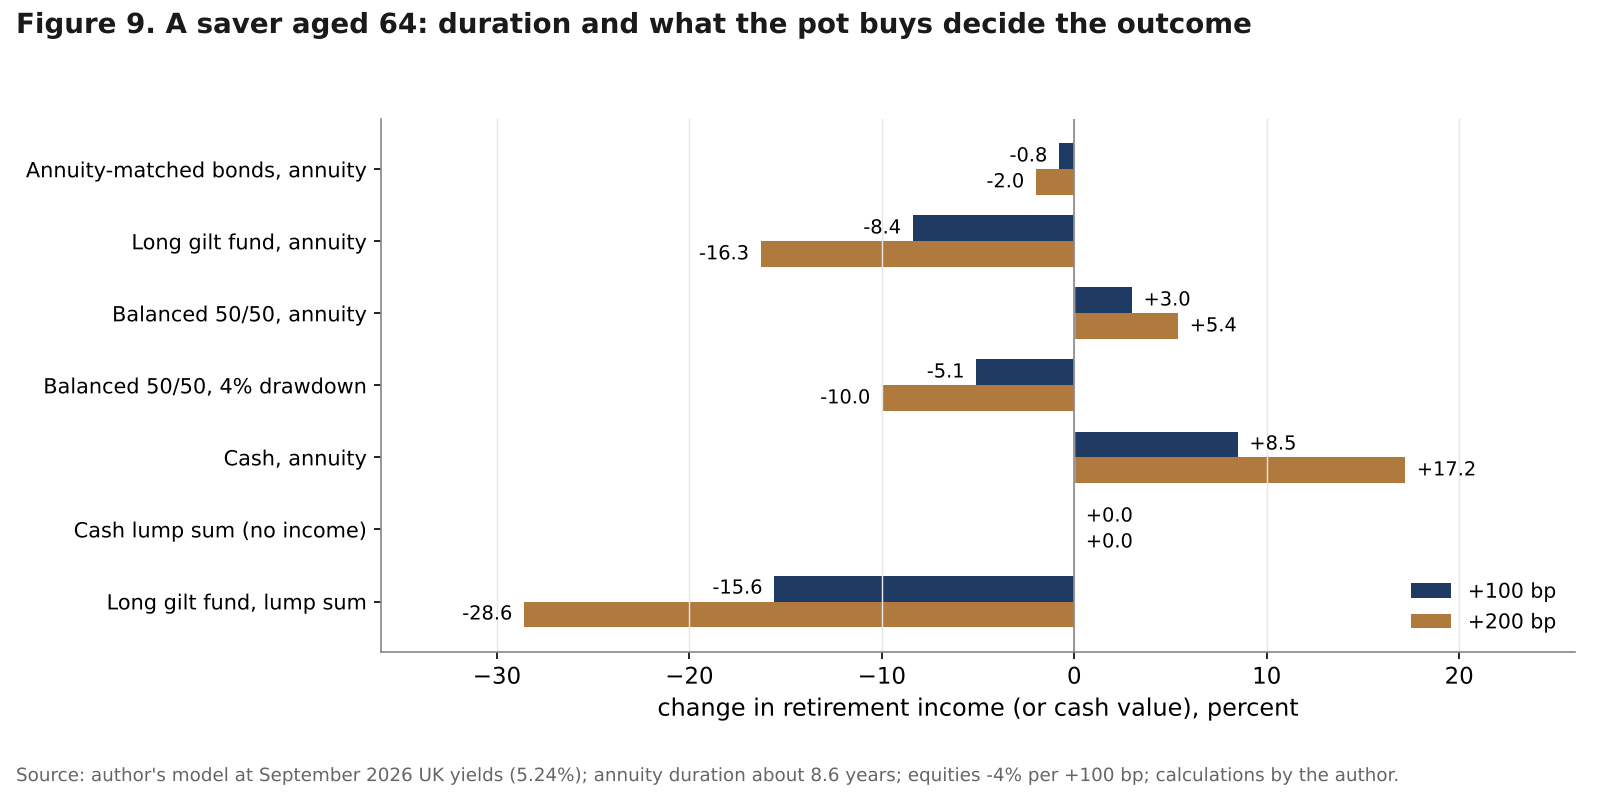
- The losers are savers who held long bonds without buying income (a 20-year bond lost 32 to 49 percent from its 2019 to 2020 peak), housing-rich retirees (equity release capacity down 39 to 53 percent since 2021) and non-indexed pensioners if inflation takes over.
- In the author’s scenarios, probability-weighted funded ratios rise by 1.8 to 14.7 points by 2035, but a reversal to low rates (15 percent probability) would cut German and large Canadian public plans to 82.5 and 89.9; liquidity calls and lagged private-market marks are the other risks.
Abstract
For fifteen years pension systems in the rich world were built around a single price: a real long-term interest rate close to zero. That price has gone. Across the United States, the United Kingdom, France, Germany and Canada, a simple proxy for the real ten-year yield averaged -0.30 percent in 2015 to 2019 and 2.35 percent in September 2026, after the 2026 oil shock pushed nominal ten-year yields to 4.99 percent in the United States and 5.24 percent in the United Kingdom. A rise of that size redistributes wealth between pension sponsors, savers, retirees and taxpayers on a scale that no pension reform of the last decade has matched. This note asks who gains, who loses, and what could reverse the outcome by 2035.
The note focuses on funded pensions and private savers rather than on public pay-as-you-go spending. It builds a duration-gap model of six representative defined-benefit systems on their own accounting bases; a stylised annuity and life-cycle model for savers; two original proxies for the slow-moving books of French life insurance savings and German book-reserve pensions; an equity-release model for housing-rich retirees; and a scenario model to 2035 built on the long-rate paths and probabilities of Foresight No. 6. All projections and probabilities are the author’s.
Keywords: pensions, defined benefit, defined contribution, funded ratio, duration gap, annuities, liability-driven investment, replacement rate, interest rates, scenarios, United States, United Kingdom, France, Germany, Canada
JEL codes: G22, G23, H55, J26, E43
Key findings
1. Higher real yields roughly double what saving buys. The real-yield proxy rose by 2.65 points between 2015 to 2019 and September 2026. In the author’s models, 100,000 buys 24 to 47 percent more annuity income at 65, and 30 years of saving 10 percent of pay buys a replacement rate of 29.8 percent instead of 14.7; the contribution needed for a 25 percent replacement rate falls from 17.0 to 8.4 percent of pay. 2. Under-hedged sponsors are the big winners, and the accounting decides who sees it. From full funding, a 1 point rise in yields lifts the funded ratio of a German IFRS plan by 8.3 points, a US corporate plan by 3.5 and a Canadian single-employer plan by 3.4, against 1.1 for a 90 percent hedged UK scheme; the break-even hedge ratio is 86 to 98 percent. US state and local plans report a loss of 3.2 points while their economic funded ratio rises by 8.8: a plan reporting 75 percent is 58 percent funded at Treasury yields, against 39 percent in 2015 to 2019. 3. The losers are savers who held duration without buying income, and retirees whose wealth is a house. From 2019 to 2020 peaks to September 2026, a 20-year government bond lost 32 to 49 percent in nominal terms and 45 to 59 percent in real terms. A UK saver who held long gilts and annuitised in September 2026 gets 99 percent of the income available in January 2019, against 176 percent for one who held cash. What a home can fund through equity release has fallen by 39 to 53 percent since 2021. 4. Part of the gain is still in the pipeline. French fonds euros and German commercial-code book reserves adjust to market yields over eight to ten years. The author’s French book-yield proxy stands 2.19 points below the ten-year OAT and the German book-reserve discount proxy 2.43 points below its market equivalent; in the central scenario German book-reserve liabilities fall by a further 27 percent by 2035 without any new rise in rates. 5. Liquidity and a reversal of rates are the main risks. A UK scheme hedging 90 percent of liabilities must find collateral of about 12.8 percent of its assets for a 250 basis point rise; private-market appraisal lags would overstate the funded ratio of a Canadian-style public plan by about 4 points in the first year of a 15 percent equity fall. In the author’s scenarios, probability-weighted funded ratios in 2035 range from 101.8 (UK) to 114.7 (Germany) with 2026 at 100, but the reversal scenario (15 percent probability) takes German and large Canadian public plans to 82.5 and 89.9.
1. Introduction
A pension is a promise priced at a rate of interest. When the rate is close to zero, the promise is expensive to keep and cheap to make: sponsors of defined-benefit plans see their liabilities swell, savers need very large pots to buy a modest income, and governments face little cost in leaving promises unfunded. When the rate rises, the arithmetic turns. The same promise costs less to keep, the same pot buys more income, and the cost of leaving promises unfunded becomes visible in interest bills.
Between 2012 and 2021 the first world prevailed. Long-term real rates were negative in most of Europe and close to zero in North America. UK schemes borrowed against gilts to hedge ever-growing liabilities, US public plans took more equity and private-market risk to reach assumed returns of around 7 percent, and German employers watched their pension provisions climb as discount rates fell.
The second world arrived in two steps. Inflation and monetary tightening lifted yields in 2022. Then the war involving Iran that began at the end of February 2026 disrupted traffic through the Strait of Hormuz, Brent averaged about 127 dollars a barrel in the first half of October, and long yields moved up again. By September 2026 ten-year yields were 4.99 percent in the United States, 5.24 percent in the United Kingdom, 4.44 percent in France, 3.47 percent in Germany and 3.88 percent in Canada. Foresight No. 6 asked whether this level is structural, and concluded that a return to the cheap duration of the 2010s is a tail scenario. This note takes that conclusion as its starting point and asks a different question: in a world of higher long rates, who wins and who loses among pension funds, savers and retirees?
The answer depends less on the size of the rise than on three features of each balance sheet: the duration gap between assets and liabilities, the accounting basis, which decides whether an economic gain is reported, and what the saver does with the pot (buy an income, draw it down or cash it in). Figure 1 sets out the transmission channels that the rest of the note quantifies.
Section 2 measures the high-rate world, Section 3 describes the five systems, Sections 4 and 5 build and apply the duration-gap model, Section 6 turns to savers, Section 7 to the slow-moving books of France and Germany, Section 8 to the risks and Section 9 to the losers outside the funds. Section 10 brings the results together; Sections 11 to 15 present scenarios, a dashboard, implications, a calendar and conclusions.
2. The high-rate world in numbers
2.1 Long and real yields
Figure 2 places the 2026 level of long rates in a 36-year perspective. Panel (a) shows the long decline of nominal yields from 1990 to 2020 and the reversal since. In September 2026 the ten-year yield was the highest monthly average since 2007 in the United Kingdom, since 2008 in France and since 2009 in Germany. The long end of the curve is higher still: in mid-October 2026 the American 30-year Treasury yielded 5.43 percent, the British 20-year gilt 5.87 percent, the German 30-year Bund 3.88 percent and the Canadian long benchmark 4.18 percent.
What matters for retirement finance is the real yield. Among inflation-indexed bonds, the data used here cover only US TIPS: the ten-year TIPS yield was 2.78 percent on 15 October 2026, against 1.72 percent just before the war. For all five countries the note uses a proxy, the ten-year yield minus IMF expected inflation for 2026, or minus average core inflation for 2015 to 2019. The proxy is rough, but its direction and size are not in doubt (Table 1).
Table 1. Nominal and real ten-year yields, percent
| 2015 to 2019 | 2021 | Feb 2026 | Sep 2026 | Real proxy 2015 to 2019 | Real proxy Sep 2026 | Change in real proxy | |
|---|---|---|---|---|---|---|---|
| United States | 2.27 | 1.44 | 4.13 | 4.99 | 0.17 | 2.93 | +2.76 |
| United Kingdom | 1.37 | 0.79 | 4.43 | 5.24 | -0.35 | 3.16 | +3.51 |
| France | 0.61 | 0.01 | 3.40 | 4.44 | -0.05 | 2.47 | +2.52 |
| Germany | 0.21 | -0.37 | 2.74 | 3.47 | -1.18 | 1.33 | +2.51 |
| Canada | 1.69 | 1.36 | 3.29 | 3.88 | -0.10 | 1.84 | +1.94 |
| Average of five | -0.30 | 2.35 | +2.65 |
Sources: FRED (OECD long-term interest rates), ECB, Bank of England, Bank of Canada; core inflation from BLS, ONS, Eurostat and Bank of Canada (trimmed mean); expected inflation from the IMF World Economic Outlook, October 2026; calculations by the author.
The rise in real yields, 1.9 to 3.5 points, is larger than any change in pension parameters legislated since 2010, it is broad, and it is concentrated at the long end, where pension liabilities sit. For a promise with a duration of 15 to 20 years, a 2.65 point rise in the real discount rate cuts the present value by a third or more.
2.2 The bill for bond holders
The other side of the coin is the loss suffered by those who held long bonds when yields rose. Figure 3 reconstructs the total return of a constant-maturity ten-year government bond in each country from monthly yields, and of a 20-year bond priced off the same yields, a proxy for the long-duration bond funds that pension savers hold near retirement.
From the peaks of July 2020 (United States, United Kingdom, Canada) and August 2019 (France, Germany) to September 2026, the ten-year bond lost 12.8 percent in Canada, 16.5 percent in the United States, 22.0 percent in the United Kingdom, 25.3 percent in Germany and 26.0 percent in France, coupons included. The 20-year bond lost between 32.2 percent (Canada) and 48.7 percent (France) in nominal terms. In real terms, after cumulative inflation of 22 to 32 percent, the losses were 45 to 59 percent. The 2026 shock alone, from February to September, took a further 2.8 to 6.1 percent off the ten-year bond.
These are very large losses for an asset class held for its safety. Whether they were losses in a meaningful sense depends on what the bonds were for, the subject of Sections 4 to 6.
A first look at the results
The full note goes much further, with original models, scenarios and a dashboard of leading indicators. Two of its 15 charts and diagrams are shown below.
Continue reading
Get the full note: 28 pages, 15 charts and diagrams, 11 tables
This page shows the first part of the note. The full PDF adds: five systems, three ways of valuing a promise; the duration-gap model; accounting versus economics: the plans that hide their gain; savers and retirees; slow-moving books: French savings and German reserves; the risks: liquidity, private valuations and a reversal; losers outside the funds: housing-rich retirees and taxpayers; winners and losers: a matrix; four scenarios to 2035.
29 USD, instant PDF download, secure card payment.
Buy the full noteNeed this analysis for your organisation?
We prepare confidential briefings, executive talks and studies on countries, markets and policies, built on the same method as this article.
Request a briefingSupport independent analysis
Our studies are free to read and carry no advertising. If this one was useful, a small contribution helps us publish the next.
Support our workGo further: books by Global Strategy Files

Frequently asked questions
Do higher interest rates help or hurt pension funds?
They help most defined-benefit plans valued at market rates, because liabilities fall faster than assets. In the author’s model a 1 point rise lifts funded ratios by 8.3 points for a German employer plan, 3.5 for a US corporate plan and 1.1 for a heavily hedged UK scheme. Plans that discount at a fixed assumed return, such as US state and local plans, report a loss even though their economic position improves.
Is now a good time to buy an annuity?
Higher yields make annuities much cheaper. In the author’s model, the income that 100,000 buys at 65 is 24 to 47 percent higher at September 2026 yields than at 2015 to 2019 yields, and each further 100 basis point rise adds about 8.5 percent. The main risk of waiting is a fall in rates: in a reversal scenario, UK model annuity income in 2035 would be 6,682 instead of 8,262 per 100,000.
Who loses when bond yields rise?
Savers who held long bonds and then took cash or drew down at a fixed rate lost most: a 20-year government bond lost 32 to 49 percent in nominal terms from its 2019 to 2020 peak to September 2026. Housing-rich, cash-poor retirees also lose, as higher loan rates and lower real house prices have cut equity release capacity by 39 to 53 percent since 2021. Non-indexed pensioners lose if inflation drives rates.
What are the main risks for pensions to 2035?
Three risks stand out. A liquidity squeeze: a UK scheme hedging 90 percent of liabilities needs collateral of about 12.8 percent of assets for a 250 basis point rise. Lagged private-market valuations, which can overstate funded ratios by about 4 points after an equity fall. And a return to low rates, a 15 percent probability scenario in which most of today’s winners become losers.
Sources
- Federal Reserve Economic Data (FRED), Federal Reserve Bank of St. Louis: IRLTLT01USM156N, IRLTLT01GBM156N, IRLTLT01CAM156N (OECD long-term interest rates), DGS10, DGS30, DFII10, T10YIE, T5YIE, BAMLH0A0HYM2, DCOILBRENTEU, MORTGAGE30US, CPIAUCSL, CPILFESL, QUSR628BIS, QGBR628BIS, QFRR628BIS, QDER628BIS, QCAR628BIS (BIS residential property prices). Retrieved 20 October 2026.
- European Central Bank, Data Portal: long-term interest rates for convergence purposes (ten-year yields, France and Germany, January 2007 to September 2026); MFI interest rate statistics (composite cost of borrowing for house purchase, France and Germany). Retrieved 20 and 21 October 2026.
- Eurostat, HICP (prc_hicp_minr): all items and core, France and Germany. Retrieved 20 October 2026.
- Bank of England, Database: IUMABEDR (Bank Rate), IUMBV42 (five-year fixed mortgage rate, 75 percent LTV); gilt yields. Retrieved 20 October 2026.
- Office for National Statistics: D7G7 (CPI), DKO8 (CPI excluding energy, food, alcohol and tobacco). Retrieved 20 October 2026.
- Bank of Canada, Valet API: V41690973 (CPI), CPI_TRIM, V80691335 (posted five-year mortgage rate), benchmark bond yields. Retrieved 20 October 2026.
- Deutsche Bundesbank, yields on listed federal securities (30-year). Retrieved October 2026.
- International Monetary Fund, World Economic Outlook, October 2026 (DataMapper: PCPIPCH). Retrieved 20 October 2026.
- Global Strategy Files, Foresight No. 6, “The End of Cheap Duration: Long-Term Interest Rate Scenarios to 2035”, 24 October 2026 (yield paths, probabilities, long-end data); Foresight No. 1, “The Ageing Bill”.
- Office for Budget Responsibility, on private defined-benefit scheme holdings of gilts (52 percent of assets at end-2024), as cited in Decoded No. 10.
- Bank of England, Financial Stability Report, December 2022, and Financial Policy Committee record, March 2023 (LDI resilience); Bank of England market notices on the temporary purchase of long-dated gilts, 28 September to 14 October 2022.
- HM Treasury, “Mansion House Accord”, May 2025.
- UK Department for Work and Pensions, Pension Schemes Bill, introduced June 2025.
- Governmental Accounting Standards Board, Statements No. 67 and No. 68; Financial Accounting Standards Board, ASC 715; IASB, IAS 19 Employee Benefits.
- German Commercial Code (HGB), section 253 (discounting of pension provisions at a ten-year average rate).
- United States Congress, SECURE 2.0 Act of 2022 (automatic enrolment for new plans).
- Loi de financement de la securite sociale pour 2026 (France), adopted December 2025; loi PACTE of 22 May 2019 (plan d’epargne retraite).
- Bundesregierung, Rentenpaket 2025, adopted by the Bundestag on 5 December 2025 and approved by the Bundesrat on 19 December 2025; coalition agreement of CDU, CSU and SPD, 2025 (Frühstart-Rente).
- ING Think, “Dutch pension reforms are bumping up rates from the long end”, 10 December 2025.
- Federal Reserve, ECB, Bank of England and Bank of Canada meeting calendars for 2026 and 2027; UK Budget date of 28 October 2026.
Books from Global Strategy Files
Go further on this topic