
Fiscal Dominance Watch: When Debt Starts to Steer Central Banks, Scenarios to 2032

Driss EFFINA, PhD Independent Researcher, Global Strategy Files Foresight, prospective note No. 15, 24 October 2026. Reading time: about 55 minutes
Key takeaways
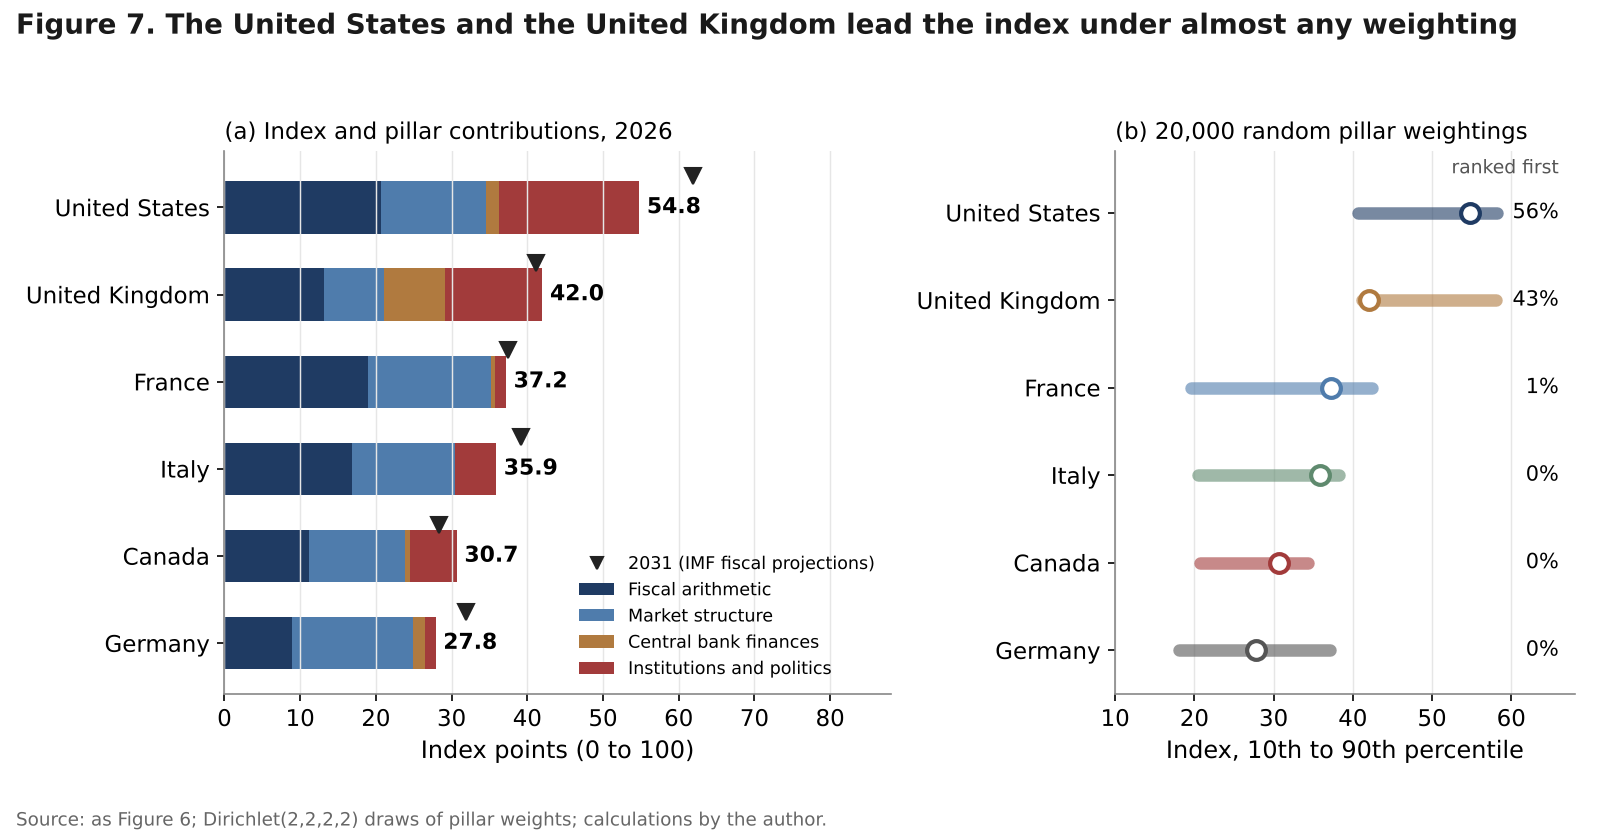
- On a ten-component Fiscal Dominance Risk Index (0 to 100), the United States scores 54.8 and the United Kingdom 42.0, ahead of France (37.2), Italy (35.9), Canada (30.7) and Germany (27.8); the two lead in 89.3 percent of 20,000 random weightings.
- The new channels are institutional and financial: 12.5 of the 19.2-point rise in the American score since 2019 comes from documented political pressure, and the UK Treasury has paid 102.6 billion pounds (3.21 percent of GDP) to cover Bank of England QE losses since 2022.
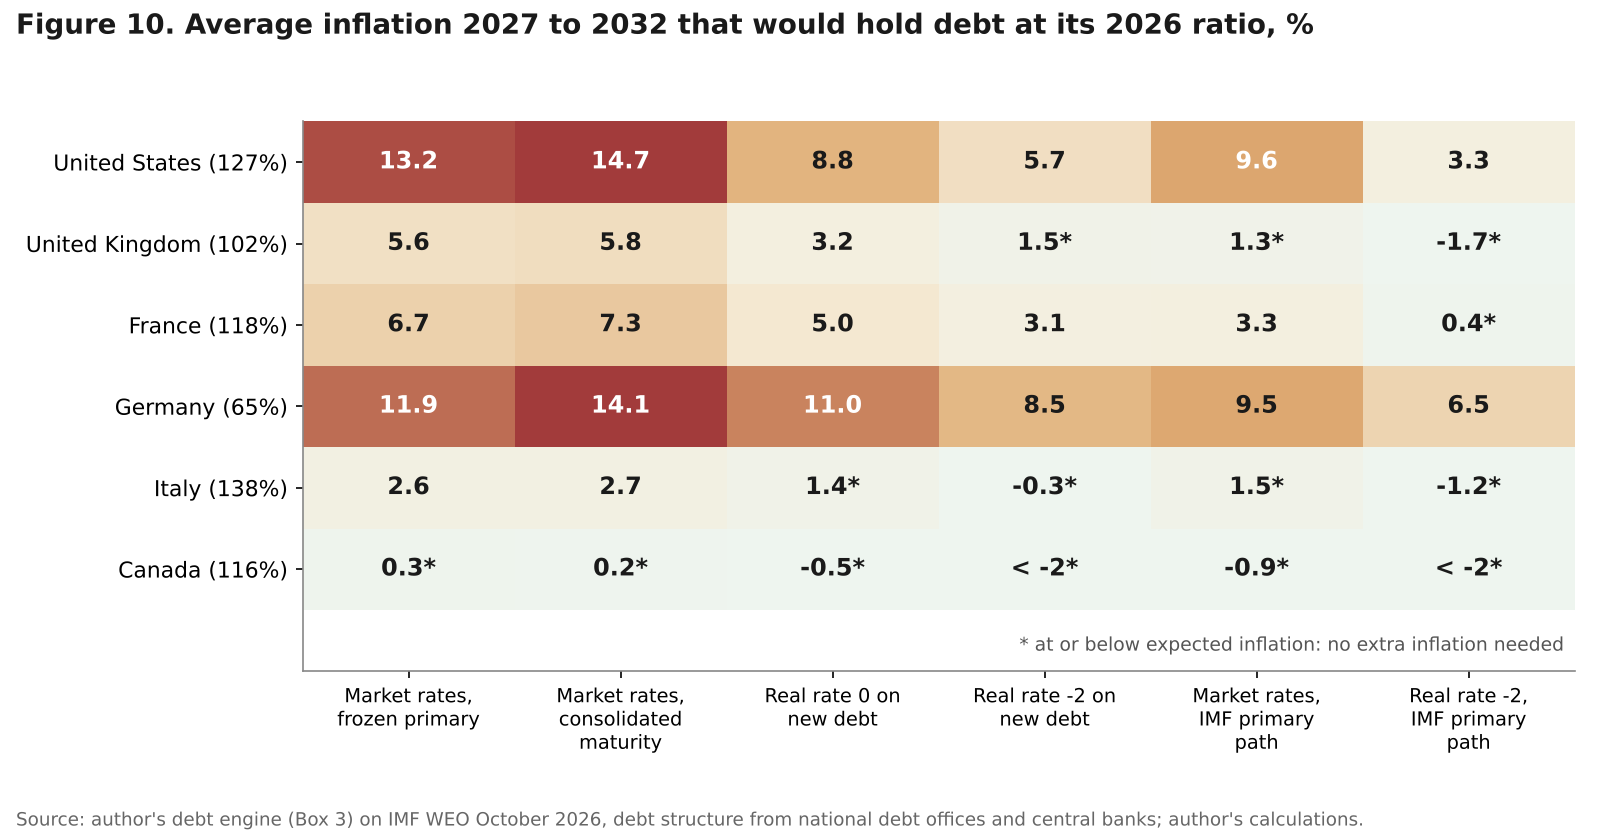
- Inflating debt away fails at market rates: holding 2026 debt ratios to 2032 without fiscal adjustment would take average inflation of 13.2 percent in the United States, 6.7 in France and 5.6 in the United Kingdom, against 5.7, 3.1 and 1.5 percent with 1940s-style real rates of minus 2 percent.
- In the author’s scenarios quiet repression (37 percent) is the most likely path: inflation of 2.5 to 3.0 percent a year to 2032 and a transfer from savers to treasuries in place of fiscal adjustment; open dominance (12 percent) would cut US debt by only 10.9 points at 5.0 percent inflation.
Abstract
For forty years the rich world ran on a simple division of labour: governments chose deficits, central banks chose interest rates, and the second did not bend to the first. Three developments now test that arrangement at once. Public debt is close to post-war highs and interest bills are rising faster than revenue; central banks hold between 9 and 26 percent of their governments’ debt after a decade of quantitative easing and have lost money on it; and in 2025 and 2026 the independence of the Federal Reserve was tested by a removal attempt, grand jury subpoenas and a Supreme Court case. The question is no longer whether fiscal dominance is possible in advanced economies, but how close each is to it, through which channel it would come, and what it would cost.
This note answers for the United States, the United Kingdom, Canada and the euro area, with France, Germany and Italy as context. It goes wider and further than the American indicator of Decoded No. 7 and the interest-bill projections of Foresight No. 7. It builds a cross-country Fiscal Dominance Risk Index of ten components, benchmarks today against four historical episodes, computes with a debt engine the inflation that would stabilise each debt ratio if primary balances do not adjust, and sets out four scenarios to 2032 with probabilities, a dashboard and implications for policy, investors and households. All projections and probabilities are the author’s.
Keywords: fiscal dominance, central bank independence, public debt, quantitative tightening, central bank losses, financial repression, inflation, Transmission Protection Instrument, scenarios, United States, United Kingdom, euro area, Canada
JEL codes: E58, E62, E63, H63, E31, G12
Key findings
1. Pressure is building, not binding, and it is highest in the United States and the United Kingdom. On the author’s index (0 to 100), the United States scores 54.8, the United Kingdom 42.0, France 37.2, Italy 35.9, Canada 30.7 and Germany 27.8. Under 20,000 random weightings the United States ranks first in 56 percent of draws, the United Kingdom in 43 percent, and the two take the top two places in 89.3 percent. On IMF fiscal projections the American score rises to 61.9 by 2031. 2. The new channels are institutional and financial, not the printing press. Of the 19.2-point rise in the American score since 2019, 12.5 points come from documented political pressure; the courts held. The British weak point is the balance sheet: the Treasury has paid 102.6 billion pounds (3.21 percent of GDP) to the Bank of England’s Asset Purchase Facility since 2022, and is considering routing future gilt sales to its own Debt Management Office. The Fed’s deferred asset is 4.9 times its capital, and quantitative easing has shortened the consolidated maturity of US debt from 5.9 to 5.1 years. 3. Inflating debt away does not work at market interest rates. To hold debt at its 2026 ratio until 2032 with primary balances frozen, inflation would have to average 13.2 percent in the United States, 6.7 percent in France and 5.6 percent in the United Kingdom if markets price new debt; with real rates held at minus 2 percent, as in the 1940s, 5.7, 3.1 and 1.5 percent. Fiscal dominance, if it comes, will take the form of financial repression, visible in balance sheets and regulation before policy rates. 4. History says today’s danger is political, not legal. De jure independence is far stronger than in past episodes (0.61 for the Fed and 0.91 for the ECB on the Romelli index, against 0.18 for the Bank of England in 1975 and 0.35 for the Bank of Italy in 1980). Under the American rate peg, the rise in prices accounted for 53 percent of the fall in the debt ratio between 1946 and 1951; after Italy ended monetary financing in 1981, debt doubled to about 120 percent of GDP by 1994. 5. Quiet repression is the most likely path, and it buys less than it costs. The author assigns 37 percent to quiet repression, 33 percent to a holding firewall, 18 percent to market discipline and 12 percent to open dominance. Probability-weighted debt in 2032 is 148 percent of GDP in the United States, 127 in France and 104 in the United Kingdom, with average inflation of 2.5 to 3.0 percent. Open dominance would cut American debt by only 10.9 points against the firewall path, at 5.0 percent inflation and an 8.7 percent real loss on cash.
1. Introduction
Fiscal dominance describes a regime in which the needs of the budget, not the inflation target, set the course of monetary policy: the central bank keeps interest rates lower, or buys more government debt, than price stability would justify, because the alternative would make the debt unsustainable or the bond market disorderly. Since the early 1980s the idea belonged to emerging markets and economic history.
Three developments have reopened it. The first is arithmetic: general government debt stands at 126.8 percent of GDP in the United States, 118.5 percent in France and 137.9 percent in Italy in 2026 on IMF figures, and American net interest has risen from 2.27 to 3.58 percent of GDP since 2019. The second is plumbing: quantitative easing left central banks holding large shares of government debt financed by reserves that pay the policy rate, so higher rates turned their profits into losses that land on treasuries. The third is politics: between April 2025 and June 2026 the President of the United States called for the Fed Chair’s termination, attempted to remove a governor, saw the Justice Department subpoena the Fed and lost the removal case in the Supreme Court; in Italy a budget amendment on the central bank’s gold drew an ECB opinion; in the United Kingdom the Treasury and the Bank redesigned the end of quantitative tightening.
None of this amounts to fiscal dominance. In September 2026 the Fed raised rates by a quarter point into a federal deficit of about 2 trillion dollars, the ECB had raised its deposit rate twice since June, and the Bank of England kept shrinking its gilt holdings. The question is how far each economy is from the line, through which channel it would cross it, and what that would mean by 2032. Figure 1 sets out four channels and the firewalls in their way.
Section 2 defines the concept, Sections 3 to 5 review the fiscal arithmetic, the central bank plumbing and the political record, Section 6 builds the index, Section 7 compares today with history, Section 8 computes the inflation needed to stabilise debt, and Sections 9 to 12 present scenarios, a dashboard, implications and a calendar.
2. What fiscal dominance is, and how to recognise it
Sargent and Wallace (1981) showed in “Some Unpleasant Monetarist Arithmetic” that if the fiscal authority fixes a path of deficits and the public’s appetite for debt is limited, the central bank cannot control inflation for ever: tight money today raises debt and interest, so more money must be printed later. Leeper (1991) generalised the point. A policy is “active” if it pursues its own objective regardless of the other authority, “passive” if it adjusts to stabilise the system. Price stability requires an active central bank and a passive treasury that raises primary surpluses when debt rises; if the treasury is active, the central bank must accept the inflation that balances the budget. The fiscal theory of the price level (Sims, 1994; Woodford, 1995; Cochrane, 2023) adds that when surpluses do not respond to debt, the price level adjusts so that the real value of debt equals the present value of expected surpluses.
Two empirical strands measure the outcome. Reinhart and Sbrancia (2011) found that real interest rates in advanced economies were negative about half the time between 1945 and 1980, and that this “liquidation” of debt amounted to 3 to 4 percent of GDP a year in the United States and the United Kingdom. Bolhuis, Koosakul and Shenai (2024), at the IMF, define a “fiscal r-star”, the real rate that stabilises debt given primary balances; over 140 years and 16 economies, a wide gap between monetary and fiscal r-star is associated with rising debt, higher inflation and financial repression, and they judge current tensions to be at historic highs. The BIS Annual Economic Report of June 2026 adds a market dimension: non-banks now hold 53 percent of advanced-economy sovereign debt, up from 44 percent in 2021, while domestic central banks’ share fell from 27 to 17 percent over 2022 to 2025, so stress spreads faster. It concludes that “central bank independence is therefore essential” and that backstops should remain “temporary, targeted and reversible”.
Table 1. Five strands of thinking about fiscal dominance and their use in this note
| Strand | Core idea | Observable signature | Use in this note |
|---|---|---|---|
| Sargent and Wallace (1981) | Fixed deficits and a debt limit force money creation later | Rising debt with sticky primary deficits; central bank purchases | Fiscal pillar of the index |
| Leeper (1991); fiscal theory (Sims 1994, Woodford 1995, Cochrane 2023) | Active fiscal policy makes inflation a fiscal outcome | Primary balances that ignore debt | Required-inflation engine |
| Reinhart and Sbrancia (2011) | Debt liquidated by negative real rates under repression | Negative real yields, captive demand, rate caps | Repression regimes; history |
| IMF fiscal r-star (Bolhuis, Koosakul and Shenai 2024) | Gap between monetary and fiscal r-star measures tension | Interest rate minus growth | r minus g component; scenarios |
| BIS Annual Economic Report 2026, chapter II | Non-bank holders speed stress; backstops create moral hazard | Market dysfunction; backstop conditions | Market structure pillar; dashboard |
Sources: as listed in the Sources section; classification by the author.
Box 1. Four channels and their signatures
In advanced economies, where direct monetary financing is restricted by law (in the euro area by Article 123 of the Treaty on the Functioning of the European Union), fiscal dominance would not arrive by decree. It would come through four channels that can be watched separately. Rate channel: the policy rate is held below what the central bank’s own reaction function prescribes. Balance-sheet channel: quantitative tightening slows or stops, purchases resume or lengthen, backstops lose their conditions, or asset sales are routed to the treasury; the signature is in weekly balance sheets and market notices. Financial channel: losses, lost remittances and interest on bank reserves become a political issue; the signature is proposals on reserve remuneration, capital or profit transfers. Institutional channel: appointments, removals and mandate changes; the signature is litigation, legislation and votes. The index scores the last three directly and treats the first as an outcome.
A first look at the results
The full note goes much further, with original models, scenarios and a dashboard of leading indicators. Two of its 14 charts and diagrams are shown below.
Continue reading
Get the full note: 26 pages, 14 charts and diagrams, 14 tables
This page shows the first part of the note. The full PDF adds: the fiscal arithmetic in 2026; the plumbing: balance sheets, losses and backstops; political pressure, 2025 to 2026: a factual record; a Fiscal Dominance Risk Index; history as a benchmark; the inflation it would take; four scenarios to 2032; leading indicators dashboard; implications for policy and for investors.
29 USD, instant PDF download, secure card payment.
Buy the full noteNeed this analysis for your organisation?
We prepare confidential briefings, executive talks and studies on countries, markets and policies, built on the same method as this article.
Request a briefingSupport independent analysis
Our studies are free to read and carry no advertising. If this one was useful, a small contribution helps us publish the next.
Support our workGo further: books by Global Strategy Files

Frequently asked questions
What is fiscal dominance?
Fiscal dominance is a regime in which the needs of the government budget, rather than the inflation target, drive monetary policy. The central bank keeps interest rates lower or buys more government debt than price stability requires, because tighter policy would make public debt unsustainable or bond markets disorderly. The idea goes back to Sargent and Wallace (1981) and Leeper (1991). In advanced economies it would arrive through balance sheets, losses and institutions rather than direct money printing.
Which country is most at risk of fiscal dominance in 2026?
On the author’s Fiscal Dominance Risk Index, the United States is most exposed with 54.8 points out of 100, followed by the United Kingdom with 42.0. The American score reflects a primary deficit of 4.92 percent of GDP, short debt maturity and documented political pressure on the Federal Reserve. The British score reflects Bank of England losses covered by the Treasury and weaker de jure independence. France, Italy, Canada and Germany score between 27.8 and 37.2.
Can governments inflate their debt away?
Only with financial repression. The author’s debt engine shows that holding debt ratios at their 2026 level to 2032 without fiscal adjustment would require average inflation of 13.2 percent in the United States if markets price new debt, since most debt is refinanced. If real rates on new debt were held at minus 2 percent, as in the 1940s, 5.7 percent would suffice. Each extra point of inflation removes only 2.7 to 3.3 points of debt per 100.
How can investors protect themselves against fiscal dominance?
Inflation-linked bonds are the most direct hedge. In the author’s scenarios, US inflation-linked Treasuries beat nominal bonds by a probability-weighted 0.72 percentage points a year over five years against a 5-year breakeven of 2.36 percent, with large gains in repression scenarios. Short nominal duration, gold and diversification away from a currency whose central bank is under pressure are complementary hedges. Sovereign spreads, especially in France and long gilts, are the early warning signals.
Sources
- Acalin, J. and Ball, L. (2023), “Did the U.S. Really Grow Out of Its World War II Debt?”, NBER Working Paper 31577.
- Agence France Trésor, Bulletin mensuel, August 2026.
- ANSA, “ECB tells govt to reconsider measure on BoI’s gold” (3 December 2025); “Budget amendment on Bank of Italy’s gold reserves reformulated” (15 December 2025).
- Axios, “Supreme Court says Trump can’t fire Fed governor Lisa Cook” (29 June 2026); Congressional Research Service, LSB11449, “Trump v. Cook and For-Cause Removal of Federal Reserve Governors” (July 2026).
- Bank for International Settlements, Annual Economic Report 2026, chapter II, “High public debt and shifting financial markets: challenges for central banks” (28 June 2026).
- Bank of Canada, Quarterly Financial Report, Q2 2026; “Bank of Canada holdings” (23 October 2026); press release on the end of quantitative tightening (29 January 2025).
- Bank of England, APF Gilt Sales Market Notices of 18 September 2025 and 17 September 2026; APF Annual Report and Accounts 2025/26.
- Banque de France, “Émission et détention de titres français, 2026-Q2”; “Net profit of EUR 8.1 billion, enabling the clearing of losses carried forward” (25 March 2026).
- Bastasin, C., Mischitelli, M. and Toniolo, G. (2019), “Living with high public debt: Italy 1861-2018”, LUISS SEP Working Paper 11/2019.
- Bloomberg, “Trump says Powell’s termination can’t come fast enough” (17 April 2025).
- Bolhuis, M. A., Koosakul, J. and Shenai, N. (2024), “Fiscal R-Star: Fiscal-Monetary Tensions and Implications for Policy”, IMF Working Paper.
- Bond Buyer, “Stephen Miran confirmed to Fed board” (September 2025).
- Bundesbank, press releases on general government debt in 2025 and on the 2025 annual result; Brussels Signal on the 2024 loss (February 2025).
- Bureau of Labor Statistics, historical CPI-U annual averages.
- Cochrane, J. H. (2023), The Fiscal Theory of the Price Level, Princeton University Press.
- Congressional Budget Office, Monthly Budget Review: September 2026.
- Deutsches Steuerzahlerinstitut, DSi kompakt Nr. 46, creditors of German public debt.
- European Central Bank, annual accounts 2025 press release (26 February 2026); APP and PEPP holdings by jurisdiction (September 2026); TPI press release (21 July 2022).
- Federal Reserve Board, FOMC statements and implementation notes, 2025 and 2026; H.4.1 (15 October 2026); Federal Reserve History, “The Treasury-Fed Accord”.
- Finance Canada, Fall Update 2026, Annex 3; Debt Management Report 2024-25.
- First Trust Portfolios, “Fed Q1 2026 financials” (11 June 2026) and “Q2 Fed financials: slow progress” (3 September 2026).
- FRED: FYPUGDA188S, PSDOTUKA, FPCPITOTLZGGBR, FPCPITOTLZGITA, FEDFUNDS, ECBDFR, T5YIE, DCOILBRENTEU, THREEFYTP10, DFII10 and long-term government bond yields (retrieved 20 October 2026).
- HM Treasury, letter from the Chancellor to the Governor on the APF (17 September 2026).
- INSEE, public debt at the end of Q2 2026 (September 2026).
- International Monetary Fund, WEO and Fiscal Monitor databases, October 2026 (GGXWDG_NGDP, GGXCNL_NGDP, GGXONLB_G01_GDP_PT, GGR_G01_GDP_PT, NGDP_RPCH, PCPIPCH); Public Finances in Modern History.
- Il Sole 24 Ore and Money.it on Italian debt holders (2026); QuiFinanza on the Bank of Italy 2025 result; Teleborsa, Italian securities outstanding (9 October 2026).
- iTiger, French-German spread report (3 October 2026); The Star, “Fed extends pause on reserve management purchases” (16 September 2026); Newsquawk and ROIC, New York Fed purchase schedule (14 October 2026).
- Japan Ministry of Finance, JGB Investor Presentation (August 2026); Investinglive on the Bank of Japan taper (2 June 2026).
- Leeper, E. M. (1991), “Equilibria under ‘active’ and ‘passive’ monetary and fiscal policies”, Journal of Monetary Economics 27(1).
- NPR, “DOJ subpoenas the Federal Reserve” (11 January 2026); Associated Press via Industrial Distribution, “Judge quashes subpoenas” (16 March 2026).
- Reinhart, C. M. and Sbrancia, M. B. (2011), “The Liquidation of Government Debt”, NBER Working Paper 16893.
- Reuters and City AM on Reform UK’s reserves proposal (June 2024).
- Romelli, D. (2022), Economic Policy 37(112); Romelli, D. (2025), “Trends in central bank independence: a de-jure perspective”; CBIE dataset (cbidata.org).
- Sargent, T. J. and Wallace, N. (1981), “Some Unpleasant Monetarist Arithmetic”, Federal Reserve Bank of Minneapolis Quarterly Review 5(3).
- Sims, C. A. (1994), Economic Theory 4(3); Woodford, M. (1995), Carnegie-Rochester Conference Series on Public Policy 43.
- Startmag, on the 1981 Treasury and Bank of Italy divorce.
- Treasury and Risk (Bloomberg), “Powell will stay on at the Fed” (29 April 2026); IDN Financials (2026).
- UK Debt Management Office, Quarterly Review, April to June 2026; US Government Accountability Office, GAO-26-107529; US Treasury, debt at end of fiscal 2026.
- Global Strategy Files: Decoded No. 7 and No. 10; Foresight No. 4, No. 6 and No. 7.
- All data retrieved 20 to 24 October 2026.
Books from Global Strategy Files
Go further on this topic
 Future-Proofing AmericaEconomic challenges and the road to reform.20 USD, see the bookThe Tariff GambleHow America’s trade war is reshaping power, prices and prosperity.24.99 USD, see the book
 Kill KennedyWhat the 2025 declassified files reveal about the machinery of American power.20 USD, see the book
