
After Hormuz: The Energy Mix of 2030 in Five Economies

Driss EFFINA, PhD Independent Researcher, Global Strategy Files Foresight, prospective note No. 8, 24 October 2026. Reading time: about 55 minutes
Key takeaways
- At January to October 2026 prices the Hormuz shock raised the net oil and gas import bill by 0.63 percent of GDP in Germany, 0.55 percent in France and 0.35 percent in the United Kingdom, while Canada gained 1.49 percent; at the autumn run-rate the figures roughly double.
- Households pay everywhere: the direct energy bill shock is 1.0 to 1.6 percent of household spending in all five economies, and American households lose far more than the United States gains as a nation.
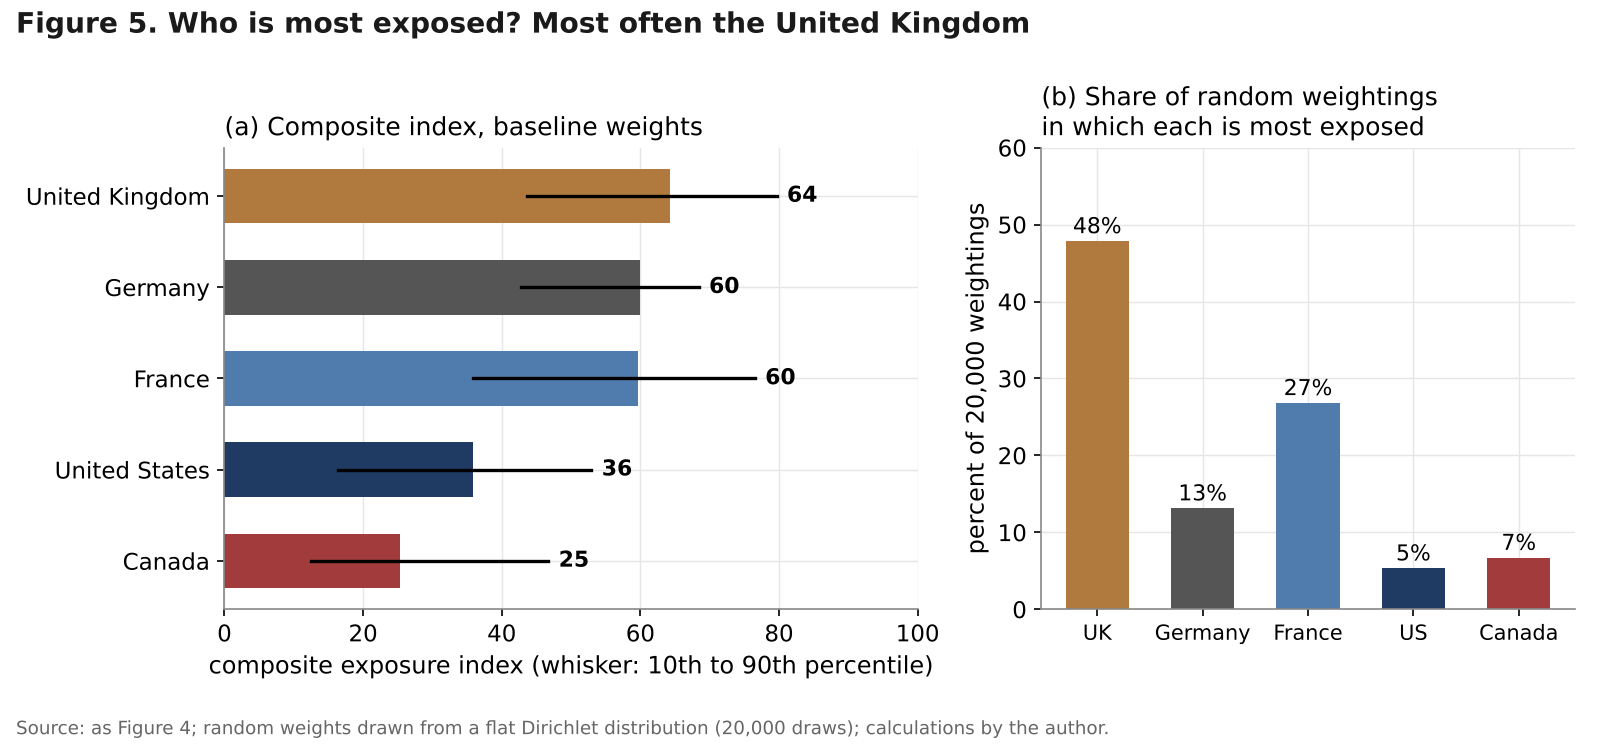
- On an original six-indicator index the United Kingdom is the most exposed economy (64 of 100), ahead of Germany and France (60), because of thin gas storage, falling North Sea output and Gulf-sourced jet fuel.
- In the author’s probability-weighted 2030 scenario, a repeat of the 2026 price shock would still cost Europe about four-fifths of its 2026 bill; only faster cuts in oil and gas volumes and deeper storage change that.
Abstract
The war that began on 28 February 2026 produced what the International Energy Agency (IEA) calls the largest supply disruption in the history of the oil market. Oil flows through the Strait of Hormuz fell from about 20 million barrels a day before the war to an average of 2.7 million barrels a day between March and May, and were still only 10.9 million barrels a day in September. Qatar, which supplied about 19 percent of the world’s liquefied natural gas (LNG) in 2025, halted production on 2 March, and two of its LNG trains will need about three years of repairs. Brent averaged 69 dollars a barrel in 2025, 97 dollars between January and October 2026, and about 127 dollars in October. European gas prices rose by more than half while the American benchmark did not move.
This note asks what the shock does to the energy mix and the energy security of the United States, the United Kingdom, France, Germany and Canada by 2030. It builds four original tools. The first is an energy-security exposure index that combines six indicators: net import dependence, LNG exposure, the Gulf share of oil and gas supply, storage buffers, the fossil share of electricity and fossil energy intensity. The second decomposes the cost of the 2026 shock into three channels: terms of trade, household energy bills and industrial gas costs. The third is a fuel-by-fuel scenario model of the 2030 primary energy mix under four scenarios with explicit probabilities: fast diversification, LNG lock-in, a renewed Gulf disruption and demand destruction. The fourth is a repeat-shock test that applies the 2026 price shock to the projected 2030 energy system. All projections are the author’s.
Keywords: energy security, Strait of Hormuz, oil shock, LNG, energy mix, terms of trade, energy transition, nuclear power, renewables, scenario analysis
JEL codes: Q41, Q43, Q48, F14, E31, Q54
Key findings
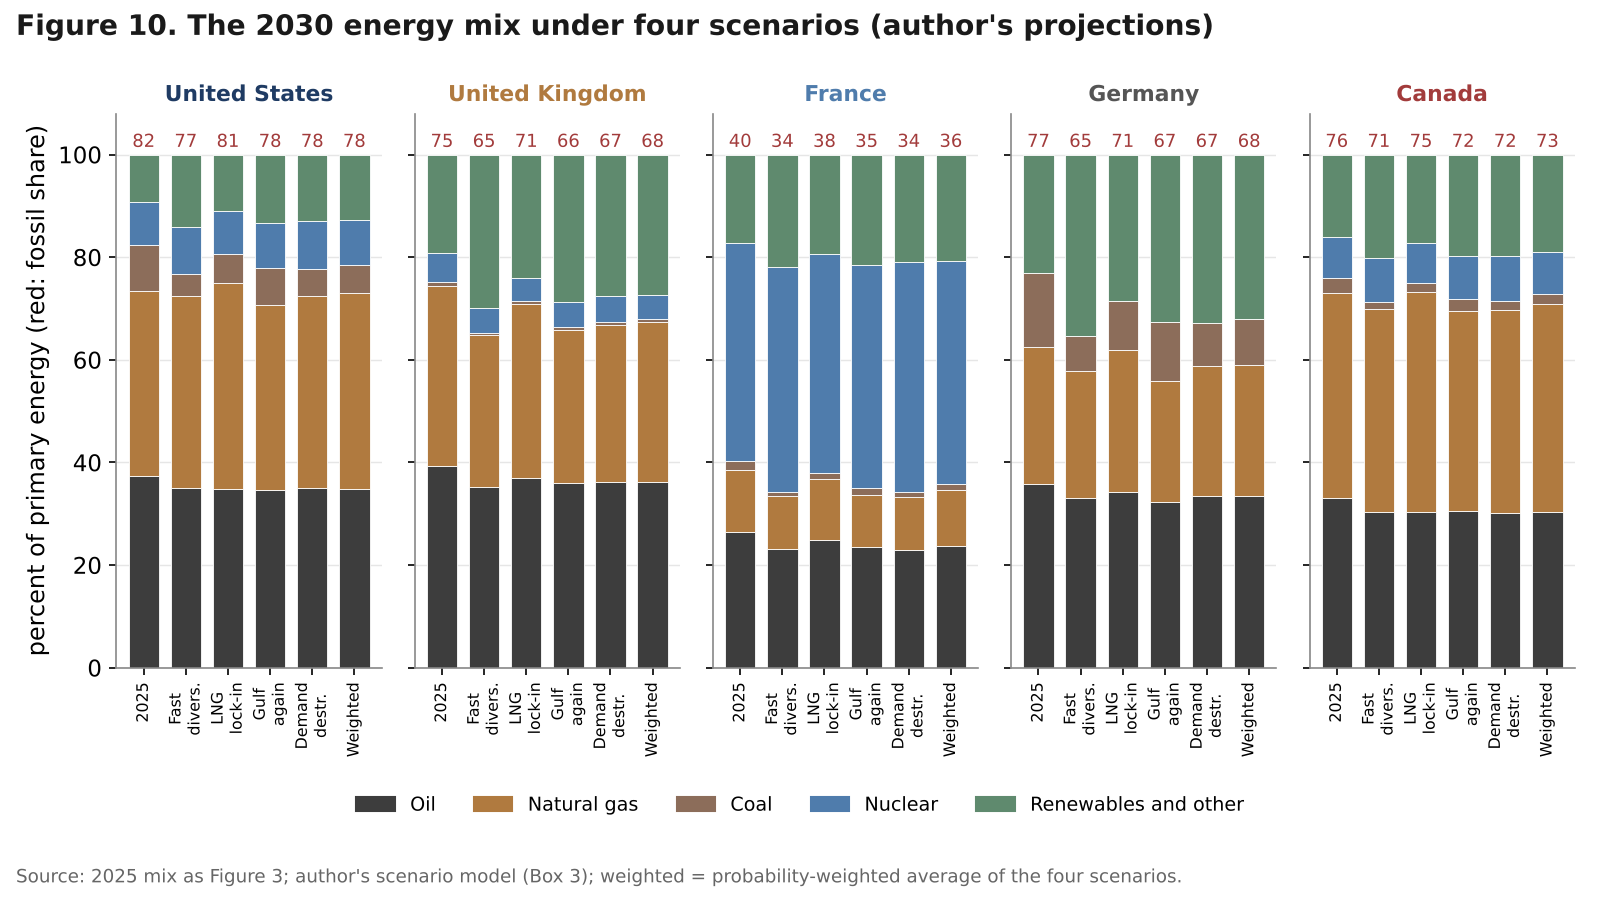
1. The shock is a transfer from importers to exporters, and the American gas market was the firewall. At January to October 2026 prices, the net oil and gas import bill rose by 0.63 percent of GDP in Germany (34 billion dollars), 0.55 percent in France and 0.35 percent in the United Kingdom, while Canada gained 1.49 percent of GDP (37 billion dollars). At the September and October run-rate the figures roughly double: a loss of 1.31 percent of GDP for Germany and a gain of 2.76 percent for Canada. The United States is close to neutral (a gain of 0.03 percent) because Henry Hub gas stayed near 3.5 dollars per million British thermal units (MMBtu) while European gas rose from 11.4 to 18.0 dollars. 2. Households pay everywhere, including in the exporting countries. At September rates, the direct increase in household energy bills equals 1.0 to 1.6 percent of household spending in all five countries (0.5 to 0.9 percent of GDP). American households pay about 286 billion dollars a year more, far more than the national terms-of-trade gain, which accrues to producers and refiners. German industry’s extra gas bill reaches about 21 billion dollars a year at the autumn run-rate, 2.1 percent of manufacturing value added, as the Europe to United States gas price gap widened from 7.9 dollars per MMBtu in 2025 to 23.6 dollars. 3. The United Kingdom, not Germany, is the most exposed economy on a broad definition. On the composite exposure index (0 to 100), the United Kingdom scores 64, Germany 60, France 60, the United States 36 and Canada 25; the United Kingdom is the most exposed in 48 percent of 20,000 random weightings. Its gas storage covers about 12 days of demand, its domestic production is at a record low, and Kuwait supplied 35 percent of its jet fuel imports. France’s nuclear power does not protect its gas supply: 64 percent of French gas imports arrived as LNG in 2025, and the Russian share (17 percent) must end by 1 January 2027 under EU law. 4. By 2030 the mix changes less than the politics suggest. In the probability-weighted path, the fossil share of primary energy falls by about 9 percentage points in Germany (from 77 to 68 percent) and 7 points in the United Kingdom (from 75 to 68 percent), but only by 3 to 5 points in the United States, Canada and France. The most likely single scenario, LNG lock-in (35 percent), keeps the gas share of Germany and the United Kingdom close to its 2025 level. Energy-related carbon dioxide falls by 8 to 17 percent between 2025 and 2030 in the weighted path, and by 11 to 23 percent under fast diversification. 5. If 2026 happened again in 2030, Europe would still pay about four-fifths of the bill. Applying the 2026 price shock to the weighted 2030 energy system cuts the terms-of-trade loss only from 0.63 to 0.51 percent of GDP in Germany, from 0.55 to 0.45 percent in France and from 0.35 to 0.29 percent in the United Kingdom. The United Kingdom is the only importer whose oil and gas import dependence rises, from 39 to 41 percent of primary energy, because North Sea decline outpaces the fall in demand. 6. Canada and the United States are the structural winners; Germany and France carry the largest tail risk. A renewed Gulf disruption before 2030 (probability 20 percent) would raise Germany’s net oil and gas import bill to 2.1 percent of GDP in 2030, against 1.0 percent under fast diversification, and France’s to 1.9 against 0.9 percent, while Canada’s net exports would reach 8.0 percent of GDP. Europe’s cheapest insurance is a faster fall in oil and gas volumes, plus storage, not a longer LNG contract book.
1. Introduction
Energy security returned in 2026 as an economic variable rather than a slogan. For four years after the 2022 gas crisis, Europe rebuilt its gas supply around Norwegian pipelines and American LNG, North America became the world’s swing supplier, and oil markets entered 2026 with a large expected surplus: in February the IEA’s market balance showed a surplus of 3.7 million barrels a day for 2026. Then the Gulf, which had carried about a fifth of the world’s oil and LNG through a single strait, closed for practical purposes.
This note is about what happens next to the energy systems of five economies: the United States, the United Kingdom, France, Germany and Canada. It is a foresight exercise, so its horizon is 2030, but it starts from a precise accounting of 2026. Three questions structure it. Who is exposed, and why? Who paid for the 2026 shock, through which channel? And how will the energy mix of 2030 differ under different paths for the Gulf, for prices and for policy? Figure 1 maps the chain from the physical shock to national accounts, and the feedback from policy to the future mix that the rest of the note quantifies.
The note does not deal with wage dynamics or second-round inflation, which Decoded No. 3 (“Oil Shock, Not Yet a Wage Shock”) covered. Here inflation enters only as a first-round transfer: the direct change in what households pay for energy. The focus is on volumes, import bills, exposure and the structure of supply.
Three limits should be stated at the outset. First, energy statistics are published with a lag: the latest full energy balances are for 2025 in four countries and for 2023 in Canada, so the structural picture is that of the eve of the shock. Second, the 2026 shock is not over; the decomposition uses prices to October 2026 and annualises them. Third, the 2030 scenarios are deliberately simple. They are built fuel by fuel from explicit growth assumptions (Box 3), so that every result can be traced to an assumption a reader can change.
2. Anatomy of the 2026 shock
2.1 Flows, stocks and the emergency response
The physical disruption had three components. Crude oil was the largest. About 20 million barrels a day passed through the Strait of Hormuz before the war; between March and May flows averaged 2.7 million, and cumulative Middle East supply losses exceeded 1.3 billion barrels by June. Bypass routes filled part of the gap: Saudi exports from Yanbu on the Red Sea rose from about 2 million barrels a day to more than 5 million in early June, and the Emirati Habshan to Fujairah pipeline carries 1.8 million barrels a day.
The second component was LNG. No LNG tanker transited Hormuz after 28 February, and QatarEnergy halted production at Ras Laffan after drone attacks on 2 March. Qatar exported 81 million tonnes in 2025, about 19 percent of world LNG, 90 percent of it to Asia. Two damaged LNG trains will take about three years to repair; Qatar says it can resume normal operations within weeks of a reopening of the strait.
The third component, less visible but economically sharp, was refined products. Middle East product exports fell to 1.9 million barrels a day in September against 4.7 million before the war, and liquefied petroleum gas to 670 thousand barrels a day against 1.5 million. Europe is structurally short of diesel and jet fuel and long of gasoline. Wholesale diesel reached all-time highs of about 220 dollars a barrel in Europe and the United States in September.
The policy response was the largest stock release on record. On 11 March, IEA members agreed to make 400 million barrels available (the national contributions published on 19 March added up to 426 million). The United States pledged 172.2 million barrels, 43 percent of the total, from a Strategic Petroleum Reserve that held about 415 million barrels, 58 percent of capacity. Canada, which holds no strategic stocks, pledged 23.6 million barrels of extra production. About 276 million barrels had been released by early July and 330 million by mid-October, when the IEA agreed to accelerate about 100 million barrels, including more than 20 million barrels of diesel.
Table 1. The 2026 shock in numbers
| Item | Value | Date | Source |
|---|---|---|---|
| Oil flows through Hormuz, pre-war | 20 mb/d | before 28 Feb 2026 | IEA commentary, 22 Jun 2026 |
| Oil flows through Hormuz, average | 2.7 mb/d | Mar to May 2026 | IEA commentary, 22 Jun 2026 |
| Oil flows through Hormuz | 10.9 mb/d | Sep 2026 | IEA OMR, 14 Oct 2026 |
| Gulf crude exports | 13.9 mb/d, over 75% of pre-war | Sep 2026 | IEA OMR, 14 Oct 2026 |
| Middle East product exports | 1.9 mb/d (4.7 pre-war) | Sep 2026 | IEA OMR, 14 Oct 2026 |
| Qatar LNG exports, 2025 | 81.0 Mt, about 19% of world | 2025 | Kpler, 10 Mar 2026 |
| IEA collective action | 400 mb agreed; 330 mb delivered | 11 Mar; mid-Oct 2026 | IEA; gCaptain, 16 Oct 2026 |
| Global observed oil stocks | 509 mb below end-February | end-Sep 2026 | IEA OMR, 14 Oct 2026 |
| World oil demand, 2026 | 102.4 mb/d, down 2.6 mb/d | 2026 forecast | IEA OMR, 14 Oct 2026 |
| World oil supply, 2026 | 100.7 mb/d, down 5.8 mb/d | 2026 forecast | IEA OMR, 14 Oct 2026 |
| North Sea Dated | 144 USD/bbl peak; 116.89 Sep average | Apr; Sep 2026 | IEA |
| Brent, monthly average | 103 (Mar), 117 (Apr), 85 (Jun), 127 (Oct) | 2026 | FRED DCOILBRENTEU |
Note: mb/d = million barrels per day; mb = million barrels; Mt = million tonnes.
2.2 Prices: oil and European gas up, American gas flat
Panel (a) of Figure 2 shows the Brent path. The monthly average rose from 71 dollars in February to 103 dollars in March and 117 dollars in April, fell to 85 dollars in June and 84 dollars in July when a US-Iran framework agreement in mid-June allowed partial tanker traffic, and climbed again after hostilities resumed in early July: 91 dollars in August, 114 dollars in September and 127 dollars in October. The average for January to October was 96.6 dollars, against 69.1 dollars in 2025, an increase of 40 percent.
Gas prices diverged across the Atlantic (panel b). The World Bank’s European gas price averaged about 11.4 dollars per MMBtu in 2025 on the months available to us, and 18.0 dollars between January and October 2026; by mid-October the Dutch TTF front-month contract traded at 28.9 dollars. Henry Hub, the American benchmark, was 3.5 dollars in 2025 and averaged 3.47 dollars in the first ten months of 2026, despite a January spike to 7.72 dollars. The Energy Information Administration (EIA) expects American LNG exports of 18 billion cubic feet a day in 2026 and 19 in 2027, against 15 in 2025, and still projects a 2027 Henry Hub price of 3.16 dollars. The United States exported more LNG and kept its domestic gas price; Europe imported the scarcity.
The spread between European and American gas, which governs the competitiveness of gas-intensive industry, was 7.9 dollars per MMBtu in 2025, 14.5 dollars on average from January to October 2026 and 23.6 dollars in September and October.
2.3 Where the shock stands in October 2026
The October 2026 picture is one of partial recovery in crude and continuing scarcity in products and gas. Hormuz flows rose by 3.7 million barrels a day in September to 10.9 million, helped by ship-to-ship transfers in the Gulf of Oman. Attacks on commercial vessels intensified in October. The IEA now expects world oil demand to fall by 2.6 million barrels a day in 2026, the first annual contraction since 2020, with diesel accounting for a quarter of the decline, and supply to fall by 5.8 million barrels a day. The EIA’s October outlook assumes Middle East shut-ins of 4.5 million barrels a day in the fourth quarter of 2026 and 2.7 million in the first quarter of 2027, with most regional production back to pre-conflict levels by the end of the second quarter of 2027. The IEA says diesel scarcity could persist well into 2027. EU gas storage stood at 74.3 percent on 16 October; German storage was about 58 percent full at the end of September, against a legal target of 70 percent on 1 November.
A first look at the results
The full note goes much further, with original models, scenarios and a dashboard of leading indicators. Two of its 14 charts and diagrams are shown below.
Continue reading
Get the full note: 26 pages, 14 charts and diagrams, 8 tables
This page shows the first part of the note. The full PDF adds: five energy systems on the eve of the shock; an energy-security exposure index; who paid in 2026: a decomposition by channel; the policy responses of 2026; four scenarios for 2030; the 2030 energy mix: results; cost, carbon and the repeat-shock test; who wins and who stays exposed; a dashboard of leading indicators.
29 USD, instant PDF download, secure card payment.
Buy the full noteNeed this analysis for your organisation?
We prepare confidential briefings, executive talks and studies on countries, markets and policies, built on the same method as this article.
Request a briefingSupport independent analysis
Our studies are free to read and carry no advertising. If this one was useful, a small contribution helps us publish the next.
Support our workGo further: books by Global Strategy Files

Frequently asked questions
How did the 2026 Strait of Hormuz crisis affect energy markets?
Oil flows through the strait fell from about 20 million barrels a day before the war that began on 28 February 2026 to 2.7 million between March and May, and were 10.9 million in September. Qatar halted LNG production on 2 March. Brent averaged 97 dollars from January to October 2026 against 69 in 2025, and European gas rose by more than half while US Henry Hub prices stayed near 3.5 dollars.
Which countries lost and which gained from the 2026 oil and gas shock?
Net importers lost and exporters gained. At January to October 2026 prices, Germany’s net oil and gas import bill rose by 0.63 percent of GDP, France’s by 0.55 percent and the United Kingdom’s by 0.35 percent. Canada gained 1.49 percent of GDP from higher crude export prices. The United States was close to neutral because its gas price did not rise, but its households still faced a large increase in energy bills.
Which economy is most exposed to energy supply shocks?
On an original index of six indicators covering import dependence, LNG exposure, Gulf supply, storage, the fossil share of power and fossil energy intensity, the United Kingdom scores 64 out of 100, Germany and France 60, the United States 36 and Canada 25. The United Kingdom ranks first mainly because its gas storage covers only about 12 days of demand and its domestic production is falling.
What will the energy mix look like in 2030 after the Hormuz shock?
In the author’s probability-weighted scenarios, the fossil share of primary energy falls to about 68 percent in Germany and the United Kingdom, 36 percent in France, 78 percent in the United States and 73 percent in Canada by 2030. LNG lock-in is the most likely single scenario (35 percent). Energy-related CO2 falls by 8 to 17 percent, but Europe’s exposure to a repeat shock falls only by about a fifth.
Sources
- International Energy Agency: Oil Market Report, October 2026 (14 October 2026); “How global oil supplies have readjusted to help fill the huge gap left by the Strait of Hormuz shock” (22 June 2026); “IEA confirms member country contributions to collective action to release oil stocks in response to Middle East disruptions” (19 March 2026); World Energy Outlook 2026 event page.
- Oil and Gas Journal, “IEA: Oil market recovery clouded as Hormuz ceasefire collapses” (10 July 2026); Hydrocarbon Engineering on the IEA Oil Market Report of August 2026.
- gCaptain, “IEA moves to accelerate oil reserve releases as Hormuz crisis drags on” (16 October 2026) and “UK approves long-delayed Jackdaw gas field on energy security grounds” (Reuters, 21 October 2026).
- US Energy Information Administration: Short-Term Energy Outlook, October 2026; Today in Energy on Gulf crude imports (6 April 2026), energy trade in 2025 (27 May 2026) and energy consumption in 2025 (30 June 2026); U.S. Energy Facts.
- US Department of Energy, LNG Snapshot, 30 June 2026. US Bureau of Labor Statistics, CPI releases of 13 January 2026 and 14 October 2026.
- World Bank, Commodity Markets Outlook, April 2026 (press release, 28 April 2026); Data Blog, “Global gas price paths diverge as LNG reshapes market balances” (9 December 2025). FIPI, Policy and Economic Reports, monthly gas price tables citing the World Bank (April 2025 to July 2026).
- Global LNG Hub, weekly JKM, TTF and Henry Hub updates (10 August, 14 and 28 September, 19 October 2026). Kpler, Hormuz and LNG prices (10 March 2026). Energy Aspects, “Qatar LNG: why Hormuz recovery will be slow and uneven” (3 July 2026). Qatar Tribune (QNA), interview with the Qatari energy minister (22 September 2026).
- Reuters via EnergyNow, emergency oil stocks of G7 countries (9 March 2026). Outlook Business on US oil shock measures (March 2026). Oilprice.com, LNG Canada Phase 2 (29 September 2026). OPIS, Europe’s jet fuel exposure (6 March 2026).
- UK DESNZ: DUKES 2026 (Chapter 1 and Chapters 1 to 7); Energy Trends, March 2026; Energy Consumption in the UK 2026. Modern Power Systems on 2025 UK generation (2 April 2026). Heatable, UK gas sources (citing DUKES 2026). LBC on gas storage days (10 January 2025).
- Ofgem, “Energy price cap will rise by 4% from October 2026” (26 August 2026); Uswitch and Money to the Masses on 2025 and 2026 caps and January 2027 forecasts. Bank of England, Monetary Policy Report, July 2026. ONS, Consumer price inflation, September 2026.
- AG Energiebilanzen, Energiemix 2025 (Infografik 01/2026). Bundesnetzagentur, electricity market data 2025 (5 January 2026) and gas supply review 2025. Destatis, Middle East share of crude imports (9 March 2026) and CPI weights. Clean Energy Wire (3 March, 13 April and 21 July 2026). AFP via Kuwait Times (30 September 2026). S&P Global (13 May 2026). EY (16 April 2026).
- SDES via Insee: energy balance of France 2025 (provisional) and origin of crude oil imports, 2011 to 2025 (21 May 2026). Insee, consumer prices, September 2026. RTE, Bilan électrique 2025, via Connaissance des Énergies. Government of France on the PPE3 (February 2026) and on support measures (21 May 2026); EDF on the PPE3 (12 February 2026). Selectra on French gas imports (22 September 2026). Interfax on the EU phase-out of Russian gas (2 February 2026).
- Natural Resources Canada, Energy Fact Book 2025-2026. Canada Energy Regulator, overview of 2025 Canada-U.S. energy trade. Statistics Canada, electricity supply and disposition 2024 and CPI (June and September 2026). Gas Outlook on Canadian climate policy (4 December 2025).
- CEIC, private consumption shares of GDP (2024). IPCC, 2006 Guidelines for National Greenhouse Gas Inventories, Volume 2. COP31 dates and venue: UNFCCC conference listings.
- Data series: FRED DCOILBRENTEU; IMF WEO October 2026 (NGDPD, NGDP_RPCH, PCPIPCH); Eurostat prc_hicp_minr; World Bank WDI NE.CON.PRVT.ZS and NV.IND.MANF.ZS. Retrieved 20 to 24 October 2026.
Books from Global Strategy Files
Go further on this topic


