
The AI Dividend: Realistic Productivity Paths to 2035 in Five Economies

Driss EFFINA, PhD Independent Researcher, Global Strategy Files Foresight, prospective note No. 9, 24 October 2026. Reading time: about 55 minutes
Key takeaways
- Firm use of AI has risen steeply since 2023 in all five economies, tripling in France and Canada in two years, but only the United States shows a productivity acceleration: total factor productivity grew 1.06 percent a year in 2019 to 2025, while it fell in the United Kingdom and France.
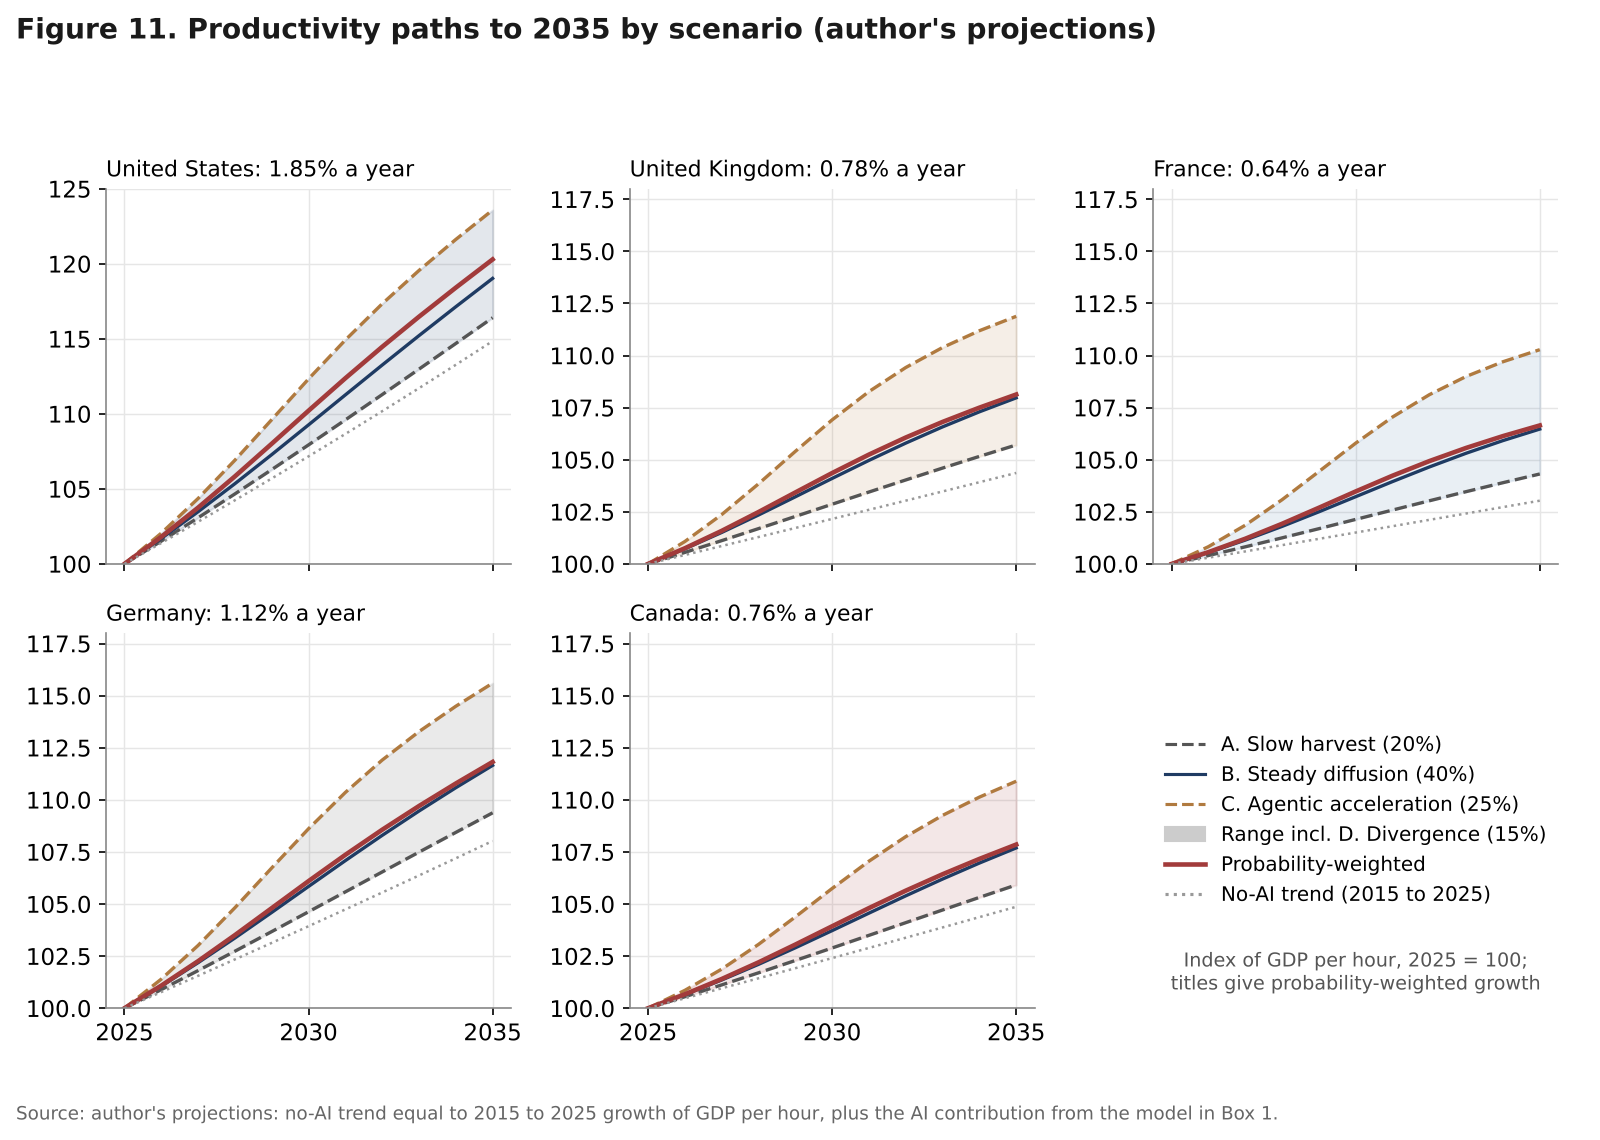
- Labour costs in AI-exposed tasks are 22 to 24 percent of GDP in all five economies; the central scenario adds 0.27 to 0.36 points a year to productivity growth over 2026 to 2035, and the probability-weighted path 0.28 to 0.46 points.
- Europe depends more on the dividend: AI supplies 54 percent of expected productivity growth in France and 45 percent in the United Kingdom, against 25 percent in the United States; a slow harvest would leave both below 0.6 percent a year.
- Unrecorded reorganisation spending could peak at 0.7 to 1.3 percent of US GDP around 2029 to 2030, hiding part of the gain; an extra half point of growth cuts 2035 debt ratios by 8 to 11 points, a help but not a fiscal rescue.
Abstract
Generative artificial intelligence has moved from novelty to routine in less than four years. In the United States, the share of firms using AI rose from 3.7 percent in September 2023 to 19.8 percent in May 2026; in the European Union it rose from 8 to 20 percent between 2023 and 2025; in Canada it tripled in two years, to 19.2 percent. Four American cloud companies spent about 410 billion dollars on capital equipment in 2025 and plan about 725 billion dollars in 2026, 2.2 percent of US GDP. Yet measured labour productivity tells two different stories. In the United States, GDP per hour grew by 1.7 percent a year between 2019 and 2025, against 0.9 percent in 2015 to 2019. In the United Kingdom and France, total factor productivity fell after 2019.
This note asks how much AI will add to productivity growth in the United States, the United Kingdom, France, Germany and Canada by 2035, and what that means for wages and public debt. It builds four original tools: a growth-accounting decomposition of GDP per hour from 2015 to 2025; an exposure-adoption-complementarity model that multiplies the labour cost of AI-exposed tasks (from sector structure), the share of those tasks performed with AI (from official surveys) and the capacity to turn use into output (from R&D and ICT intensity); four scenarios to 2035 with probabilities, plus a “J-curve” check of how much of the gain the statistics will miss; and a debt simulation. All projections are the author’s.
Keywords: artificial intelligence, generative AI, labour productivity, total factor productivity, growth accounting, technology diffusion, productivity J-curve, intangible investment, labour share, public debt, United States, United Kingdom, France, Germany, Canada
JEL codes: O33, O47, O51, O52, E22, H68, J24
Key findings
1. AI is already in the numbers, but only in America’s. On the author’s model, AI had raised the level of labour productivity by about 0.9 percent by 2025 in the United States, the United Kingdom and Germany, 0.7 percent in France and 0.5 percent in Canada. Only the United States shows a matching acceleration: total factor productivity grew 1.06 percent a year in 2019 to 2025, against 0.58 percent in 2015 to 2019, while it fell by 0.23 and 0.47 percent a year in the United Kingdom and France. 2. Structure is not destiny: the five economies are almost equally exposed. Labour costs in AI-exposed tasks amount to 22.4 to 24.1 percent of GDP in all five, or 39 to 43 percent of labour income. With modest differences in adoption and complementarity, the central scenario adds 0.27 to 0.36 percentage points a year to labour productivity growth over 2026 to 2035. AI alone will neither close nor much widen the transatlantic gap. 3. The realistic dividend is a third of a point, with a fat upper tail. Across four scenarios (slow harvest 20 percent, steady diffusion 40 percent, agentic acceleration 25 percent, transatlantic divergence 15 percent), the probability-weighted AI contribution is 0.46 points a year in the United States, about 0.35 in the United Kingdom, France and Germany, and 0.28 in Canada. For the United States that means a 2035 productivity level 4.8 percent higher, about three times the Penn Wharton estimate of 1.5 percent, but only at the bottom of the OECD’s 0.4 to 1.3 point range. The annual gain peaks around 2029 to 2031, not at once. 4. Europe needs the dividend more than America does. In the probability-weighted path, AI provides 54 percent of expected productivity growth in France and 45 percent in the United Kingdom, against 25 percent in the United States. A slow harvest would leave French and British GDP per hour growing at only 0.42 and 0.56 percent a year to 2035. 5. The statistics will understate the gain while it is being built. If firms spend half a year of labour cost on reorganisation for every task moved to AI, unrecorded investment peaks at 0.68 percent of US GDP in 2030 in the central scenario and 1.26 percent in 2029 in the fast one. Measured productivity then lags true productivity by up to 0.35 and 0.93 points of level. Weak official data in 2027 will not by themselves prove the dividend a mirage. 6. Half a point of growth is worth 8 to 11 points of debt by 2035, not a fiscal rescue. An extra 0.5 points of growth from 2027 lowers 2035 debt ratios by 8.3 (Canada) to 11.2 points (France) if half the gain is not passed on to primary spending, and by 3.1 to 6.1 points through the denominator alone. The probability-weighted AI paths lower 2035 debt by 3.6 to 7.6 points, while US debt still rises from 124 to about 151 percent of GDP. Before reallocation, the central scenario could shift 1.2 to 1.7 points of GDP from labour to capital income by 2035.
1. Introduction
Every general-purpose technology has arrived with two forecasts: that it will transform everything within a decade, and that it will show up “everywhere but in the productivity statistics”. The question for 2026 is which applies to generative AI, and on what timetable.
The case for optimism is visible. Firm surveys show the share of companies using AI rising steeply since 2023 in all five economies, from 6 to 18 percent in France and from 6 to 19 percent in Canada in two years. High-technology equipment and software now make up 55 percent of US business investment. Field experiments in customer support and software development find task-level gains of 15 to 26 percent.
The case for caution is visible too. Most firm-level adoption is light: in the United States, 41 percent of workers used generative AI for work in November 2025, but only 12 percent did so daily. A large Danish study found no measurable effect on earnings or hours worked. A randomised trial with experienced software developers found that AI tools made them 19 percent slower, while they believed they were 20 percent faster. And outside the United States, measured productivity growth has been weak or negative since 2019.
This note builds the numbers from the ground up for five economies, with every assumption explicit. Figure 1 sets out the framework. AI creates a potential gain on individual tasks; three filters decide how much reaches the economy: exposure (the share of labour costs in tasks AI can perform), adoption (the share of those tasks actually performed with AI) and complementarity (how well firms turn use into output). The resulting productivity gain attracts more capital, with a measurement lag while firms invest in unrecorded intangible assets, and it feeds into growth, income distribution and public finances.
The 2026 context matters. The war that began at the end of February 2026 disrupted the Strait of Hormuz, and Brent crude averaged about 127 dollars a barrel in October, raising the energy cost of computing. Bond yields rose sharply after February (Decoded No. 1), raising the cost of capital for the investment boom. And ageing (Foresight No. 1) leaves productivity as the main source of growth in all five economies. This note therefore treats AI as a macroeconomic question: what can realistically be expected, by when, and what it is worth.
2. Adoption: fast, broad, and still shallow
2.1 What the official surveys say
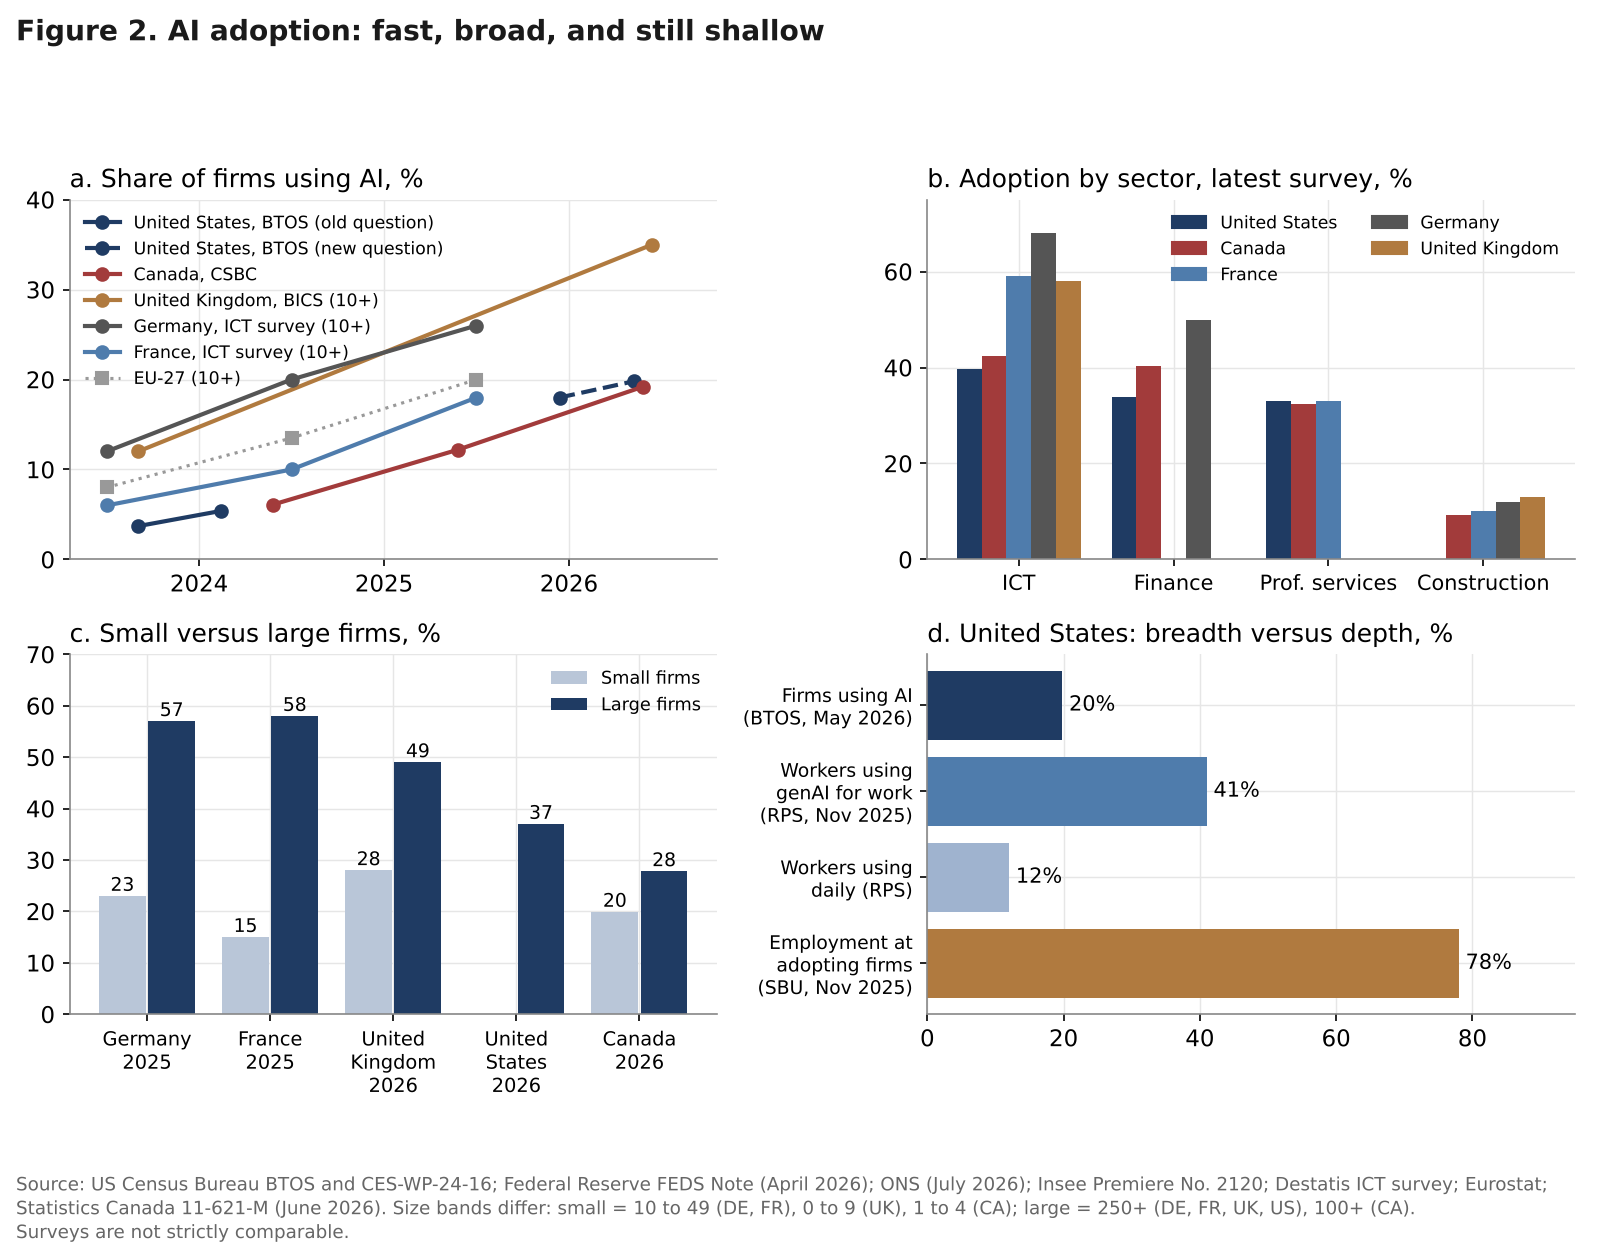
Every statistical office of the five economies now asks firms whether they use AI. The questions differ, so levels are not strictly comparable, but the direction is unambiguous (Table 1 and Figure 2).
Table 1. Business use of AI: latest official indicators
| Economy | Survey | Earlier reading | Latest reading | Large firms | Leading sector |
|---|---|---|---|---|---|
| United States | Census BTOS, all firms | 3.7% (Sep 2023); 5.4% (Feb 2024) | 18.0% (Dec 2025); 19.8% (May 2026) | 37% (250+) | Information 39.7% |
| United Kingdom | ONS BICS, 10+ employees | 12% (Sep 2023) | about 35% (Jun 2026) | 49% (250+) | Information and communication 58% |
| France | Insee ICT survey, 10+ | 6% (2023); 10% (2024) | 18% (2025) | 58% (250+) | Information and communication 59% |
| Germany | Destatis ICT survey, 10+ | 12% (2023); 20% (2024) | 26% (2025) | 57% (250+) | ICT 68% |
| Canada | StatCan CSBC, all firms | 6.1% (Q2 2024); 12.2% (Q2 2025) | 19.2% (Q2 2026) | 27.8% (100+) | Information and cultural 42.3% |
| European Union | Eurostat, 10+ | 8% (2023); 13.5% (2024) | 20.0% (2025) | n.a. | n.a. |
Source: US Census Bureau (CES-WP-24-16; BTOS story, May 2026); Federal Reserve FEDS Note, April 2026; ONS, “Artificial intelligence in UK businesses: 2023 to 2026”, July 2026; Insee Premiere No. 2120, July 2026; Destatis ICT survey; Eurostat, December 2025; Statistics Canada 11-621-M, June 2026. The US question was broadened in November 2025 from use “in producing goods or services” to use “in any business function”.
Three features stand out. First, the pace. Canada’s adoption rate doubled from 2024 to 2025 and rose by another 7 points to 2026; France’s rose from 10 to 18 percent in a single year; the UK rate nearly tripled between September 2023 and June 2026. In the United States, adoption grew by 3.9 points (68 percent) in the year before the November 2025 question change; under the broader question it reached 19.8 percent in May 2026, and 20 to 23 percent of firms expected to use AI within six months.
Second, the size gradient. Large firms adopt two to four times as often as small ones in Europe: 58 percent of French firms with 250 or more employees used AI in 2025 against 15 percent of those with 10 to 49. Because large firms employ most workers, employment-weighted adoption is much higher: about 78 percent of the US labour force works at firms that have adopted AI, and 54 percent at firms using large language models (Atlanta Fed survey, as analysed by the Federal Reserve Board).
Third, the sector gradient is the same everywhere. Information and communication, finance and professional services lead, with adoption rates of 30 to 68 percent; construction, transport and hospitality trail at 8 to 13 percent. This regularity is what makes a sector-based model possible (Section 6).
2.2 Breadth is not depth
The more important distinction is between using AI and doing much with it. The US Real-Time Population Survey found that 41 percent of workers used generative AI for work in November 2025, up by about 31 percent in a year, but only 12 percent used it daily. Bick, Blandin and Deming estimated that 1.3 to 5.4 percent of all US work hours were assisted by generative AI in late 2024, that users saved 5.4 percent of their hours, and that the implied gain in aggregate productivity was about 1.1 percent. In the United Kingdom, around half of businesses report no AI effect on headcount (ONS).
This gap between breadth and depth is the most important parameter for the macro outlook. A firm whose staff draft emails with a chatbot and a firm that rebuilds its claims process around AI agents both count as adopters, yet their productivity gains differ by an order of magnitude. The model in Section 6 therefore uses firm adoption rates only to scale a measure of effective use, anchored on US worker-level evidence.
A first look at the results
The full note goes much further, with original models, scenarios and a dashboard of leading indicators. Two of its 15 charts and diagrams are shown below.
Continue reading
Get the full note: 27 pages, 15 charts and diagrams, 8 tables
This page shows the first part of the note. The full PDF adds: the investment boom: concentrated in the United States; productivity 2015 to 2025: the United States pulls away; what the literature says, and why it disagrees; the exposure-adoption-complementarity model; four paths to 2035; productivity paths to 2035; the J-curve check: capex boom, measured productivity; distribution: occupations, wages and the labour share; the fiscal dividend: what half a point of growth is worth.
29 USD, instant PDF download, secure card payment.
Buy the full noteNeed this analysis for your organisation?
We prepare confidential briefings, executive talks and studies on countries, markets and policies, built on the same method as this article.
Request a briefingSupport independent analysis
Our studies are free to read and carry no advertising. If this one was useful, a small contribution helps us publish the next.
Support our workGo further: books by Global Strategy Files

Frequently asked questions
How much will AI raise productivity growth by 2035?
On the author’s model for the United States, the United Kingdom, France, Germany and Canada, AI adds about 0.27 to 0.36 percentage points a year to labour productivity growth over 2026 to 2035 in the central scenario. Weighting four scenarios by probability gives 0.46 points for the United States, about 0.35 for the three European economies and 0.28 for Canada, with gains peaking around 2029 to 2031 rather than arriving at once.
Why has AI not yet shown up in European productivity data?
Firm adoption in Europe is as broad as in the United States, but use is still shallow, other shocks such as the 2022 energy crisis and weak demand dominated after 2019, and firms are investing in reorganisation that national accounts do not record. This productivity J-curve means measured productivity lags true productivity while AI is being built into work, so early data understate the gain.
Will AI close the productivity gap between Europe and the United States?
Probably not. The five economies are almost equally exposed to AI, with 22 to 24 percent of GDP in exposed labour costs, so the AI dividend is similar in size. The United States’ faster productivity growth comes mostly from its non-AI trend. Only if Europe and Canada fall behind on adoption, energy costs and capital, the divergence scenario with a 15 percent probability, would AI widen the gap markedly.
What does faster productivity growth mean for public debt?
On the author’s projections, an extra half point of growth from 2027 lowers general government debt ratios in 2035 by about 8 to 11 points of GDP, of which roughly half comes from a larger GDP and half from a lower primary spending ratio. The probability-weighted AI paths cut 2035 debt by 3.6 to 7.6 points, which slows but does not reverse the rise of US debt.
Sources
All data retrieved on or before 24 October 2026.
- Acemoglu, D., “The Simple Macroeconomics of AI”, NBER Working Paper 32487, 2024, and Economic Policy, 2025.
- Allen, J. S., “Monitoring AI Adoption in the US Economy”, FEDS Notes, Board of Governors of the Federal Reserve System, 3 April 2026.
- Bick, A., A. Blandin and D. Deming, “The Impact of Generative AI on Work Productivity”, Federal Reserve Bank of St. Louis, On the Economy, 27 February 2025.
- Bonney, K., et al., “Tracking Firm Use of AI in Real Time: A Snapshot from the Business Trends and Outlook Survey”, US Census Bureau CES Working Paper 24-16, March 2024.
- Brynjolfsson, E., D. Li and L. Raymond, “Generative AI at Work”, Stanford Digital Economy Lab and Quarterly Journal of Economics.
- Brynjolfsson, E., D. Rock and C. Syverson, “The Productivity J-Curve: How Intangibles Complement General Purpose Technologies”, American Economic Journal: Macroeconomics, 2021.
- Bureau of Labor Statistics, “Productivity and Costs, Second Quarter 2026, Revised”, 3 September 2026.
- Banque de France (A. Devulder, T. Zuber, B. Ducoudre, M. Lemoine), “Explaining productivity losses observed in France since the pre-Covid period”, Bulletin No. 251/1, March-April 2024.
- Canada, Innovation, Science and Economic Development, “Canada to drive billions in investments to build domestic AI compute capacity at home”, 5 December 2024.
- Cui, Z. K., M. Demirer, S. Jaffe, L. Musolff, S. Peng and T. Salz, “The Effects of Generative AI on High-Skilled Work: Evidence from Three Field Experiments with Software Developers”, Management Science (2025) and MIT working paper.
- Destatis, ICT survey of enterprises (IKT-U), 2023 to 2025, as compiled by statistiken-aktuell.de; Destatis press release PD24/444, November 2024; Destatis national accounts via Deutsche Bundesbank statistical series and DBnomics (81000BJ002).
- Euronews, “EU to mobilise 200 billion for AI investment”, 11 February 2025.
- Eurostat, use of artificial intelligence in enterprises, 2025 results (11 December 2025), as reported by Luxtoday and Implicator.
- Filippucci, F., P. Gal, K. Laengle and M. Schief, “Macroeconomic productivity gains from artificial intelligence in G7 economies”, OECD Artificial Intelligence Papers No. 41, 2025; SUERF Policy Brief No. 1283, October 2025; and Filippucci et al., “Miracle or Myth? Assessing the macroeconomic productivity gains from artificial intelligence”, OECD, November 2024.
- FRED, Federal Reserve Bank of St. Louis: LFEMTTTTUSA647N, LFEMTTTTGBA647N, LFEMTTTTFRA647N, LFEMTTTTDEA647N, LFEMTTTTCAA647N, CE16OV, NFIRXDCCAA, VAFI, VAPGDPRL, DCOILBRENTEU.
- Gibson Dunn, “EU AI Act Omnibus Agreement: Postponed High-Risk Deadlines and Other Key Changes”, May 2026; Hunton Andrews Kurth, “EU Digital Omnibus on AI Enters into Force”, July 2026.
- Goldman Sachs, “Generative AI could raise global GDP by 7%”, 5 April 2023.
- House of Commons Library, “Financial services in the UK”, 18 November 2024.
- Humlum, A. and E. Vestergaard, “Large Language Models, Small Labor Market Effects”, Becker Friedman Institute Working Paper 2025-56, April 2025.
- IG, “Big tech Q2 2026 earnings: the AI capex question”, 16 July 2026; LPL Research, “Hyperscalers Plan to Live Up to Their Name”, February 2026; Yahoo Finance, “Hyperscalers Hit $700 Billion in 2026 AI Spending Plans”, 1 May 2026.
- Insee, “Les technologies de l’information et de la communication dans les entreprises en 2025”, Insee Premiere No. 2120, 21 July 2026; Insee, valeur ajoutee par branche, comptes nationaux annuels, base 2020.
- International Monetary Fund, World Economic Outlook and Fiscal Monitor databases, October 2026 (NGDP_RPCH, PCPIPCH, LUR, NGDPD, GGXWDG_NGDP, GGXCNL_NGDP, GGXONLB_G01_GDP_PT, G_X_G01_GDP_PT, GGR_G01_GDP_PT).
- International Monetary Fund, “Gen-AI: Artificial Intelligence and the Future of Work”, Staff Discussion Note SDN/2024/001, January 2024.
- METR, randomised trial of AI tools with experienced open-source developers, July 2025, as summarised by S. Willison, 12 July 2025.
- OECD, average annual hours actually worked per worker and GDP per hour worked (2023, USD PPP), as compiled in Wikipedia lists citing OECD data.
- Office for National Statistics, “Artificial intelligence in UK businesses: 2023 to 2026”, 20 July 2026; “UK productivity introduction: April to June 2026”, 18 August 2026; UK National Accounts, The Blue Book 2024 and 2025, industrial analysis; “Blue Book 2026 industry impact analysis”, 20 August 2026.
- Penn Wharton Budget Model (A. Arnon), “The Projected Impact of Generative AI on Future Productivity Growth”, 8 September 2025.
- Rubinton, H. and B. A. Patro, “Tracking AI’s Contribution to GDP Growth”, Federal Reserve Bank of St. Louis, On the Economy, 12 January 2026.
- Statistics Canada, “Analysis on artificial intelligence use by businesses in Canada, second quarter of 2026”, 11-621-M, June 2026; “Business conditions in Canada, second quarter of 2026”, 11-627-M, May 2026; GERD, The Daily, 27 November 2025; labour productivity, Q2 2026 (3 September 2026); Table 1-2; industry shares via Money.ca.
- TechCrunch, “Nvidia, Deutsche Telekom strike 1 billion euro partnership for a data center in Munich”, 4 November 2025; The Quantum Insider, “UK and US Seal Tech Pact With 31 Billion Pound AI and Quantum Push”, 17 September 2025.
- US Census Bureau, “Large Firms With at Least 20 Employees Biggest AI Users”, May 2026.
- US Bureau of Economic Analysis, Table B-8, Gross domestic product by industry, Economic Report of the President 2025; high-tech investment share as reported by Crypto Briefing citing BEA and Yardeni Research, 27 August 2026.
- World Bank, World Development Indicators (NE.GDI.FTOT.ZS, NY.GDP.MKTP.KD.ZG, GB.XPD.RSDV.GD.ZS, SP.POP.1564.TO), retrieved October 2026; ECB euro reference exchange rates.
- Global Strategy Files, Decoded No. 1, “Five Bond Markets, One Shock”; Foresight No. 1, “The Ageing Bill”; Foresight No. 7, “America’s Interest Bill”, October 2026.
Books from Global Strategy Files
Go further on this topic


