
The Diesel Tax Nobody Voted For: Who Pays the 2026 Distillate Shock


Driss EFFINA, PhD Independent Researcher, Global Strategy Files Decoded, analysis note No. 16, 24 October 2026. Reading time: about 55 minutes
Key takeaways
- Between the 2025 average and September 2026 Brent rose 65 percent but New York Harbor diesel rose 113 percent; the diesel crack reached 94 dollars a barrel, against 29 in 2025 and 17 in 2019, and diesel outpaced petrol at the pump in every country.
- The refining margin explains 46 to 61 percent of the rise in retail diesel across the five countries; crude explains 31 to 41 percent. Fixed European excise duties damp the percentage rise but not the level.
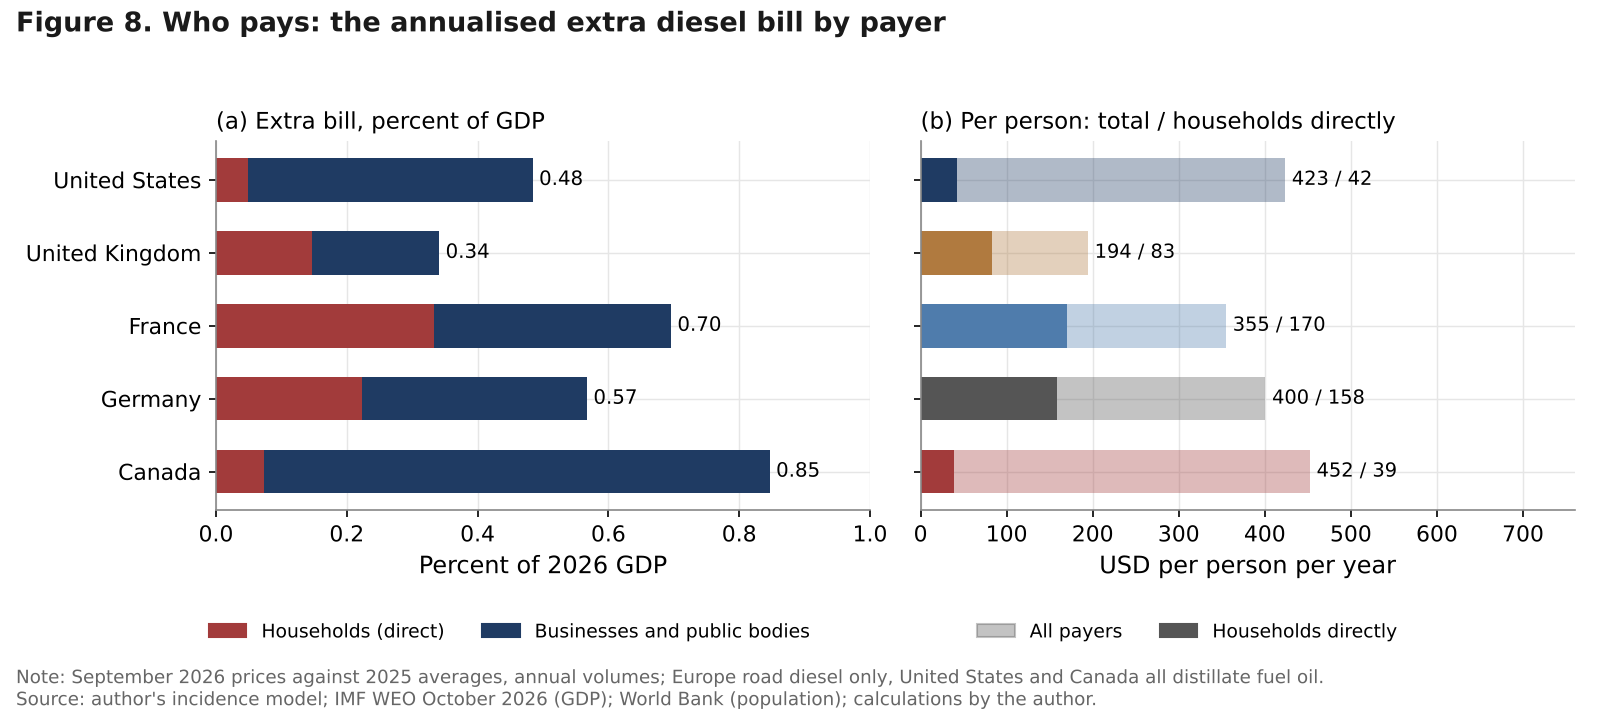
- The extra diesel bill is about 249 billion dollars a year at September prices, from 0.34 percent of GDP in the United Kingdom to 0.85 percent in Canada; households pay 19 percent directly and firms the rest, which reaches consumers as a near-flat tax.
- Refiners and product exporters collect about 144 billion dollars a year while governments gain at most 0.05 percent of GDP; in the author’s scenarios diesel in 2027 still averages 20 to 33 percent above 2025.
Abstract
In 2026 diesel became the most expensive part of the oil shock. Between the 2025 average and September 2026, Brent rose 65 percent while New York Harbor ultra-low-sulphur diesel rose 113 percent, and the diesel crack (the price of diesel minus the price of crude) went from 29 to 94 dollars a barrel, against 17 dollars in 2019. This note asks who pays for that gap, and who receives it, in the United States, the United Kingdom, France, Germany and Canada. It builds four tools: a decomposition of the pump price into crude, refining, distribution and taxes from 2019 to September 2026; an incidence model that splits the extra diesel bill between households and businesses and traces it to producers, refiners, distributors and treasuries; a US input-output model, calibrated to official volumes, that carries the shock into industry costs and consumer prices by income quintile; and four scenarios to end-2027 with explicit probabilities. The refining margin, not crude and not tax, explains about half to three-fifths of the rise in the pump price in every country. It works like a levy paid by every truck, tractor and diesel car and collected by refiners wherever they are, and no legislature voted for it. Governments gain little: higher VAT receipts are largely offset by lower volumes and relief measures.
Keywords: diesel prices, crack spread, middle distillates, refining margins, fuel taxation, incidence, input-output, freight costs, VAT, 2026 oil shock
JEL codes: Q41, H22, H23, L71, E31
Key findings
1. Diesel ran far ahead of crude. From the 2025 average to September 2026, Brent rose 65.2 percent, New York Harbor diesel 112.5 percent and gasoline (August) 59.8 percent. The diesel crack reached 94 dollars a barrel in September, against 28.8 in 2025, 55.2 in 2022 and 17.1 in 2019. At the pump, diesel rose more than petrol from February to September: 69 against 50 percent in the United States, 36 against 29 in the United Kingdom, 39 against 29 in Germany, 40 against 30 in Canada.
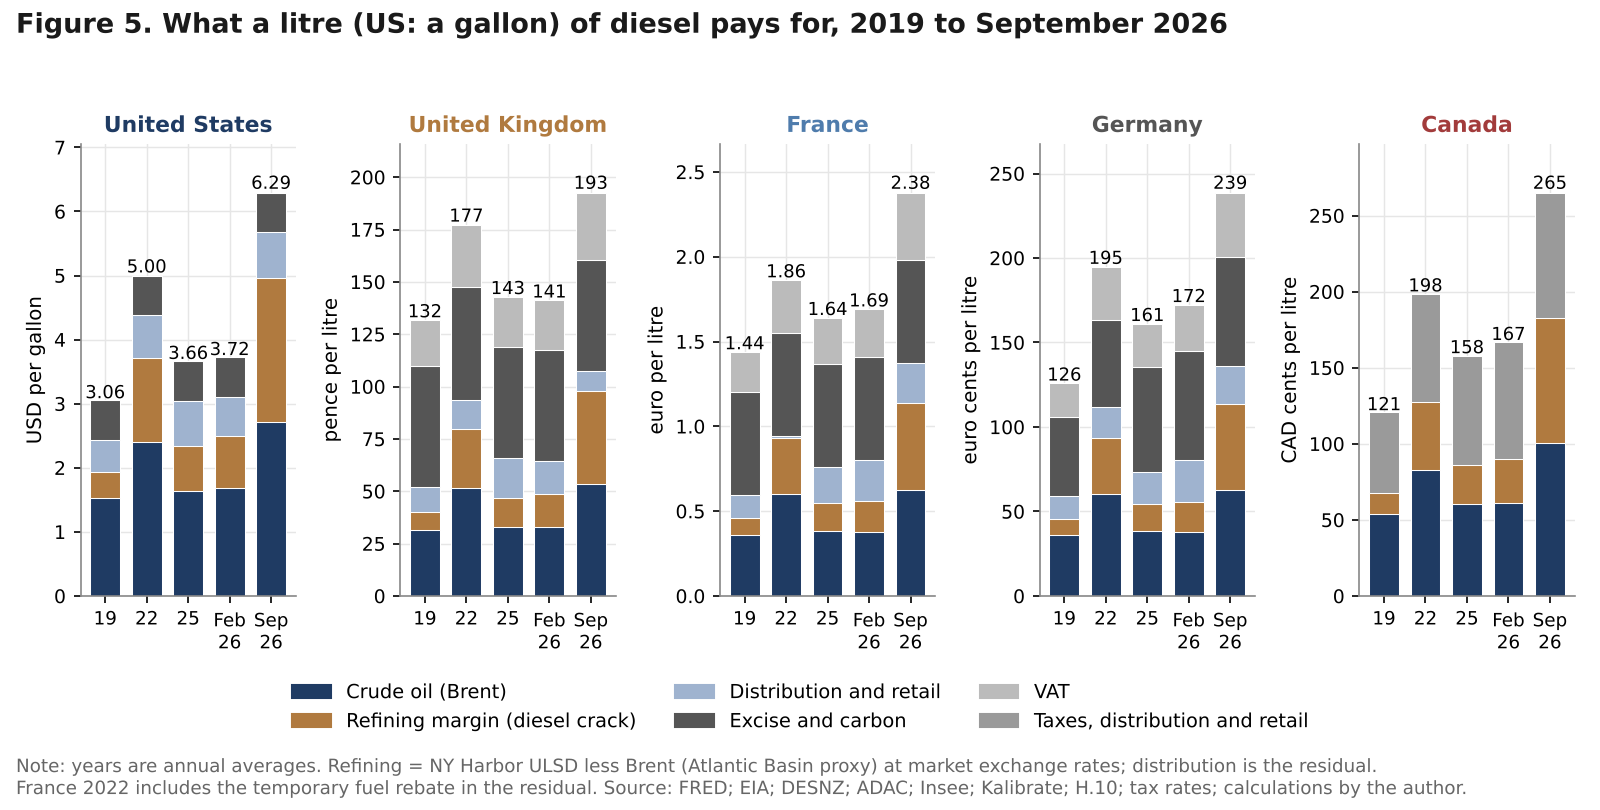
2. Refining, not crude or tax, is the largest piece of the increase. In the author’s decomposition the diesel crack explains 59 percent of the rise in the retail price in the United States, 61 percent in the United Kingdom, 48 percent in France, 46 percent in Germany and 54 percent in Canada; crude explains 31 to 41 percent. Fixed excise duties explain why European pump prices rose less in percentage terms (35 percent in the United Kingdom against 72 percent in the United States).
3. The bill is large and mostly paid by firms. At September 2026 prices, the extra annual diesel bill is about 249 billion dollars across the five countries: 0.85 percent of GDP in Canada, 0.70 percent in France, 0.57 percent in Germany, 0.48 percent in the United States and 0.34 percent in the United Kingdom. Households pay 19 percent directly, from 0.05 percent of GDP in the United States to 0.33 percent in France, where 48.3 percent of cars run on diesel. The rest falls on freight, construction, farms and public services.
4. The pass-through is a flat consumption tax in America and a rural tax in France. In the United States the author’s input-output model puts the diesel shock at 0.44 percent of consumer prices, of which 59 percent of the indirect part is due to the distillate premium; for-hire trucking costs rise 10.7 percent. The burden is 0.54 percent of spending for the four lower income quintiles and 0.50 percent for the richest. In France, a household in the most fuel-exposed tenth pays about 1,391 euros a year more than in 2025, 5.6 percent of its income.
5. The windfall goes to refiners, not treasuries, and it will not vanish in 2027. Refiners and product exporters collect about 144 billion dollars a year (0.23 to 0.49 percent of GDP by country); the net fiscal gain is between minus 0.003 and plus 0.05 percent of GDP after lower volumes and relief. In the author’s scenarios the probability-weighted diesel crack is still 41 dollars at the end of 2027 and retail diesel in 2027 averages 20 to 33 percent above 2025, an extra bill of 0.22 to 0.40 percent of GDP.
1. Introduction: a levy without a parliament
Fuel taxes are among the most sensitive decisions a government takes; every change is debated, voted, dated and costed. Yet in 2026 the largest increase in what people and firms pay for a litre of diesel was decided by no parliament. It came from the margin between diesel and the crude it is made from, set in Rotterdam and New York Harbor by the balance between refining capacity and demand for middle distillates.
The war that began on 28 February 2026 is remembered as a crude oil shock: Brent averaged 70.9 dollars a barrel in February, 117.3 in April and 127.0 in October. But the shock that reached trucks, farms, building sites and diesel cars was larger, because the barrels that disappeared were disproportionately middle distillates. The Gulf exported 4.7 million barrels a day of refined products before the war and 1.9 million in September. About 45 percent of Russia’s primary refining capacity was offline at the end of September, largely after Ukrainian drone strikes. The European Union stopped importing products made from Russian crude in third countries on 21 January 2026, and Europe and the United States had closed about 900 thousand barrels a day of refining capacity in 2025. Stocks were thin before the first missile.
Decoded No. 10 found that in the United Kingdom each 10 dollars on Brent added almost twice as much to the price of diesel as to the price of petrol. This note starts where that finding stops. It does not study the inflation or wage consequences of the oil shock (Decoded No. 3), nor the tariff and oil cost push in North American supply chains (Decoded No. 13). It asks three narrower questions about diesel alone. How much of the 2026 rise in the price of diesel is crude, how much is refining, how much is distribution and how much is tax, in five countries with very different tax systems? Who pays the extra bill: households, hauliers, farmers, builders, public services? And who receives it: oil producers, refiners, retailers or governments?
Sections 2 and 3 describe and decompose the shock, Section 4 measures who pays and who receives, Sections 5 and 6 follow it through industries, incomes and places, Section 7 compares the windfalls of refiners and treasuries and Section 8 sets out scenarios to end-2027.
2. Why diesel, not crude: the anatomy of the 2026 distillate shock
2.1 Four channels that removed middle distillates
Diesel, gasoil and jet fuel come from the middle of the barrel, and a refinery can shift its yield towards them only within limits. When distillate supply falls faster than crude supply, the gap between their prices widens until enough demand is destroyed or supply found. In 2026 four channels removed distillates at the same time (Table 1).
Table 1. The supply side of the 2026 distillate shock: verified facts
| Channel | Measure | Value | Source |
|---|---|---|---|
| Gulf product exports | Middle East refined product exports, before the war and in September 2026 | 4.7 and 1.9 mb/d | IEA |
| Missing diesel in trade | Diesel missing from the global market (early September) | 1.3 to 1.4 mb/d, 15 to 20 percent of normal international shipments | Argus Media |
| Russian refining | Primary refining capacity offline, end of September 2026 | about 45 percent | S&P Global Commodity Insights (CERA) |
| Russian exports | Diesel exports, June 2026 against a year earlier | below 1.0 against about 2.5 Mt a month | Reuters via Oilprice.com |
| Russian supply outlook | Diesel export volumes floated by the Russian government for October, November, December | 0.3, 0.5 and 1.0 Mt | S&P Global |
| EU sanctions | Ban on products refined from Russian crude in third countries | in force from 21 January 2026; imports from 11 refineries down 69 percent (120 kb/d) | Kyiv School of Economics |
| Closures, Europe | Capacity scheduled for permanent closure in 2025 (Grangemouth 150, Wesseling 147, part of Gelsenkirchen) | about 400 kb/d; Lindsey (108 kb/d) also closed in 2025 | Argus; S&P Global; DESNZ |
| Closures, United States | LyondellBasell Houston, Phillips 66 Los Angeles, Valero Benicia | 264, 139 and 145 kb/d; operable capacity 18.2 mb/cd on 1 January 2026 | EIA |
| Stocks | US distillate inventories against five-year average (week to 16 October) | 9 percent below | EIA via Oil and Gas 360 |
| Emergency response | IEA diesel release announced 15 October | more than 20 million barrels | IEA via S&P Global |
The Gulf channel is the largest: the loss of 2.8 million barrels a day of finished products had to be replaced by refineries elsewhere, from crude that was itself scarcer. The Russian channel added to it. Reuters estimated in mid-September that three of Russia’s six largest diesel refineries, which produce roughly half of its diesel, were shut or running at about a quarter of capacity, and Moscow restricted exports of gasoline, diesel and jet fuel. In early October the Russian government suggested that diesel exports could reach 300 thousand tonnes in October, 500 thousand in November and 1 million in December, against about 2.5 million tonnes a month a year earlier.
The other two channels were structural. The European ban closed a route by which Russian molecules reached European tanks through Indian and Turkish refineries, and the 2025 closures removed capacity on both sides of the Atlantic. The UK case is telling: Grangemouth became an import terminal in 2025 and Lindsey closed, UK refinery output fell 4.8 percent to 48 million tonnes, and the country already imported 59 percent of its diesel in the first quarter of 2025. A country that imports most of its diesel pays the international diesel price, crack included.
2.2 The crack: twice 2025, almost twice 2022
Figure 2 shows the result. Panel (a) traces monthly spot prices since 2019. Until 2021 diesel, gasoline and crude moved together. In 2022, after the invasion of Ukraine, diesel separated from crude for the first time in the sample. In 2026 it separated again, faster and further. Panel (b) measures the gap directly. The New York Harbor diesel crack, computed by the author as the monthly ULSD spot price minus Brent, averaged 17.1 dollars a barrel in 2019, 10.7 in 2020, 16.1 in 2021, 55.2 in 2022, 36.5 in 2023, 21.4 in 2024 and 28.8 in 2025. It was 34.2 dollars in February 2026, averaged 70.3 dollars from March to September and reached 94.0 dollars in September, the highest monthly value since at least 2019, above the October 2022 peak of 89 dollars. The gasoline crack rose too, from 15.4 dollars in 2025 to 43.9 dollars in August, but diesel ran ahead throughout.
Refiners’ filings confirm the order of magnitude (panel c). Valero’s North Atlantic diesel margin over Brent rose from 24.64 dollars in the third quarter of 2025 to 36.54, 47.50 and 77.12 dollars in the first three quarters of 2026, against 33.46 dollars for gasoline in the third. In Europe, S&P Global reports that the ARA diesel barge crack peaked at 98.01 dollars on 1 September, averaged about 60 dollars from 1 to 12 October and rose back above 74 dollars on 16 October. Argus recorded a crack above 100 dollars for deliveries to southern Europe in early September, the first time European diesel cracks had passed that level. In Canada, Kalibrate reports a diesel refining margin of 119.4 Canadian cents a litre on 19 August, an all-time high.
The September 2026 crack is 3.3 times its 2025 average and 1.7 times its 2022 average. That is the core of the shock: of the 2.62 dollars a gallon by which US diesel spot prices rose between the 2025 average and September 2026, 1.07 dollars reflects the rise in crude and 1.55 dollars, 59 percent, the wider margin.
2.3 Diesel against petrol at the pump
Retail prices transmitted this gap. In panel (d) of Figure 2, diesel rose more than petrol between February and September by 19 percentage points in the United States, 8 in the United Kingdom and 10 in Germany and Canada. Table 2 shows the divergence in absolute terms.
Table 2. Diesel minus petrol at the pump, before and after the shock
| Country | Unit | Before | Latest | Change | Notes |
|---|---|---|---|---|---|
| United States | USD per gallon | 0.56 (2025 avg) | 1.99 (19 Oct 2026) | +1.43 | EIA weekly; diesel 6.276, regular 4.284 |
| United Kingdom | pence per litre | 7.6 (2025 avg) | 24.8 (19 Oct 2026) | +17.2 | DESNZ weekly; diesel 199.33, petrol 174.57 |
| France | euro cents per litre | -6.0 (2025 avg) | 21.6 (week of 2 Oct 2026) | +27.6 | Insee annual averages; ministry weekly data |
| Germany | euro cents per litre | -7.7 (2025 avg) | 12.0 (Sep 2026) | +19.7 | ADAC monthly averages, diesel against Super E10 |
| Canada | CAD cents per litre | 27.5 (end Feb 2026) | 52.5 (end Aug 2026) | +25.0 | Kalibrate national month-end prices |
Sources: EIA; DESNZ; Insee via prix-carburant.eu; Kelwatt (ministry data); ADAC; Kalibrate; calculations by the author.
In France and Germany diesel was cheaper than petrol in 2025 because it is taxed less: 60.75 cents of excise against about 67 cents on SP95-E10 in France, 47 cents against about 65 in Germany. By September that advantage had been more than wiped out: a French diesel driver went from paying 6 cents a litre less than a petrol driver to 21.6 cents more.
All five pump prices rose sharply in March and April, eased in May and June as Brent fell back towards 85 dollars, then rose again from July (Figure 3). In September US retail diesel averaged 6.29 dollars a gallon, the highest monthly average in the EIA series, above the 5.75 dollars of June 2022. The EU average reached 2.23 euros a litre on 24 September, a record in 19 member states, with France close to 2.40 euros and Germany at 2.46 euros. UK diesel reached 200.04 pence on 12 October in the official weekly series. Canadian diesel was 2.75 dollars a litre in mid-September according to Natural Resources Canada, against a 2022 peak of 2.25 dollars in the same series.
Relative to 2022, the previous diesel crisis, the shock is uneven. Panel (b) of Figure 3 shows that September 2026 prices were 34 percent above the 2022 average in Canada, 28 percent in France, 26 percent in the United States, 23 percent in Germany but only 9 percent in the United Kingdom. Relative to 2019 the range is wider still: 119 percent in Canada, 106 percent in the United States, 89 percent in Germany, 65 percent in France and 46 percent in the United Kingdom. The heat map in Figure 4 shows the month-by-month profile: the two North American countries ran hottest in September (72 and 68 percent above 2025), and in the United States the excess of diesel over petrol reached 31 percentage points. The next section explains most of the dispersion by the structure of taxes.
A first look at the results
The full note goes much further, with original models, scenarios and a dashboard of leading indicators. Two of its 14 charts and diagrams are shown below.
Continue reading
Get the full note: 27 pages, 14 charts and diagrams, 15 tables
This page shows the first part of the note. The full PDF adds: decomposing the pump price, 2019 to 2026; who pays: an incidence model for five countries; united States: the input-output pass-through; place and income in Europe and Canada; the two windfalls: refiners and treasuries; scenarios to end-2027; leading-indicators dashboard; implications for policy and for businesses; what to watch.
29 USD, instant PDF download, secure card payment.
Buy the full noteNeed this analysis for your organisation?
We prepare confidential briefings, executive talks and studies on countries, markets and policies, built on the same method as this article.
Request a briefingSupport independent analysis
Our studies are free to read and carry no advertising. If this one was useful, a small contribution helps us publish the next.
Support our workGo further: books by Global Strategy Files

Frequently asked questions
Why did diesel prices rise more than crude oil in 2026?
Because the barrels lost in 2026 were disproportionately middle distillates. Gulf refined product exports fell from 4.7 to 1.9 million barrels a day, about 45 percent of Russian refining capacity was offline at the end of September, the EU banned products made from Russian crude, and 2025 refinery closures had cut capacity. The New York Harbor diesel crack rose from 29 dollars a barrel in 2025 to 94 dollars in September 2026.
How much of the 2026 diesel price rise is due to refining margins rather than taxes?
Between the 2025 average and September 2026, the diesel crack explains about 59 percent of the rise in the retail price in the United States, 61 percent in the United Kingdom, 48 percent in France, 46 percent in Germany and 54 percent in Canada. Crude oil explains 31 to 41 percent. Excise duties were unchanged or cut, so taxes added only through VAT, which is proportional to the price.
Who pays for higher diesel prices: households or businesses?
Mostly businesses at first. Of an extra bill of about 249 billion dollars a year across the United States, United Kingdom, France, Germany and Canada, households pay about 19 percent directly, through diesel cars and heating oil. Freight, construction, farms and public services pay the rest and pass much of it on: in the United States the author’s input-output model puts the effect at 0.44 percent of consumer prices.
Do governments profit from high diesel prices through VAT?
Very little. Higher VAT on household diesel and on passed-on costs is largely offset by lower fuel volumes and relief measures such as Germany’s energy tax cuts and Canada’s excise suspension. The net fiscal gain ranges from minus 0.003 percent of GDP in the United States to plus 0.05 percent in France, against transfers to refiners of 0.23 to 0.49 percent of GDP.
Sources
- US Energy Information Administration: Gasoline and Diesel Fuel Update (release of 20 October 2026, data for 19 October 2026; “what we pay for in a gallon of diesel”, May 2026); Diesel fuel explained, use of diesel (2025 data); Today in Energy, “U.S. refining capacity decreased during 2025” (29 June 2026).
- FRED: GASDESM, GASREGM, MDFUELNYH, MGASNYH, DCOILBRENTEU; Federal Reserve H.10 exchange rates. Retrieved 20 to 24 October 2026.
- Valero Energy Corporation, earnings releases for the first, second and third quarters of 2026 (30 April, 30 July and 22 October 2026), Form 8-K exhibits 99.01.
- S&P Global Commodity Insights, “Diesel market remains under pressure as jet fuel crack widens in Europe” (19 October 2026).
- IAM, “Diesel hits record highs on both sides of the Atlantic” (4 September 2026), citing Argus Media and FreightWaves; Argus, “Viewpoint: Europe’s refiners eye support from closures” (23 December 2024).
- S&P Global, “UK faces surge in imports amid new refinery closure risk” (3 July 2025); DESNZ, Digest of UK Energy Statistics 2026, Chapter 3; Energy Trends June 2025, “Road diesel demand drivers”.
- Kyiv School of Economics Institute, study of the EU ban on products refined from Russian crude (11 June 2026); Oilprice.com citing Reuters, “Drone strikes cripple half of Russia’s top diesel refineries” (15 September 2026).
- International Energy Agency, Oil Market Report (14 October 2026); collective stock release decisions (11 and 19 March 2026); diesel release announced on 15 October 2026 as reported by S&P Global.
- Oil and Gas 360, EIA weekly storage report for the week ending 16 October 2026.
- Atlantic Council EnergySource, “The diesel shock is here. Which US states will be hit the hardest?” (2 September 2026).
- DESNZ, Weekly road fuel prices, CSV 2018 onwards (updated 20 October 2026); HMRC, Hydrocarbon Oils Bulletin commentary, July to December 2025.
- Full Fact, “What is happening with fuel duty?” (12 March 2026); What Car, “Fuel duty frozen until at least the end of 2026” (20 May 2026); ONS consumer price releases (petrol and diesel prices, 2026), as used in Decoded No. 10.
- ADAC, Kraftstoff-Durchschnittspreise (annual and monthly averages, accessed October 2026); retail-news.de on ADAC August 2026 prices; Autohaus on ADAC 2025 averages; en2x press release on climate costs in 2026 (22 December 2025).
- Deutscher Bundestag, Textarchiv 2026, KW 17, Energiesteuersenkung (24 April 2026); VerkehrsRundschau, report on the adoption of the second 2026 energy tax cut (28 September 2026); Autohaus citing BAFA fuel sales 2024 (15 July 2025); motor.com.de on KBA vehicle stock at 1 January 2026.
- Insee, Insee Premiere No. 2125, “Les depenses de carburant pesent davantage sur le budget des menages ruraux” (8 September 2026); prix-carburant.eu, price history and fleet data citing Insee and SDES; Kelwatt, fuel prices in early October 2026 (ministry and DGEC data); Connaissance des Energies (AFP), EU diesel prices (24 September 2026), French fuel consumption in 2025 (CPDP and Ufip), and additional diesel supply (20 October 2026); Comite National Routier, monthly bulk diesel prices.
- Government of France, support measures for fuel-intensive sectors (21 May 2026), as cited in Foresight No. 8.
- Kalibrate, Canadian Petroleum Price Snapshots (January to August 2026, September 2025) and Petroleum Pricing Newsletter Q2 2025; Transport Canada, Transportation in Canada addendum table EC19; Statistics Canada, The Daily: motor vehicle fuel sales 2024 (22 September 2025), end use of refined petroleum products 2024, vehicle registrations 2024 (17 October 2025).
- Knowledge Bureau, “Federal excise tax suspension extended” (9 September 2026); Western Producer, “Federal fuel excise tax holiday extended”; EnergyNow (Canadian Press), “Ontario farmers looking for help amid record diesel costs” (September 2026); BNN Bloomberg, “Now at historic highs, diesel prices poised to hit consumers even harder” (29 September 2026).
- US Bureau of Labor Statistics, Consumer Expenditure Survey, Table 1101 (income quintiles, 2022); CPI September 2026. Diesel Technology Forum on US diesel vehicles in operation.
- US Bureau of Economic Analysis input-output accounts (2023 summary tables, 2017 schema) via the USEPA useeior repository on GitHub.
- RAC Foundation, ONS spending on cars by disposable income decile, FYE 2019; New AutoMotive via Regit (19 January 2026); SMMT Motorparc 2025.
- IMF World Economic Outlook, October 2026 (NGDPD); World Bank, World Development Indicators (SP.POP.TOTL). Retrieved 20 October 2026.
Books from Global Strategy Files
Go further on this topic


