
Trade Blocs: The GDP Cost of Fragmentation to 2035. A Ten-Region Model of Tariffs, Blocs and Friend-Shoring for the United States, United Kingdom, France, Germany and Canada

Driss EFFINA, PhD Independent Researcher, Global Strategy Files Foresight, prospective note No. 16, 24 October 2026. Reading time: about 55 minutes
Key takeaways
- Goods trade with the China-led bloc equals only 1.3 percent of GDP in the United States and 3.2 to 5.5 percent in the four allies; trade inside the US-led bloc is 8 to 10 times larger, and Canada’s trade with the United States alone equals 28.5 percent of its GDP.
- The October 2026 tariff layer costs Canada 0.32 percent of real income and Europe 0.04 to 0.06 percent; the model’s 0.26 percent US gain rests on foreign exporters cutting prices, which the data do not yet show.
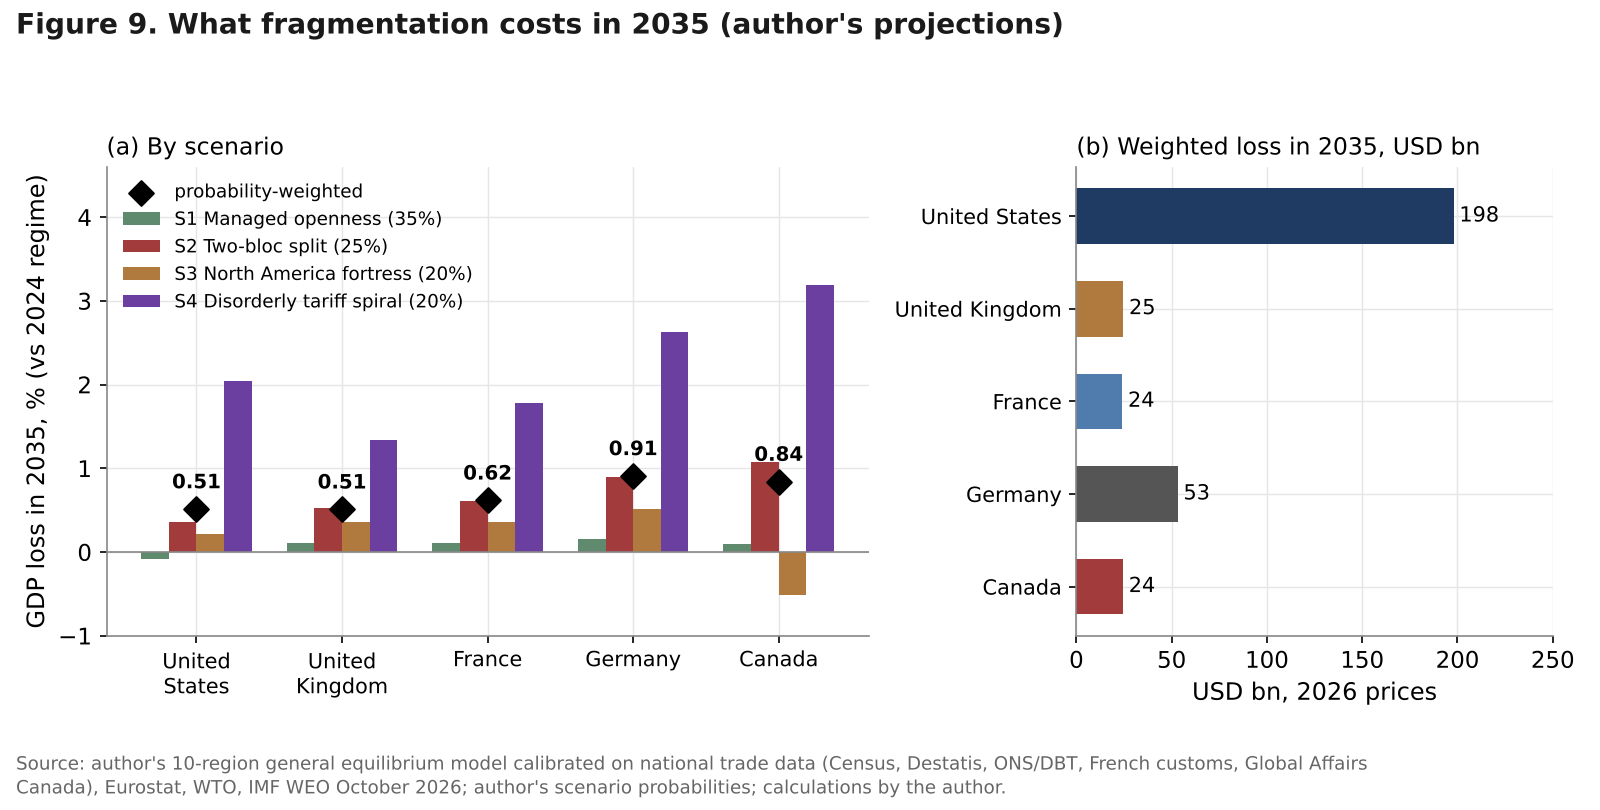
- Weighted across four scenarios, GDP in 2035 is 0.51 to 0.91 percent lower than under the 2024 regime, about 324 billion dollars a year for the five; a disorderly tariff spiral would cost 1.34 to 3.19 percent, about 1.17 trillion dollars.
- Halving imports from the China-led bloc costs 0.17 to 0.32 percent of GDP a year and pays only if a year-long cut-off had a 28 to 43 percent annual probability: insure critical inputs narrowly, not supply chains broadly.
Abstract
The trading system has not collapsed, but it has been rebuilt on new legal foundations. After the Supreme Court struck down the emergency tariffs on 20 February 2026, a 150-day surcharge bridged the gap until Section 301 duties of 10 or 12.5 percent on 60 economies took over on 24 July, on top of Section 232 sector duties. The average effective US tariff was 7.4 percent in August 2026, against 2.3 percent in January 2025, and 22.3 percent on China; the US-China truce runs to 10 January 2027. Trade has already moved: China’s share of US goods imports fell from 13.4 percent in 2024 to 7.6 percent in January to August 2026, while Germany’s imports from China rose 8.9 percent in the first half of 2026.
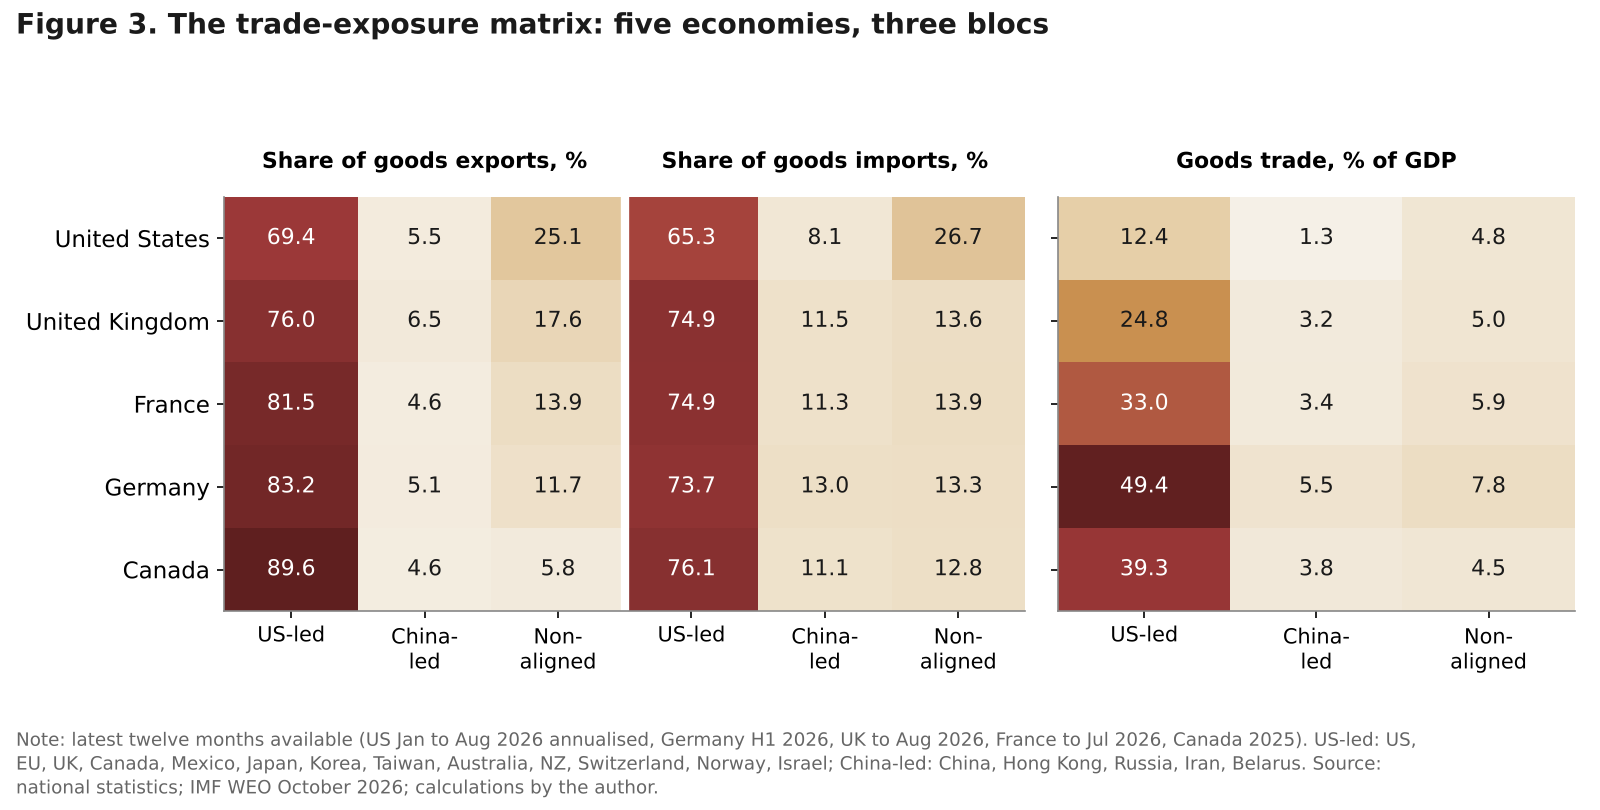
This note asks what a world of trade blocs will cost five advanced economies by 2035. It builds four original tools: a trade-exposure matrix that maps each country’s goods trade onto a US-led bloc, a China-led bloc and a non-aligned group, using the latest national data; a ten-region general equilibrium model, calibrated on that matrix and on the October 2026 tariff layer, which reproduces the measured US effective tariff rate; four scenarios to 2035 with explicit tariff and non-tariff assumptions and probabilities (managed openness, two-bloc split, North America fortress and a disorderly tariff spiral); and a cost-benefit test of friend-shoring that sets its annual cost against the losses it would avoid in a supply cut-off. All projections are the author’s. The note does not revisit the North American supply chain analysis of Decoded No. 13, the Canadian options of Foresight No. 11 or the mineral chokepoints of Foresight No. 13; it refers to them where they matter.
Keywords: trade fragmentation, geoeconomic blocs, tariffs, Section 301, Section 232, friend-shoring, terms of trade, general equilibrium, gravity, scenarios, resilience
JEL codes: F13, F14, F17, F51, F52, F62
Key findings
1. Exposure to a China-led bloc is small next to exposure to allies, and Canada’s real risk is Washington. In the author’s trade-exposure matrix, goods trade with the China-led bloc equals 1.3 percent of GDP for the United States, 3.2 percent for the United Kingdom, 3.4 percent for France, 3.8 percent for Canada and 5.5 percent for Germany. Trade with the US-led bloc is 8 to 10 times larger in every case. Canada’s goods trade with the United States alone equals 28.5 percent of its GDP, more than seven times its trade with the China-led bloc.
2. The October 2026 tariff layer is mostly a transfer, and the data do not yet show the US side of it. Against the 2024 regime, the model puts the static cost of the current layer at 0.32 percent of real income for Canada, 0.20 percent for Mexico and 0.04 to 0.06 percent for the United Kingdom, France and Germany. The United States gains 0.26 percent in the model, almost entirely (0.23 points) through better terms of trade, a gain that requires foreign exporters to cut prices. US import prices excluding duties rose instead, which means the gain has so far gone to nobody: it has been paid by US buyers.
3. The expected cost of fragmentation to 2035 is 0.5 to 0.9 percent of GDP, about 324 billion dollars a year for the five economies, but the risk is in the tail. Weighting the four scenarios by the author’s probabilities (35, 25, 20 and 20 percent), GDP in 2035 is lower than under the 2024 regime by 0.91 percent in Germany, 0.84 percent in Canada, 0.62 percent in France and 0.51 percent in both the United States and the United Kingdom. In a disorderly tariff spiral the losses reach 1.34 to 3.19 percent, about 1.17 trillion dollars in 2035, more than four times the cost of a clean two-bloc split (270 billion).
4. A tariff war is costly for the United States only because others fire back. In the spiral, US tariffs on their own leave US real income 0.09 percent higher in the long run, while partners’ barriers cost 1.04 percent. Germany, by contrast, loses on both counts (0.81 and 0.73 percent). Without the knowledge-diffusion channel, the expected US loss falls from 0.59 to 0.07 percent in the steady state: for the United States, the cost of fragmentation is mostly a slower-growth cost, not a lost-trade cost.
5. A North America fortress moves welfare from Europe to Canada and Mexico. If the three USMCA members remove tariffs among themselves and build a common external wall, Canada’s GDP ends 0.52 percent and Mexico’s 1.62 percent above the 2024 regime by 2035, while the United States loses 0.21 percent and European exports to the United States fall by 33 to 39 percent. Germany loses 0.51 percent, more than in managed openness and less than in a two-bloc split.
6. Blanket friend-shoring is expensive insurance. Halving the China-led share of the US-led bloc’s imports requires a barrier equivalent to a 27 percent tariff and costs 0.17 to 0.32 percent of GDP every year. It halves the loss from a one-year cut-off of trade with the China-led bloc, avoiding 0.40 percent of GDP in the United States and 1.00 percent in Germany. It pays only if such a cut-off has an annual probability of 28 to 43 percent, far above any plausible estimate. Targeted measures on a few critical inputs pass the test; across-the-board reshoring does not.
1. Introduction: from one trading system to three blocs
For three decades the five economies in this note traded in a single system: one set of most-favoured-nation tariffs, one dispute settlement body, and supply chains that crossed political lines with little friction. That system is now splitting along two seams at once. The first runs between the United States and China, and it has been visible since 2018. The second is newer and runs through the Western alliance itself, as the United States taxes imports from its allies, renegotiates its agreements and uses tariffs as leverage in disputes that have nothing to do with trade.
The question is no longer whether the world economy fragments, but how far, along which lines and at what cost. The answer matters for the five economies in different ways. The United States trades little relative to its size and sits at the centre of the bloc it leads. Germany is the most open large economy in the group, with goods trade worth more than 60 percent of its GDP. Canada sends nearly three quarters of its goods exports to a single market that has turned against it. The United Kingdom and France sit in between, with large services sectors and significant reliance on Chinese manufactured imports.
Published estimates of fragmentation costs are mostly global and long term, from 0.2 to 7 percent of world GDP in the IMF’s 2023 Staff Discussion Note. They say little about where the five economies stand in October 2026, what the current tariff layer has already cost and which path is most likely. This note answers those questions with a model built on the latest trade data and the tariff rates now in force. Figure 1 summarises how fragmentation shocks travel from policy to GDP.
Sections 2 to 4 describe the trade regime, the exposure matrix and the published evidence. Sections 5 to 8 present the model, price the current tariff layer, run four scenarios to 2035 and test friend-shoring. Sections 9 to 13 cover sectors, robustness, a dashboard, implications and what to watch.
2. The trade regime in October 2026
2.1 The US layer after the Supreme Court
The US tariff layer of October 2026 is the product of a legal accident and a fast repair. On 20 February 2026 the Supreme Court ruled that the tariffs imposed under the International Emergency Economic Powers Act (IEEPA) were unlawful. The administration replaced them with a temporary 10 percent global tariff under Section 122 of the Trade Act of 1974, which allows a surcharge of up to 15 percent for no more than 150 days. When that authority expired at 12:01 a.m. on 24 July 2026, new duties under Section 301 took effect at the same moment, based on findings that 60 economies had failed to enforce bans on goods made with forced labour.
The Section 301 duties have two tiers. Nineteen economies pay 10 percent, including Canada and Mexico (with USMCA-qualifying goods exempt), the United Kingdom and India; forty-one pay 12.5 percent, including China, Vietnam, Japan, Korea and Switzerland. The European Union and Taiwan pay a combined 10 percent including the normal duty. Goods under Section 232 and inputs for US manufacturing are exempt. The duties were challenged at the Court of International Trade on the day they took effect.
Section 232 remains the backbone of the layer. Since 6 April 2026, metal duties apply to the full customs value of covered goods, at 50 percent for articles made of steel, aluminium or copper and 25 percent for derivatives; vehicles and parts pay 25 percent, with deductions for US content and preferential rates for partners with deals. A proclamation of 2 April 2026 added patented pharmaceuticals, at 100 percent by default but 15 percent for the European Union, Japan, Korea and Switzerland, with zero rates for companies that sign pricing and onshoring agreements; it took effect between 31 July and 29 September 2026. Canada faces a third layer: since 22 August 2026, 50 percent duties under Section 338 of the Tariff Act of 1930 on about 17.7 billion dollars of goods, which USMCA qualification does not shield (see Foresight No. 11). A further Section 301 investigation, launched on 11 March 2026 into excess capacity in 16 economies including China, the European Union, Japan, Korea and Mexico, had produced no proposed remedy when hearings ended in May, and none had been confirmed by this note’s cut-off.
Table 1 summarises the layer.
Table 1. The US tariff layer and partner responses, as of 24 October 2026. Sources: Holland and Knight (30 July 2026); Fitch Ratings (4 August 2026); Polsinelli (3 April 2026); White and Case (March 2026); Make UK (August 2026); PIIE (22 August 2026); Baker McKenzie (19 June 2026); Decoded No. 13 and Foresight No. 11 for Sections 232 and 338.
| Measure | Legal basis | Rate | Who is covered | Status |
|---|---|---|---|---|
| Forced-labour duties | Section 301 | 10% or 12.5% (EU, Taiwan: 10% including MFN) | 60 economies | In force since 24 Jul 2026; court challenge |
| Metals, vehicles, parts, trucks | Section 232 | 50% / 25% on full value; 25% vehicles | All partners, deal rates for some | In force |
| Patented pharmaceuticals | Section 232 | 100% default; 15% EU, Japan, Korea, Switzerland | Branded drugs and APIs | Phased in, 31 Jul to 29 Sep 2026 |
| Canadian goods | Section 338 | 50%, no USMCA relief | About 17.7 bn USD | In force since 22 Aug 2026 |
| Excess capacity | Section 301 | Not yet set | 16 economies | Hearings held 5 to 8 May 2026 |
| China’s tariff on US goods | Retaliation | Average 31.9% (statutory) | 100% of US goods | Countermeasures partly suspended by truce |
| EU tariff cuts for US industrial goods | EU regulation | 0% on industrial goods | US exports to the EU | Approved by Parliament 16 Jun 2026; sunset 31 Dec 2029 |
| Measured outcome | 7.4% average; 22.3% China; 5.3% Canada; 3.7% Mexico | All US imports | August 2026 |
What matters for the economy is the rate actually paid. Fitch Ratings measured the US average effective tariff at 7.4 percent in early August 2026, down from 9.4 percent under the Section 122 surcharge, with 22.3 percent on China, 13.3 percent on Japan, 9.7 percent on Korea, 5.3 percent on Canada, 3.7 percent on Mexico and 2.8 percent on Taiwan (Figure 2, panel a). The Penn Wharton Budget Model, which measures the same concept from customs data, reported 7.1 percent in June 2026 against 2.3 percent in January 2025. The Section 301 framework exempts much of the electronics trade, and US imports of electronics and semiconductors rose to about 800 billion dollars from 340 billion in 2024, which helps explain why the average rate is far below the headline rates.
2.2 Europe, Canada and Mexico respond
The European Union chose accommodation. The European Parliament approved on 16 June 2026 the two regulations that implement its side of the August 2025 Joint Statement: tariffs on US industrial goods are removed and US seafood and some farm goods gain preferential access, at a cost to EU customs revenue of about 3.9 billion euros a year. The deal carries its own tripwires. It expires on 31 December 2029, and the Commission may suspend it if the United States still applies rates above 15 percent to EU steel and aluminium derivatives after 31 December 2026, a test the current 50 and 25 percent rates would fail. The Commission owes Parliament a report on that question by 1 December 2026.
At the same time Europe is raising its own walls against diverted trade. A permanent steel regime, Regulation 2026/1384, entered into force on 1 July 2026: the out-of-quota duty doubled to 50 percent, tariff-free quotas were cut by about 47 percent to some 18.3 million tonnes a year, and from 1 October 2026 importers must prove where the steel was first melted and poured.
The United Kingdom kept its May 2025 deal: 10 percent on most goods, 100,000 vehicles at 10 percent and zero on covered aerospace. Canada answered the Section 338 duties with counter-tariffs on 27.6 billion Canadian dollars of US goods in September 2026, and in January 2026 agreed with China to admit up to 49,000 Chinese electric vehicles at 6.1 percent, against 100 percent before, while China cut its duty on Canadian canola seed from 84 percent to about 15 percent. Mexico raised tariffs of 5 to 50 percent on imports from Asian economies without a trade agreement, China included, from 1 January 2026.
2.3 China and the truce
The US-China relationship is governed by a truce agreed in late 2025 and extended in September 2026 to 10 January 2027. Under it the United States reduced its fentanyl-related tariff to 10 percent and suspended a Section 301 action on Chinese shipping, while China suspended retaliatory tariffs and non-tariff countermeasures, paused its October 2025 rare earth controls and agreed to buy 25 million tonnes of US soybeans over three years. According to the Peterson Institute’s tracker, the average US tariff on Chinese goods was still 35.2 percent in August 2026, covering 89 percent of them, and China’s average tariff on US goods 31.9 percent, 10.7 points above January 2025. The truce lowers the temperature without lowering these averages back to 2024 levels. Foresight No. 13 analyses the mineral side of the truce.
2.4 What the WTO sees
Trade volumes have so far resisted. On 8 October 2026 the WTO raised its forecast for world merchandise trade growth in 2026 to 3.9 percent, from 1.9 percent in March, and projected 4.1 percent for 2027 (Figure 2, panel c). AI-enabling goods accounted for 42 percent of merchandise trade growth in 2025 while making up about one sixth of trade. The regional split is telling: in 2026 the WTO expects Asia’s exports to grow 9.9 percent and North America’s 5.7 percent, while Europe’s fall by 0.1 percent.
Beneath the totals, fragmentation is measurable. Since the war in Ukraine, trade between geopolitical blocs has grown about 4 percent more slowly than trade within them, and the share of world trade on most-favoured-nation terms fell from about 80 to 72 percent by February 2026. China’s exports to the United States fell about 20 percent in 2025, while those to other destinations rose by about 301 billion dollars, lifting its surplus to a record 1.19 trillion. Germany’s figures for the first half of 2026 show where part of that surplus went: exports to China fell 12.3 percent and exports to the United States 5.8 percent, while imports from China rose 8.9 percent (Figure 2, panel d).
A first look at the results
The full note goes much further, with original models, scenarios and a dashboard of leading indicators. Two of its 15 charts and diagrams are shown below.
Continue reading
Get the full note: 28 pages, 15 charts and diagrams, 11 tables
This page shows the first part of the note. The full PDF adds: who trades with whom: the exposure matrix; what fragmentation costs: the evidence so far; a ten-region model; the bill for the 2026 tariff layer; four scenarios to 2035; friend-shoring: insurance or tax?; sector winners and losers; robustness; leading-indicators dashboard.
29 USD, instant PDF download, secure card payment.
Buy the full noteNeed this analysis for your organisation?
We prepare confidential briefings, executive talks and studies on countries, markets and policies, built on the same method as this article.
Request a briefingSupport independent analysis
Our studies are free to read and carry no advertising. If this one was useful, a small contribution helps us publish the next.
Support our workGo further: books by Global Strategy Files

Frequently asked questions
How much could trade fragmentation cost the US, UK, France, Germany and Canada by 2035?
On a ten-region general equilibrium model with four scenarios weighted by probability, GDP in 2035 is lower than under the 2024 trade regime by 0.91 percent in Germany, 0.84 percent in Canada, 0.62 percent in France and 0.51 percent in the United States and United Kingdom, about 324 billion dollars a year in total. A disorderly tariff spiral would raise the losses to 1.34 to 3.19 percent.
Which economy is most exposed to a split between US-led and China-led trade blocs?
Germany. Its goods trade with the China-led bloc equals 5.5 percent of GDP, about four times the US figure of 1.3 percent, and its trade with non-aligned economies another 7.8 percent. Canada is most exposed to a break inside the Western bloc: its goods trade with the United States alone equals 28.5 percent of GDP, more than seven times its trade with the China-led bloc.
What is the US effective tariff rate in 2026?
Fitch Ratings measured the average effective US tariff at 7.4 percent in August 2026, against 2.3 percent in January 2025. After the Supreme Court struck down the emergency tariffs in February 2026, Section 301 duties of 10 or 12.5 percent on 60 economies took effect on 24 July 2026, on top of Section 232 sector duties. The effective rate is 22.3 percent on China, 5.3 percent on Canada and 3.7 percent on Mexico.
Is friend-shoring worth its cost?
Not as a blanket policy. In the author’s model, halving the China-led share of imports across the US-led bloc needs a barrier equivalent to a 27 percent tariff and costs 0.17 to 0.32 percent of GDP every year. It halves the loss from a one-year cut-off of trade with China, but only pays if such a cut-off had an annual probability of 28 to 43 percent. Targeted stockpiles and dual sourcing for critical inputs are far cheaper.
Sources
- US Census Bureau, “Top Trading Partners: Total Trade, Exports, Imports”, year to date December 2024 and year to date August 2026; “Trade in Goods with European Union” (country page c0003), retrieved 24 October 2026.
- Statistisches Bundesamt (Destatis), press release PD26_056_51, “China im Jahr 2025 wieder wichtigster Handelspartner Deutschlands”, February 2026; press release No. 278 of 7 August 2026 (foreign trade, June 2026).
- Ost-Ausschuss der Deutschen Wirtschaft, “Top 25 Aussenhandelspartner 1. Halbjahr 2026” (Destatis data), 2026.
- Department for Business and Trade, “Trade and investment core statistics book” (ONS UK trade, August 2026 release), retrieved 24 October 2026; “United States trade and investment factsheet”, 2026.
- Direction generale des douanes et droits indirects, “Resultats du commerce exterieur de la France pour le mois de decembre et pour l’annee 2025”, 9 February 2026.
- Ministere de l’Economie, “Apercu du commerce exterieur”, July 2026 (lekiosque.finances.gouv.fr).
- Ministere de l’Europe et des Affaires etrangeres, country sheets “Chine” and “Etats-Unis”, 25 February 2026.
- Global Affairs Canada, “Highlights of Canada’s merchandise trade performance: 2025 update”, 2026.
- Library of Parliament, “Trade and investment profile: European Union”, publication 2026-513-E.
- Eurostat, euro indicators, “Euro area international trade in goods surplus”, 13 February 2026 (EU trade 2025).
- South China Morning Post, “China records US$1.19 trillion trade surplus in 2025”, January 2026.
- WTO, “Global Trade Outlook and Statistics”, March 2026; WTO press coverage of the October 2026 update via Nairametrics, 9 October 2026.
- Holland and Knight, “And the (Tariff) Beat Goes On: New Section 301 Forced-Labor Tariffs Imposed on 60 Countries”, 30 July 2026; “More Section 301 Tariffs Are Coming”, 7 August 2026.
- Fitch Ratings, “US Effective Tariff Rate Falls to 7.4% on Latest Tariffs and Changing Trade Flows”, via Hellenic Shipping News, 4 August 2026.
- Penn Wharton Budget Model, “Effective Tariff Rates and Revenues (Updated August 10, 2026)”.
- Peterson Institute for International Economics, “US-China Trade War Tariffs: An Up-to-Date Chart”, data as of 22 August 2026.
- McKibbin, W., M. Noland and G. Shuetrim, “The global trade war: An update”, PIIE, 1 October 2025.
- White and Case, “USTR initiates Section 301 investigations of 16 US trade partners targeting industrial excess capacity”, March 2026; Mexico Business News, “Mexico Faces New Tariff Round as 301 Probe Nears Close”, 29 July 2026.
- US Bureau of Labor Statistics, import and export price indexes, September 2026, as reported in Decoded No. 13.
- White and Case, “USMCA 2026 Joint Review: United States declines to extend Agreement, triggering annual reviews”, July 2026 (as cited in Decoded No. 13).
- Polsinelli, “Trump Administration Expands Section 232 Tariffs to Patented Pharmaceuticals and APIs”, 3 April 2026.
- Supply Chain Dive, “US, China to extend trade war truce by 2 months”, 24 September 2026.
- Baker McKenzie, “EU: Update on the EU-US tariff agreement”, 19 June 2026; Lovguiden, provisional agreement on the EU-US tariff regulations, 20 May 2026.
- SMM (Shanghai Metals Market), “EU’s permanent steel safeguard takes hold: 50% out-of-quota duty, quotas cut 47%”, 2026 (Regulation 2026/1384).
- Make UK, “United States” trade page, updated August 2026.
- Thomson Reuters, “Mexico approves tariff hikes on imports from China”, 15 December 2025.
- Al Jazeera, “Canada, China strike trade deals to slash tariffs on EVs, canola”, 16 January 2026.
- Observer Research Foundation, “The India-EU FTA: from political agreement to ratification and coming into force”, 13 March 2026.
- Wikipedia, “2026 G20 Miami summit” (dates and venue), retrieved 24 October 2026.
- Aiyar, S. and others, “Geoeconomic Fragmentation and the Future of Multilateralism”, IMF Staff Discussion Note SDN/2023/001, January 2023.
- Attinasi, M. G. and others, “Navigating a fragmenting global trading system: insights for central banks”, ECB Occasional Paper No. 365, 2024, as summarised in VoxEU, “Trade wars and fragmentation: Insights from a new ESCB report”.
- Asia News Network, “WTO warns of global GDP loss through decoupling and fragmentation”, 28 June 2023.
- Javorcik, B., L. Kitzmueller, H. Schweiger and M. Yildirim, “Economic Costs of Friend-Shoring”, EBRD Working Paper No. 274, December 2022.
- Kowalski, P., F. van Tongeren and C. Arriola, “Localising value chains in the post-COVID world would add to the economic losses and make domestic economies more vulnerable”, VoxEU, 15 November 2020; OECD, “Global value chains: efficiency and risks in the context of COVID-19”.
- World Economic Forum with Oliver Wyman and NERA, “Deepening Divides” (June 2026), as summarised by Oliver Wyman (4 June 2026) and the WEF (8 June 2026).
- Alfaro, L. and D. Chor, “Global supply chains: the looming ‘great reallocation'”, VoxEU, 28 September 2023.
- McKinsey Global Institute findings on supply chain disruptions, as reported by Consulting.us, 20 August 2020.
- Caliendo, L. and F. Parro, “Estimates of the Trade and Welfare Effects of NAFTA”, Review of Economic Studies, 2015; Arkolakis, C., A. Costinot and A. Rodriguez-Clare, “New Trade Models, Same Old Gains?”, American Economic Review, 2012.
- UN Comtrade merchandise exports 2023 and IMF 2026 GDP estimates, as compiled by Wikipedia (“List of countries by merchandise exports”; “List of countries by GDP (nominal)”), retrieved 24 October 2026.
- IMF, World Economic Outlook, October 2026, via DataMapper (NGDPD, NGDP_RPCH for the five economies and China), retrieved 20 October 2026.
- Federal Reserve Bank of St. Louis, FRED, series DCOILBRENTEU (Brent, monthly averages), retrieved 20 October 2026.
- European Central Bank, euro foreign exchange reference rates, 2025 annual averages.
- Global Strategy Files, Decoded No. 13 “Tariffs plus Oil” and Foresight No. 11 “The Sovereignty Ledger” and No. 13 “Critical Minerals 2030” (for Section 232 and 338 details, the USMCA review and the Canadian auto tariff threat, with their cited sources).
Books from Global Strategy Files
Go further on this topic
The Tariff GambleHow America’s trade war is reshaping power, prices and prosperity.24.99 USD, see the book The Trump ProphecyPopulism, power and the remaking of US politics.20 USD, see the book
 Kill KennedyWhat the 2025 declassified files reveal about the machinery of American power.20 USD, see the book
