
The Thin Cushion: Storage, LNG and Price Paths for Europe’s Gas Winter 2026 to 2027

Driss EFFINA, PhD Independent Researcher, Global Strategy Files Decoded, analysis note No. 14, 24 October 2026. Reading time: about 55 minutes
Key takeaways
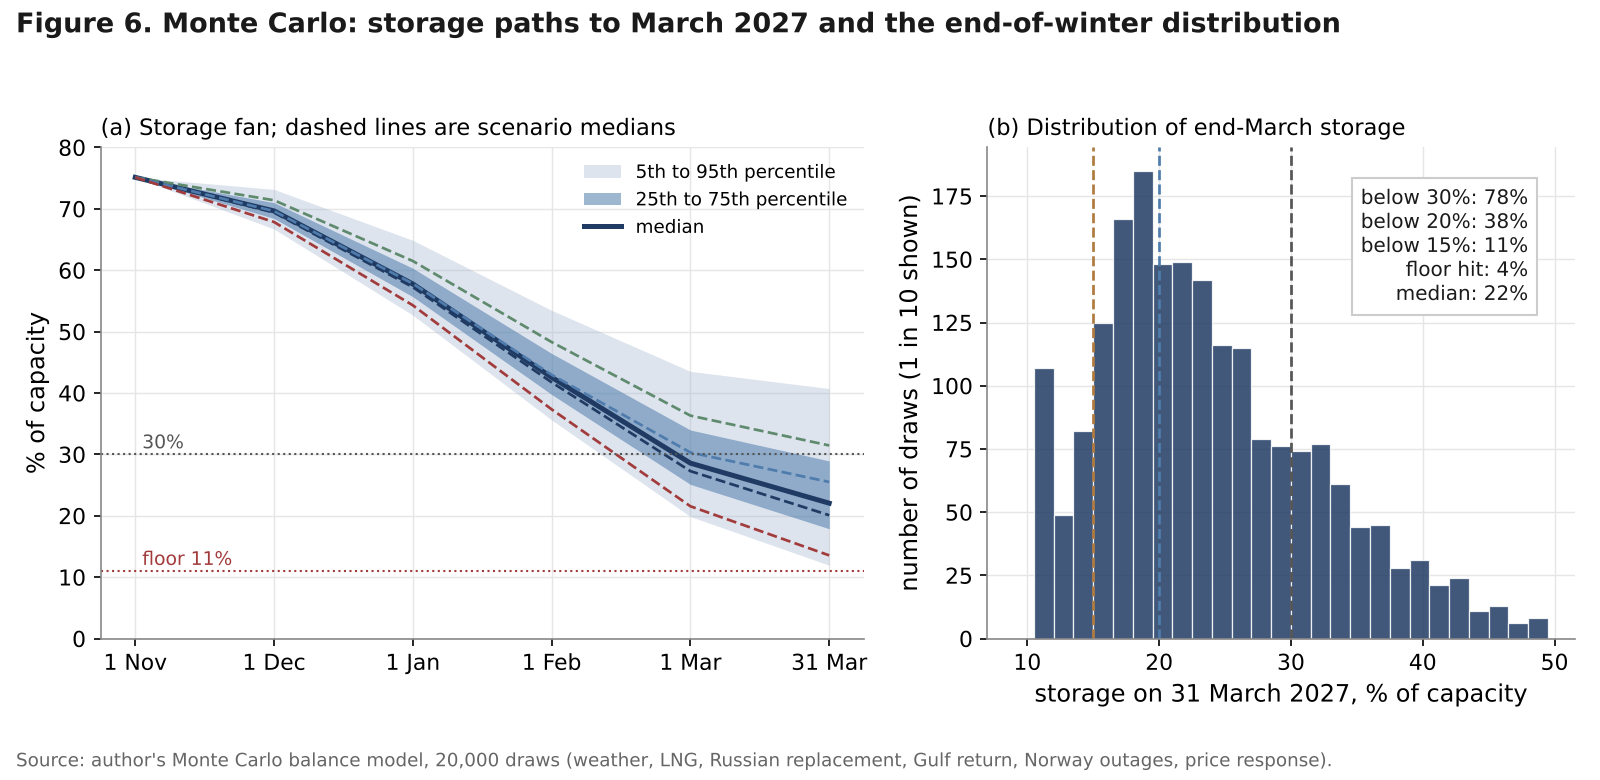
- EU gas storage was 74.6 percent full on 22 October 2026, 14.8 points below the five-year average. A Monte Carlo balance model calibrated to ENTSOG puts the median at 22 percent on 31 March 2027, with a 78 percent chance below 30 and a 4 percent chance of reaching the floor.
- Europe lacks cargoes, not terminals: ending March at 30 percent in normal weather needs 864 TWh of LNG, 14 percent above last winter’s pace, against 1,327 TWh of capacity. The Russian LNG ban from 1 January removes about 77 TWh in the first quarter.
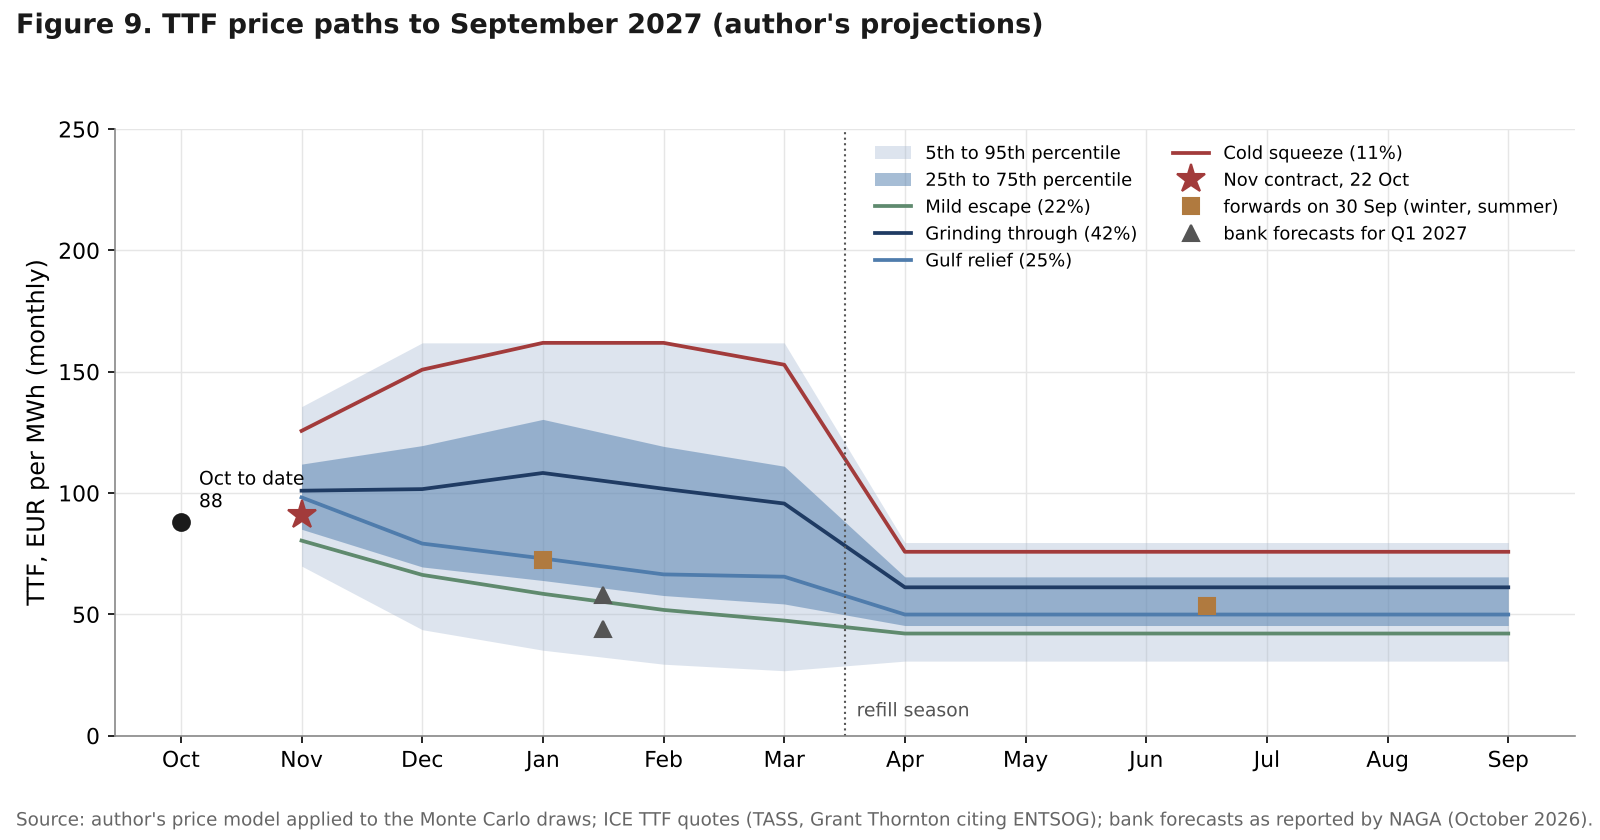
- Each point of storage shortfall adds about 6.3 percent to TTF. The model’s median for the first quarter of 2027 is 88 euros per MWh, with a 40 percent chance above 100; the bigger risk is the 2027 refill, with a 43 percent chance of storage below 75 percent on 1 November 2027.
- The weighted extra wholesale cost of the winter is 22.7 billion euros in Germany, 10.9 billion in France and 10.9 billion in the UK. Henry Hub stays near 3 dollars because US liquefaction is full; the transatlantic spread is worth about 6 billion dollars a month.
Abstract
Europe enters the winter of 2026 to 2027 with less gas in storage than at the same date in any year since at least 2017. On 22 October the EU’s underground storage was 74.6 percent full, 845 terawatt-hours (TWh) out of 1,132, against 82.8 percent a year earlier and a five-year average of 89.4 percent. Germany was at 61.2 percent, below its own 70 percent reference level for 1 November. The United Kingdom held 13.1 TWh, about nine days of current demand. Three shocks explain the gap and will shape the next five months: the loss of most Gulf liquefied natural gas (LNG) since the war that began on 28 February, which removed about 9 billion cubic metres (bcm) a month from the world market; the EU ban on Russian LNG under long-term contracts, which takes effect on 1 January 2027; and an injection season in which European LNG send-out fell by 4.2 bcm year on year in the third quarter. The Dutch TTF front-month price reached 91 euros per megawatt-hour (MWh) on 22 October, nearly three times its pre-war level, while the American Henry Hub price stayed near 3.1 dollars per million British thermal units (MMBtu).
This note builds four tools: a monthly balance model of the EU gas system to March 2027, calibrated to ENTSOG and run 20,000 times with the Russian LNG ban, a possible Gulf return, Norwegian outages and a price response of demand; a scarcity curve linking TTF to the expected end-of-winter storage level; a cost model for households and industry in Germany, France and the United Kingdom; and a measure of the transatlantic spread on US cargoes. All projections are the author’s.
Keywords: natural gas, gas storage, LNG, TTF, NBP, Henry Hub, winter outlook, energy security, Monte Carlo, Russian LNG ban, Qatar, Strait of Hormuz
JEL codes: Q41, Q43, Q48, E31, F14
Key findings
1. The median outcome is an EU storage level of 22 percent on 31 March 2027, and the distribution is skewed to the downside. In 20,000 simulations of the author’s balance model, storage ends below 30 percent with a probability of 78 percent, below 20 percent with 38 percent and below 15 percent with 11 percent. In 4 percent of draws it reaches the technical floor of about 11 percent, where demand must be curtailed. The 10th to 90th percentile range is 15 to 36 percent. With normal weather and no Gulf return, it would be 17 percent, against 29 percent in ENTSOG’s reference case.
2. The binding constraint is cargoes, not terminals. Ending the winter at 30 percent in normal weather requires about 864 TWh of LNG send-out from November to March, 14 percent more than last winter’s pace (758 TWh) and 21 percent more than the author’s base supply (716 TWh), while regasification capacity is 1,327 TWh over the same months. The Russian ban removes about 77 TWh of Yamal LNG in the first quarter of 2027; if 60 percent is replaced through cargo swaps, the net loss is 31 TWh, or 2.7 points of storage. Each 0.1 TWh a day of LNG is worth 1.3 points of storage; each point of extra demand costs 1.9.
3. Each point of storage shortfall adds about 6.3 percent to the TTF price, and today’s price already assumes a thin end of winter. The calibrated scarcity curve says the 22 October price of 91 euros per MWh is consistent with an expected end-March level of about 20 percent, close to the model’s own expectation. The model’s median for the first quarter of 2027 is 88 euros, with a 40 percent chance of an average above 100 euros and a 10 percent chance above 150 euros. Summer 2027 settles near 57 euros because the refill keeps prices high.
4. The second winter is the bigger risk. Starting the summer from about 22 percent, and with injection capacity calibrated to the 2026 refill, the median storage level on 1 November 2027 is 77 percent. The probability of missing 75 percent, the lowest level the EU rules allow with full flexibility, is 43 percent, and 68 percent if the Gulf stays constrained and weather is normal. If Gulf LNG returns by February 2027, that probability falls to 4 percent.
5. The probability-weighted wholesale cost of the winter, against 2025 prices, is 22.7 billion euros for Germany (0.46 percent of GDP), 10.9 billion for France (0.34 percent) and 10.9 billion for the United Kingdom (0.29 percent). A cold squeeze roughly doubles those figures, to 45.6, 21.9 and 21.9 billion euros. Households and small firms carry 55 to 84 percent of the cost. At full pass-through of the weighted winter price, a German house using 20,000 kWh pays about 1,340 euros a year more than at 2025 prices, close to the observed rise in new-customer tariffs (1,160 euros). The United Kingdom has the thinnest buffer, about six days of winter demand.
6. Across the Atlantic, the spread is the shock absorber, not the Henry Hub price. On 22 October TTF was worth 29.9 dollars per MMBtu, 9.6 times Henry Hub. On the author’s estimate that 9 billion cubic feet a day (Bcf/d) of US LNG reaches Europe, the margin above the full delivered cost of US LNG is worth about 6.1 billion dollars a month at current prices and about 31 billion dollars over the winter on a probability-weighted basis. Henry Hub does not respond because US liquefaction is close to capacity (17.6 Bcf/d of exports in 2026, 18.6 in 2027). Canada matters through 6.1 Bcf/d of net pipeline exports to the United States, equal to 35 percent of US LNG export volume.
1. Introduction: why this winter is different
Gas storage bridges two seasons: filled in summer, it supplies a quarter or more of winter consumption and absorbs the swings of weather. ENTSOG, the association of European gas transmission operators, estimates that storage covered about 26 percent of EU consumption in winter 2025 to 2026 and about 30 percent the winter before. The starting level is the first number any assessment of gas security looks at, and in October 2026 it is poor.
Three features make this winter unusual. First, the starting level is low even by recent standards, after an injection season disrupted by the loss of Gulf LNG. The Oxford Institute for Energy Studies (OIES) noted in July that stocks at the start of November could be the lowest since 2012 or 2013. Second, the supply mix will change in the middle of the winter: from 1 January 2027, EU buyers may no longer import Russian LNG under long-term contracts, which removes a supplier that delivered a record volume to the EU in 2026. Third, prices are already high: TTF rose by about 214 percent between the start of the year and 19 October.
Published assessments usually answer one question each: ENTSOG tests supply adequacy, banks forecast prices, regulators set household caps. This note connects them. It asks how low storage could fall by the end of March, how likely each outcome is, what it implies for prices through the summer of 2027, and who pays, with the United Kingdom, France and Germany as consumers and the United States and Canada as suppliers. It does not revisit the energy mix to 2030, covered in Foresight No. 8; the horizon is the next twelve months.
Figure 1 sets out the causal chain. Weather drives demand; Gulf LNG, the Russian ban and Norwegian pipelines drive supply; storage absorbs the difference, and the expected end-of-winter level drives the TTF price. The price feeds back by rationing demand and pulling cargoes from Asia, and reaches bills with lags that differ by country. The United States enters through the spread between TTF and Henry Hub.
2. Where Europe stands on 24 October 2026
2.1 Storage: lowest for the season in the recent record
On gas day 22 October, EU storage held 845 TWh, 74.6 percent of capacity, against 82.8 percent a year earlier, a five-year average of 89.4 percent and a five-year minimum of 77.3 percent (AGSI+). Engie called the 13 October level the lowest for that time of year in the 2017 to 2025 range. Net injections slowed from about 1.3 TWh a day early in October to under 1 TWh a day after mid-month.
The national picture is uneven (Figure 2, panel c). Italy (89.8 percent) and France (87.1 percent) are close to their usual levels; the Netherlands (65.0), Austria (68.5) and Germany (61.2) are not. Germany matters most: its storage is the largest in the EU, 247.5 TWh, and it supplies Austria, the Czech Republic and Switzerland. In early September the storage operators’ association INES reported about 53 percent, against 71 percent a year earlier, the lowest early-September level in fifteen years. German rules require 80 percent in cavern storage and 45 percent in most porous storage on 1 November, about 70 percent overall. Germany will miss that level.
The United Kingdom has little storage by design: about 3.2 bcm when Rough, the largest site, is full, or 13 days of average winter demand. Centrica has described Rough as practically empty after it was not refilled over the summer. National Gas data show 13.1 TWh in storage on 23 October, about nine days at recent demand. Britain relies on flows from Norway, LNG terminals, the North Sea and continental interconnectors.
Table 1. Gas storage at the start of the winter, 22 to 23 October 2026. Sources: AGSI+ via Voltstack and Engie; National Gas via Voltstack; BNetzA; ENTSOG; author’s balance model for the end-March columns (equal-depletion rule, Section 4.4). Days of demand use average October to March demand.
| Country | Fill | Gas in store (TWh) | Capacity (TWh) | Reference level | Days of winter demand | End-March 2027, median | End-March 2027, cold squeeze |
|---|---|---|---|---|---|---|---|
| EU | 74.6% | 845 | 1,132 | 90%, or 80% to 75% with flexibility, between 1 Oct and 1 Dec | 63 | 22% | 14% |
| Germany | 61.2% | 151 | 248 | 70% on 1 Nov (cavern 80%, porous 45%) | 53 | 18% | 11% |
| France | 87.1% | 108 | 124 | EU rule | 91 | 26% | 16% |
| Italy | 89.8% | 183 | 203 | EU rule | n.a. | 26% | 16% |
| Netherlands | 65.0% | 94 | 144 | 64% national level | n.a. | 19% | 12% |
| United Kingdom | about 37% of site capacity | 13.1 | 35.4 | none | 6 (9 at current demand) | n.a. | n.a. |
2.2 Supply: LNG down, Norway steady, Gulf cargoes missing
From January to September 2026, LNG provided 42.2 percent of European gas supply, North Sea pipelines (mainly Norway) 38.7 percent, North Africa 9.6 percent, eastern routes including Russian pipeline gas 6.0 percent and Azerbaijan 3.5 percent, according to ENTSOG data reported by TASS (Figure 2, panel d). LNG flows into European grids reached about 101 bcm over the nine months, 3 percent less than a year earlier, and 10.6 bcm in September.
The weak point is the third quarter. OIES reports European LNG send-out of about 27.9 bcm between July and September, 4.2 bcm less than a year earlier. The cause is global: world LNG imports were 127.7 bcm against 135 bcm a year earlier, as Qatari supply fell by 20.8 bcm and other suppliers added 13.5 bcm. Gulf LNG exports are just above 2 bcm a month, against more than 10 bcm before the crisis. QatarEnergy has extended its force majeure month by month, and Italy’s Edison was told that deliveries would stay suspended until early December. Qatari tankers resumed transits of Hormuz on 28 September, but flows remain far below pre-war levels, and two of the fourteen Qatari trains, about 12.8 Mt a year or 17 percent of capacity, are expected to stay out for three to five years.
North American LNG exports reached 47.3 bcm in the third quarter, 22 percent more than a year earlier. The US Energy Information Administration (EIA) expects US exports of 17.6 billion cubic feet a day (Bcf/d) in 2026, against 14.9 in 2025, and IEEFA expects the United States to supply about two-thirds of Europe’s LNG this year. But Europe competes with Asia for these cargoes. In early October European prices lost their premium over Asian spot LNG and European imports stopped rising; Asian spot prices were 29.30 dollars per MMBtu in the week to 16 October and above 30 dollars on 22 October.
Norway has been steady but not immune: 29.3 bcm in the third quarter, slightly above a year earlier, but unplanned outages kept flows at 302 million cubic metres a day (mcm/d) on 30 September, and reduced processing at Karsto cut supply again in mid-October.
2.3 Demand: industry adjusts, power burns more
OIES estimates that gas demand in the EU and the United Kingdom fell 1.7 percent year on year in the third quarter and 5 percent in September. Gas burned for power rose almost 9 percent after a hot summer with low hydro and nuclear output; industrial demand fell almost 5 percent, and 9 percent in September, as prices rose. The International Energy Agency (IEA) expects European gas demand to fall by more than 2 percent in 2026 and European LNG imports by about 4 percent.
In a letter reported on 27 September, Energy Commissioner Dan Jorgensen called storage levels exceptionally low and invited governments to consider voluntary measures to sustain injections or reduce gas and electricity demand.
2.4 Prices: three times the pre-war level in Europe, flat in America
The TTF front-month contract closed at 31.51 euros per MWh on 27 February, the day before the war. It traded between 40 and 50 euros in the second quarter, peaked near 83.5 euros in mid-September, eased to 72.5 euros on 30 September and climbed again to 91.07 euros for the November contract on 22 October, the highest since December 2022. The British NBP price followed at about 213 pence per therm on 16 October, which is 86.7 euros per MWh at current exchange rates, in line with TTF.
In dollar terms, the World Bank’s European gas price averaged 11.96 dollars per MMBtu in 2025, 21.11 in August 2026 and 25.42 in September, and about 29 dollars in October to date (Figure 2, panel b). Henry Hub averaged 2.95 dollars in September, and the November contract settled at 3.116 dollars on 16 October. The two markets are linked by trade but separated by price, a point Section 8 returns to.
The forward curve is steeply backwardated. On 30 September the winter 2026 to 2027 contract traded at 72.35 euros and summer 2027 at 53.41 euros; a year earlier the corresponding winter contract had traded at 31.72 euros. OIES reports a second-quarter 2028 price of about 12 dollars per MMBtu, about 37 euros per MWh: the market expects scarcity to last through 2027 and fade by 2028.
A first look at the results
The full note goes much further, with original models, scenarios and a dashboard of leading indicators. Two of its 14 charts and diagrams are shown below.
Continue reading
Get the full note: 26 pages, 14 charts and diagrams, 10 tables
This page shows the first part of the note. The full PDF adds: the rules: storage targets and the Russian ban; a winter balance model; from storage to prices: a scarcity curve; scenarios to September 2027; who pays: households and industry; the transatlantic link; the second winter: refilling in 2027; a dashboard of leading indicators; implications for policy and for investors.
29 USD, instant PDF download, secure card payment.
Buy the full noteNeed this analysis for your organisation?
We prepare confidential briefings, executive talks and studies on countries, markets and policies, built on the same method as this article.
Request a briefingSupport independent analysis
Our studies are free to read and carry no advertising. If this one was useful, a small contribution helps us publish the next.
Support our workGo further: books by Global Strategy Files

Frequently asked questions
How low will European gas storage be at the end of winter 2026 to 2027?
A Monte Carlo balance model calibrated to ENTSOG’s Winter Supply Outlook puts EU storage at a median of 22 percent on 31 March 2027, from 75 percent on 1 November. The probability of ending below 30 percent is 78 percent, below 20 percent 38 percent, and the chance of reaching the technical floor of about 11 percent, where demand must be curtailed, is 4 percent.
Why is European gas storage so low in October 2026?
The loss of most Gulf LNG after the war that began on 28 February 2026 removed about 9 bcm a month from the world market, and European LNG send-out fell 4.2 bcm year on year in the third quarter. EU storage was 74.6 percent full on 22 October, against 82.8 percent a year earlier and a five-year average of 89.4 percent; Germany was at 61.2 percent.
What will TTF gas prices be in winter 2026 to 2027?
The author’s model links TTF to expected end-March storage: each point of shortfall adds about 6.3 percent. The median first-quarter 2027 price is 88 euros per MWh, with a 40 percent chance of an average above 100 euros and 10 percent above 150 euros. Summer 2027 settles near 57 euros because the refill keeps demand for gas high.
Why does the US Henry Hub gas price not rise with European prices?
US LNG exports are limited by liquefaction capacity, which is running close to full, so a higher European price changes where cargoes go but cannot pull more gas out of the United States. Henry Hub stayed near 3.1 dollars per MMBtu in October 2026 while TTF was worth about 29.9 dollars, 9.6 times as much. The spread is a scarcity rent earned by holders of US cargoes.
Sources
- ENTSOG, Winter Supply Outlook 2026/27 including Summer 2027 Overview (SO0072-26) and press release PR0376-26 (8 October 2026); Summer Supply Outlook 2026 with Winter 2026/27 Overview (SO0069-26, April 2026).
- Gas Infrastructure Europe, AGSI+ transparency platform, as reported by Voltstack, “EU Gas Storage Tracker: Winter 2026/27 Readiness” (updated 24 October 2026) and “UK Gas Storage Today in Days of Gas” (gas day 23 October 2026); Engie EnergyScan, “Europe gas storage levels: weekly fullness rate tracker” (15 October 2026).
- Oxford Institute for Energy Studies, Quarterly Gas Review, Issue 34 (October 2026); J. Sharples and R. Hill, “European Storage Refill in Summer 2026” (27 July 2026).
- International Energy Agency, Gas Market Report, Q3-2026.
- U.S. Energy Information Administration, Short-Term Energy Outlook, October 2026 (6 October 2026), natural gas section; Today in Energy, “The 9th U.S. liquefied natural gas export terminal, Golden Pass, ships first cargo” (23 April 2026) and “U.S. LNG exports rose 23% in the first half of 2026 because of higher capacity” (1 September 2026).
- Council of the European Union, “Gas storage: Council greenlights 2-year extension of reserves filling rules” (18 July 2025); Argus, “EU settles on flexible gas storage target of 90pc” (25 June 2025) and “Germany approves decree to lower gas storage target” (30 April 2025).
- Regulation (EU) 2026/261 on phasing out Russian natural gas imports, as summarised by Jones Day, “EU moves to end Russian natural gas imports” (February 2026) and Energy Industry Review, “New rules to eliminate Russian gas from Europe by 2027”.
- Euronews, “EU tells countries to curb energy demand as gas prices face winter squeeze” (27 September 2026) and “Euronews explains: Does the EU have enough gas for winter?” (28 September 2026).
- Bundesnetzagentur, Rueckblick: Gasversorgung im Jahr 2025. AFP via Connaissance des Energies, German storage operators’ warning (8 September 2026).
- Urgewald, “EU imports record 12.18 million tonnes of Russian Arctic LNG in first nine months of 2026” (9 October 2026). IEEFA, “Europe to source two-thirds of its LNG imports from US in 2026” (13 May 2026).
- TASS, “Europe’s LNG imports hit four-month high in September” and “European gas futures top 1,050 dollars” (22 October 2026). Cyprus Shipping News citing S&P Global, US LNG destinations in September (9 October 2026). Egypt Oil and Gas citing Kpler and LSEG, Qatari transits of Hormuz (6 October 2026). The National, “Qatar extends LNG force majeure” (28 September 2026). Kalkine, TTF price and Qatar capacity (19 October 2026).
- Argus (8 April 2026); Grant Thornton Greece, “Greece’s gas market at an inflection point” (forwards of 30 September 2026 citing ENTSOG); Yahoo Finance (16 October 2026); Fxstreet citing Rabobank (14 October 2026); NAGA, “Natural gas price forecast October 2026”.
- World Bank, Commodity Price Data (Pink Sheet), as reported by APA (9 October 2026) and FIPI Policy and Economic Reports (2026).
- ECB euro reference rates via Pound Sterling Live (October 2026); Bank of Finland, average annual exchange rates 2025.
- ECMWF seasonal forecast as reported by Severe Weather Europe, “Winter 2026/2027 forecast: October update” (7 October, updated 22 October 2026). Met Office, “An unprecedented El Nino and its implications for the weather forecast” (21 August 2026).
- National Gas, Gas Winter Outlook 2026/27, as reported by Pipeline Journal (23 October 2026). Spherical Insights and Share Talk on UK storage and Rough (October 2026).
- Ofgem, “Energy price cap will rise by 4% from October 2026” (26 August 2026). Cornwall Insight, “16% price cap rise forecast in January” (30 September 2026). Uswitch, January 2027 price cap predictions (21 October 2026).
- CRE via AFP and Connaissance des Energies, “Le prix de reference du gaz augmentera de 6,6% au 1er novembre” (12 October 2026). NaTran (formerly GRTgaz), Bilan gaz 2025 (28 January 2026).
- Verivox, “Iran-Krieg: Gaspreise fuer Neukunden steigen um 21 Prozent” (17 March 2026); ad-hoc-news citing Verivox on 2027 gas prices (24 October 2026).
- UK Department for Energy Security and Net Zero, Energy Consumption in the UK 2026 and DUKES 2026.
- Shell, final investment decision on LNG Canada Phase 2 (September 2026); Discovery Alert, Canadian LNG exports (October 2026); Canada Energy Regulator, Canada-U.S. energy trade 2025.
- Cambridge Currencies, Bank of England MPC dates; Admiral Markets, ECB meeting dates.
- Data series: FRED DCOILBRENTEU; IMF World Economic Outlook October 2026 (NGDPD); Eurostat prc_hicp_minr (HICP energy, France and Germany). Retrieved 20 to 24 October 2026.
Books from Global Strategy Files
Go further on this topic
The Tariff GambleHow America’s trade war is reshaping power, prices and prosperity.24.99 USD, see the book Future-Proofing AmericaEconomic challenges and the road to reform.20 USD, see the book
 Kill KennedyWhat the 2025 declassified files reveal about the machinery of American power.20 USD, see the book
