
The Mortgage Reset Clock: When the 2026 Rate Shock Reaches Households in Five Economies

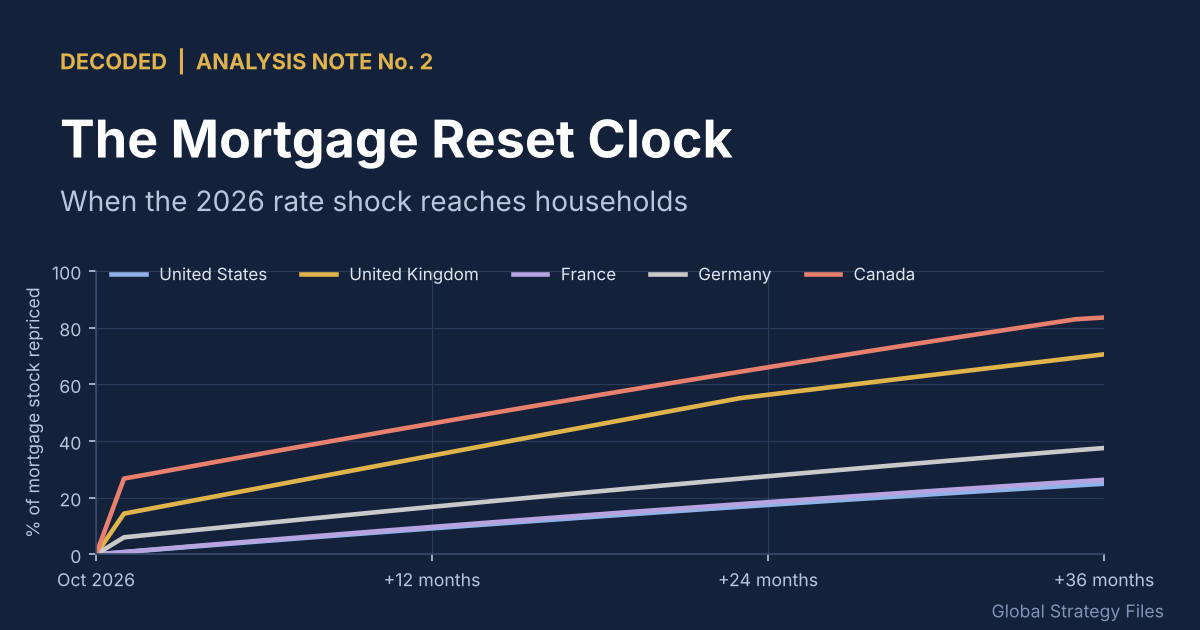
The Mortgage Reset Clock: When the 2026 Rate Shock Reaches Households in Five Economies
Driss EFFINA, PhD Independent Researcher, Global Strategy Files Decoded, analysis note No. 2, 20 October 2026. Reading time: about 55 minutes
Key takeaways
- By October 2026, households had absorbed only 10 to 13 percent of the extra mortgage interest the 2026 rate shock will generate by end-2029 in the US, UK, France and Canada (24 percent in Germany): most of the pain arrives in 2027 and 2028.
- Canada is the most exposed: mortgage debt of about 131 percent of disposable income, and a shock that adds 0.43 percent of income to mortgage interest by 2028, turning expected relief into tightening.
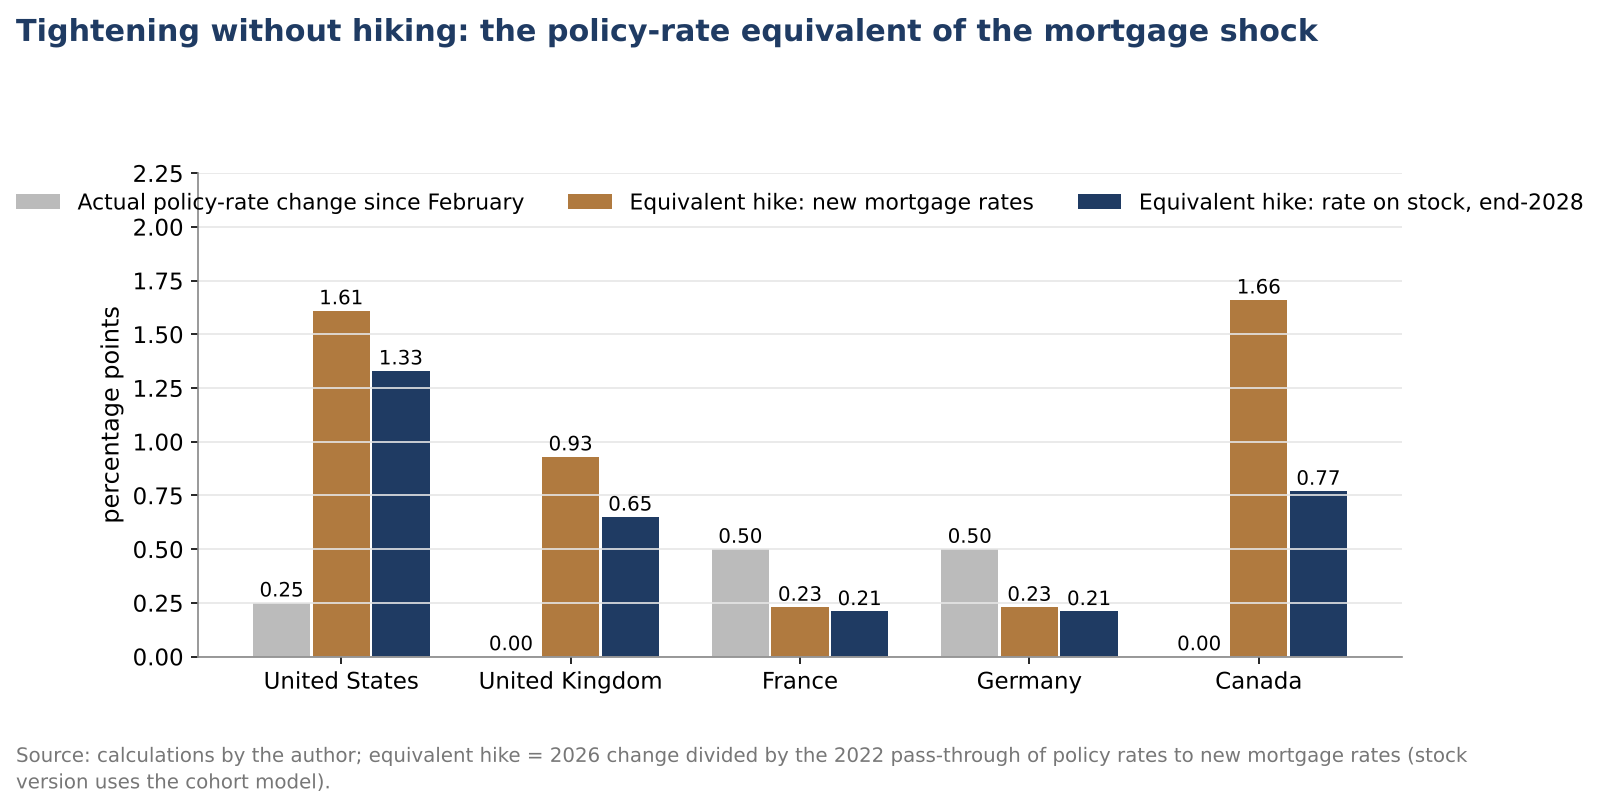
- The Bank of England and the Bank of Canada are tightening through mortgage markets without moving: the equivalent of 0.65 and 0.77 point of policy hikes on the mortgage stock by end-2028, while the ECB’s 50 bp reached mortgages as only about 0.2 point.
- UK borrowers whose fixed rate ends in the next 12 months face payments about 18 percent higher (about 151 pounds a month), peaking in early 2027; in the US the shock lands on mobility, cutting the propensity to sell by a further 17 percent.
Abstract
The oil shock that followed the outbreak of war involving Iran at the end of February 2026 has pushed new mortgage rates sharply higher. The US 30-year fixed rate averaged 7.36 percent in October, against 6.05 percent in February. The quoted UK 2-year fixed rate rose from 3.97 to 5.13 percent while Bank Rate stayed at 3.75 percent, and a Canadian 5-year fixed rate proxy rose from 4.32 to 5.08 percent with the Bank of Canada on hold. Yet households pay the rate in their contract, and meet the new rate only when the contract resets, when they move or when they refinance. This note builds an original “mortgage reset clock” for the United States, the United Kingdom, Canada, France and Germany: a monthly cohort model of each mortgage stock, calibrated on official contract structures and validated against the effective rates that households actually pay. It estimates the share of each stock that reprices in the next 12, 24 and 36 months, the rise in mortgage interest by 2027 and 2028, the payment shock for renewing borrowers and the timing of peak pain, and it separates the 2026 shock from the legacy resets of cheap pre-2022 loans. Most of the cost is still to come, Canadian households are the most exposed, two central banks are tightening without moving, the United Kingdom pays first, and in the United States the shock lands on mobility rather than on payments.
Keywords: mortgages, interest rate pass-through, fixed-rate mortgages, mortgage renewals, lock-in effect, household debt service, house prices, monetary transmission, oil shock
JEL codes: E43, E52, G21, G51, R21, R31
Key findings
1. The pain is mostly ahead. By October 2026, households had absorbed only 10 to 13 percent of the extra mortgage interest that the 2026 shock will generate by the end of 2029 in the United States, the United Kingdom, France and Canada, and 24 percent in Germany. In the United Kingdom, the shock’s contribution to the average rate on the mortgage stock rises from 0.07 point today to 0.52 point by December 2028.
2. Canadian households are the most exposed. Mortgage debt equals about 131 percent of disposable income in Canada, against 89 percent in the United Kingdom and 54 to 65 percent elsewhere, and mortgage interest already absorbs about 5.7 percent of income. The shock adds 0.43 percent of disposable income by 2028, about 7.7 billion Canadian dollars a year, the largest effect of the five; without it, Canadian mortgage interest would have fallen. In a second shock, the increase reaches 0.95 percent of income.
3. Two central banks are tightening without moving. At the pass-through observed in 2022, the rise in new mortgage rates since February equals a policy-rate increase of 0.93 point in the United Kingdom and 1.66 points in Canada, and on the mortgage stock by end-2028, 0.65 and 0.77 point. In the euro area, the ECB’s 50 basis points of hikes have reached French and German mortgages as the equivalent of only about 0.2 point.
4. The United Kingdom pays first. Over the next 12 months, the average borrower whose fixed rate ends faces a payment increase of about 18 percent, roughly 151 pounds a month, against 7 percent without the shock; those leaving 5-year fixes taken in late 2021 and 2022 face about 23 percent. The peak comes in the first quarter of 2027, and mortgage interest rises by 0.56 percent of disposable income by 2028, about 10.7 billion pounds a year.
5. In the United States, the shock hits mobility, not payments. The estimated average rate on outstanding mortgages is 4.48 percent, 2.88 points below the market rate. Using a published lock-in elasticity, the probability that a typical mortgaged owner sells has fallen by a further 17 percent since February, and a household that moves faces a 36 percent higher payment on the same loan. Aggregate mortgage interest rises by only 0.28 percent of disposable income by 2028, but it keeps rising for years.
1. Introduction
Every rise in interest rates is a story about timing. Bond markets reprice in seconds, but the price that matters most for households, the rate on their mortgage, moves at the speed of contracts. A British family on a 5-year fix taken in the autumn of 2021 still pays the rate of 2021. A Canadian family that renewed in 2023 still pays the peak rates of that year. A German family that fixed its rate for fifteen years in 2016 will not see 2026 rates until 2031. An American family with a 30-year loan at 3 percent will never see them, unless it moves.
The 2026 shock arrived in this world of staggered contracts. Hostilities with Iran began around the end of February and disrupted the Strait of Hormuz. Brent averaged about 103 dollars a barrel in March and 117 in April, fell back to about 84 to 85 dollars in June and July, and rose again to about 114 in September and 127 in October. Government bond yields rose sharply, mainly through real yields and the term premium, as documented in Decoded No. 1. Mortgage rates followed bond yields rather than policy rates.
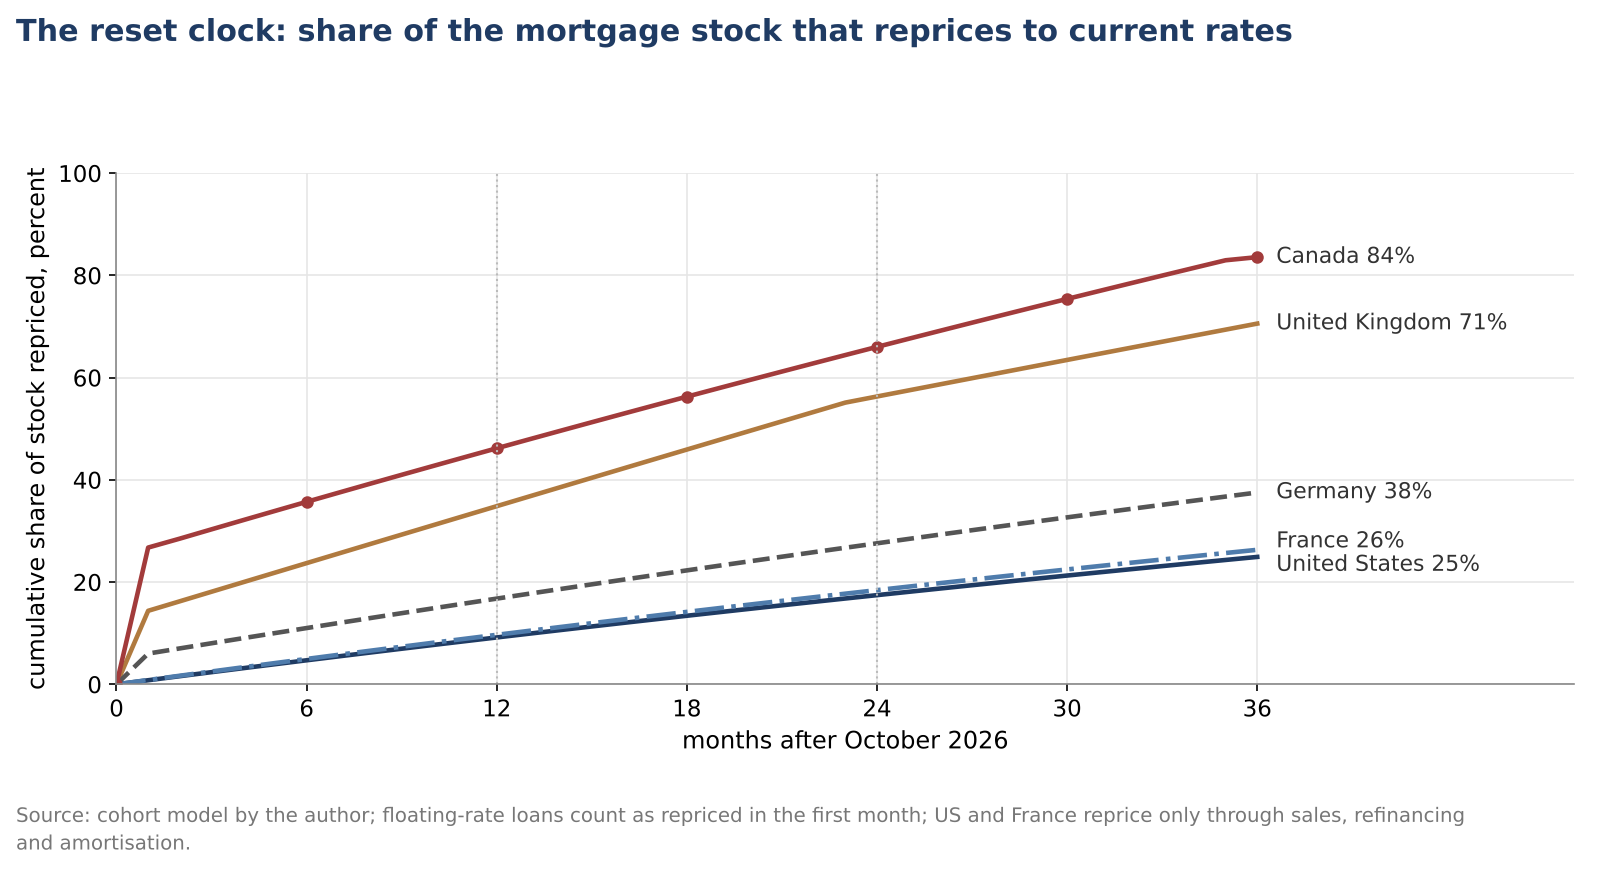
These rate moves do not tell us what households will pay, or when. The rate on new loans applies at first to a thin slice of borrowers; what matters is the reset calendar, which share of the stock reprices each month, from which old rate to which new one. That calendar differs radically across countries. The United States and France lend at rates fixed for the full term. The United Kingdom and Canada fix for two to five years, then reset. Germany fixes for ten years or more. Canada and the United Kingdom also have large stocks of floating-rate loans.
This note builds a reset clock for each country and asks four questions. How much of the stock reprices in the next one, two and three years? How much more will households pay in mortgage interest by 2027 and 2028? What does a typical borrower face at renewal? And when does the pain peak? It then compares the transmission of the shock with that of policy rates, measures the US lock-in effect, looks at house prices, sets out scenarios and proposes a dashboard of leading indicators.
The central tool is a cohort model of the mortgage stock (Box 1), which tracks every monthly cohort of loans since 2015 as it resets, is repaid or is refinanced. Its parameters come from official sources or are estimated by matching the effective rates on outstanding mortgages published by the Bank of England and the ECB, and the distribution of US mortgage rates in the FHFA National Mortgage Database. The model is then run forward under three rate scenarios and a counterfactual in which rates had stayed at February 2026 levels. The difference is the part of household pain caused by the 2026 shock; the rest is the legacy of the cheap loans of 2020 and 2021.
2. The shock in mortgage markets
2.1 New mortgage rates followed bonds, not central banks
Figure 1 shows new mortgage rates and policy rates since 2019. The two lines that moved together in 2022 and 2023 have separated in 2026.
In the United States, the 30-year fixed rate rose from 6.05 percent in February to 7.36 percent in October, 131 basis points, while the Federal Reserve raised its target range once, by 25 basis points, on 16 September. The October rate is 26 basis points below the cycle high of 7.62 percent of October 2023.
In the United Kingdom, the quoted 2-year fixed rate at 75 percent loan-to-value rose from 3.97 percent in February to 5.14 percent in April, eased to about 4.8 percent in June and July, and reached 5.13 percent in September. The 5-year rate rose from 4.00 to 4.98 percent. Bank Rate stayed at 3.75 percent, and the standard variable rate was 6.58 percent. The effective rate on newly drawn mortgages, which reflects the products actually taken, was 4.60 percent in August, against 4.00 percent on the stock, according to the Bank of England.
In Canada, the overnight rate target has been 2.25 percent since October 2025. The 5-year government bond yield, which anchors 5-year fixed pricing, rose from 2.82 to 3.58 percent between February and October. The posted 5-year rate barely moved, from 6.09 to 6.19 percent, but posted rates are list prices few borrowers pay. This note uses the 5-year yield plus 150 basis points, the renewal assumption of Bank of Canada staff, as a proxy for the rate actually offered: it rose from 4.32 to 5.08 percent.
In the euro area, the ECB raised its deposit facility rate in June and September 2026, from 2.00 to 2.50 percent, but new mortgage rates moved much less. The composite cost of borrowing for new house-purchase loans rose from 3.77 to 4.00 percent in Germany, from 3.10 to 3.20 percent in France and from 3.37 to 3.60 percent in the euro area between February and August.
2.2 The repricing gap
The pressure on households is best measured by the gap between the rate on new loans and the average rate on the stock. In August 2026, the French stock paid 1.99 percent and the German stock 2.40 percent, against 3.20 and 4.00 percent on new loans. In the United Kingdom, the September quoted 2-year rate was 1.13 points above the August effective rate on the stock, and the effective rate on new loans 0.60 point above it. In the United States, the estimated gap is 2.88 points, the largest of the five, but it applies to a stock that almost never resets. These gaps are a stock of future pain.
A first look at the results
The full note goes much further, with original models, scenarios and a dashboard of leading indicators. Two of its 14 charts and diagrams are shown below.
Continue reading
Get the full note: 25 pages, 14 charts and diagrams, 7 tables
This page shows the first part of the note. The full PDF adds: five mortgage contracts; method: a cohort model of the mortgage stock; the reset clock; what households will pay; tightening without hiking; the United States: lock-in instead of payment shock; house prices and rate sensitivity; scenarios to 2028 and beyond; a dashboard of leading indicators for household mortgage stress.
29 USD, instant PDF download, secure card payment.
Buy the full noteNeed this analysis for your organisation?
We prepare confidential briefings, executive talks and studies on countries, markets and policies, built on the same method as this article.
Request a briefingSupport independent analysis
Our studies are free to read and carry no advertising. If this one was useful, a small contribution helps us publish the next.
Support our workGo further: books by Global Strategy Files

Frequently asked questions
What is the mortgage reset clock?
The mortgage reset clock is a model that tracks, month by month, which share of a country’s mortgage stock moves to current market rates, because a fixed rate ends, a loan is repaid or a home is sold. It shows that households feel higher mortgage rates only when their own contract reprices, which takes months in Canada and the UK and many years in the US, France and Germany.
When will UK mortgage holders feel the 2026 rate rise most?
In the author’s central scenario, the payment shock for UK borrowers whose fixed rate ends peaks in the first quarter of 2027, at about 22 percent. Borrowers leaving 5-year fixes taken in late 2021 and 2022 face increases of about 23 percent. After 2027 the shock fades, because later fixes were taken at rates close to today’s.
Why are Canadian households the most exposed to the 2026 rate shock?
Canadian mortgage debt equals about 131 percent of household disposable income, far more than in the other four economies, and most Canadian mortgages renew every few years. The rise in 5-year bond yields since February 2026 adds about 0.43 percent of disposable income to mortgage interest by 2028, even though the Bank of Canada has not raised its policy rate.
How does the 2026 rate shock affect US homeowners with fixed mortgages?
Most US homeowners have 30-year fixed loans, so their payments do not change. The shock works through lock-in: the estimated average outstanding rate of 4.48 percent is almost 3 points below the 7.36 percent market rate, so moving would raise the payment on the same loan by about 36 percent, and the propensity to sell has fallen by a further 17 percent since February 2026.
Sources
- Bank of Canada, Valet data service: target for the overnight rate (V39079), posted 5-year conventional mortgage rate (V80691335), prime rate (V80691311), 5-year benchmark bond yield (BD.CDN.5YR.DQ.YLD) (retrieved 20 October 2026).
- Bank of Canada, Financial Stability Report 2026 (28 May 2026), Chart 8 on payment changes at renewal (Valet group FSR_2026_C8).
- Bank of Canada, 2026 schedule for policy interest rate announcements and major publications (August 2025).
- Godbout, C., Su, A. and Xu, Y. (2025), “How will mortgage payments change at renewal? An updated analysis”, Bank of Canada Staff Analytical Note 2025-21, July 2025.
- Bank of England, Bank of England Database: IUMABEDR, IUMBV34, IUMBV37, IUMBV42, IUMTLMV, CFMHSDE, CFMBJ78, CFMZ6K8 (retrieved 20 October 2026).
- Bank of England, Financial Stability Report, July 2026, as reported by Mortgage Solutions and Financial Reporter (7 July 2026).
- Bank of England, Financial Stability Report, November 2024, as reported by Financial Reporter and Morningstar UK (29 November 2024).
- Bank of England, Money and Credit, August 2026, as reported by AJ Bell (29 September 2026).
- Banque de France, “Taux d’endettement des agents non financiers, comparaisons internationales, 2025 T4” (May 2026).
- ACPR (Banque de France), “Le financement de l’habitat en 2025”, Analyses et synthèses n° 183, July 2026.
- BIS, real and nominal residential property prices (Q*R628BIS, Q*N628BIS) and credit to households (Q*HAM770A), via FRED (retrieved 20 October 2026).
- Batzer, R. M., Coste, J. R., Doerner, W. M. and Seiler, M. J. (2024), “The Lock-In Effect of Rising Mortgage Rates”, FHFA Working Paper 24-03, March 2024.
- BEA, Personal Income and Outlays, August 2026 (30 September 2026).
- CalculatedRisk, “FHFA’s Q4 National Mortgage Database” (1 April 2026) and “FHFA’s Q2 National Mortgage Database” (September 2025).
- Canadian Mortgage Trends, “Shift to variable, shorter-term mortgages raises borrowers’ rate exposure: CMHC” (9 September 2026).
- Central Bank Watch, central bank meeting calendar (retrieved 20 October 2026).
- Deutsche Bundesbank, MFI interest rate and banking statistics, as compiled by financer.de (2026) and Statista.
- ECB Data Portal, MFI interest rate statistics for house-purchase loans (new, floating and outstanding), France, Germany and euro area; deposit facility rate (retrieved 20 October 2026).
- Federal Reserve Bank of St. Louis, FRED: MORTGAGE30US, FEDFUNDS, DCOILBRENTEU, UNRATE (retrieved 20 October 2026).
- HousingWire, “What the latest mortgage data tells us about home sales in 2026” (20 October 2025) and “ARMs remain a small share of mortgage loans” (27 August 2025).
- ICAEW, “Chart of the week: a 3tn economy” (April 2026).
- INSEE, “Les comptes de la Nation en 2025” (2026).
- International Monetary Fund, World Economic Outlook database, October 2026.
- La Française, “ECB: another hike with no commitment on what follows” (8 September 2026).
- New York Fed, Quarterly Report on Household Debt and Credit, Q2 2026, as reported by the ABA Banking Journal (11 August 2026).
- ONS, labour market statistics (MGSX) (retrieved 20 October 2026).
- Realtor.com analysis of FHFA data, as reported by National Mortgage Professional (21 January 2026).
- Statistics Canada, National balance sheet and financial flow accounts, first quarter 2026 (12 June 2026), and Labour Force Survey (v2062815).
- TD Economics, “Read the Fine Print: The Bank of Canada’s Mortgage Warning Is About Refinancing, Not Renewal” (22 June 2026).
- The Money Charity, Money Statistics, July 2026.
- TransUnion, Q2 2026 Credit Industry Insights Report, Canada (25 August 2026).
- UK Finance, mortgages data update (8 May 2025).
- vdp (Verband deutscher Pfandbriefbanken), “Strukturen der Wohneigentumsfinanzierung 2025”.
