
Oil Shock, Not Yet a Wage Shock: Testing for Second-Round Effects in Five Economies in 2026

Oil Shock, Not Yet a Wage Shock: Testing for Second-Round Effects in Five Economies in 2026
Driss EFFINA, PhD Independent Researcher, Global Strategy Files Decoded, analysis note No. 3, 20 October 2026. Reading time: about 55 minutes
Key takeaways
- The 2026 oil shock is narrow: since February the gap between headline and core inflation has widened by 0.7 to 1.8 points, against 2.5 to 6.8 points in 2022, and oil alone explains 88 to 100 percent of it in the US and UK.
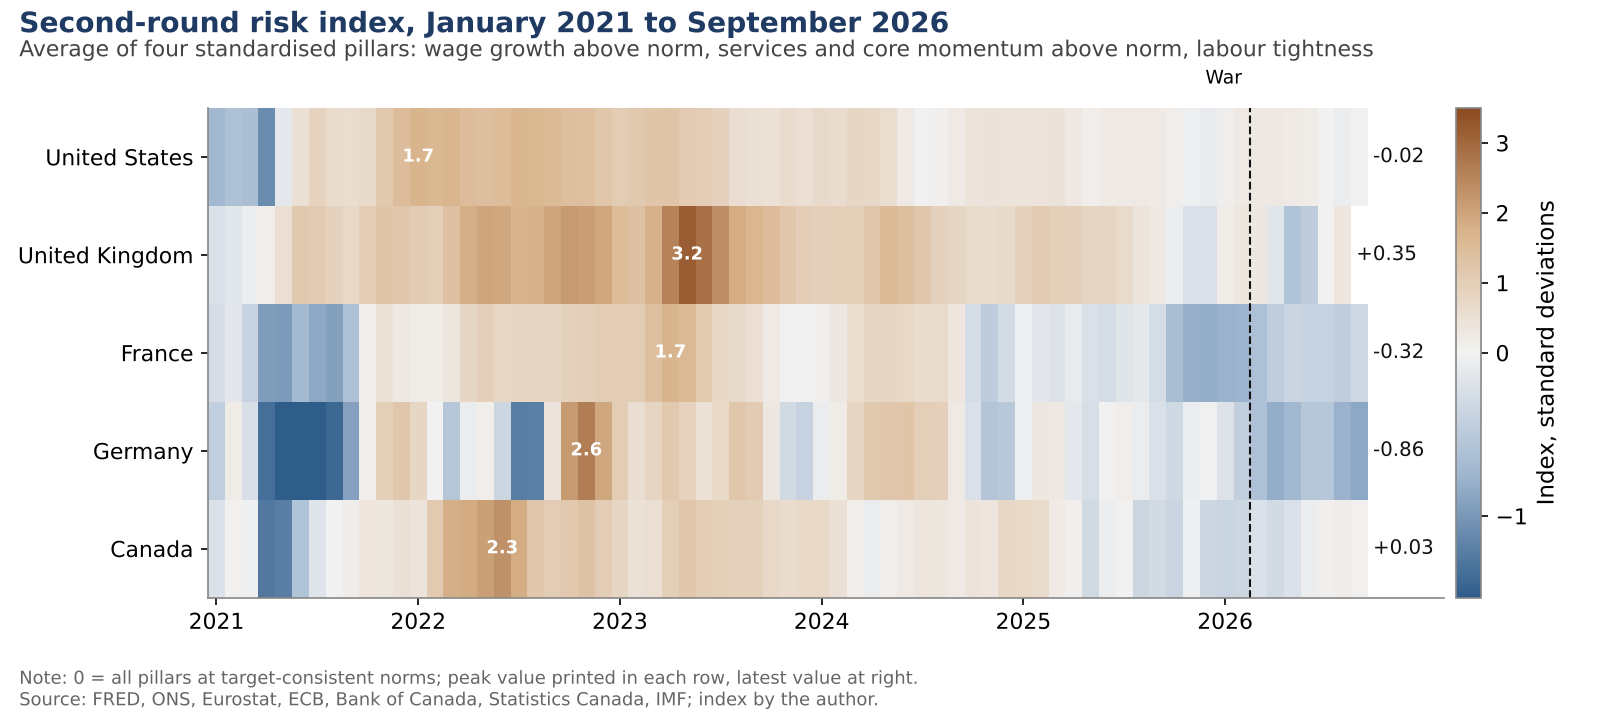
- Labour markets are slack: vacancies per unemployed person are 89 (US) and 70 (UK) on a 2019 base of 100, against 171 and 165 in 2022, and the author’s second-round risk index is between -0.87 and +0.35 everywhere.
- The risks lie elsewhere: UK pay follows past inflation (coefficient 0.51, 2.8 times the US), US household expectations rose 1.3 points to 4.7 percent, and German and French real wages remain 3.5 and 3.2 percent below end-2020.
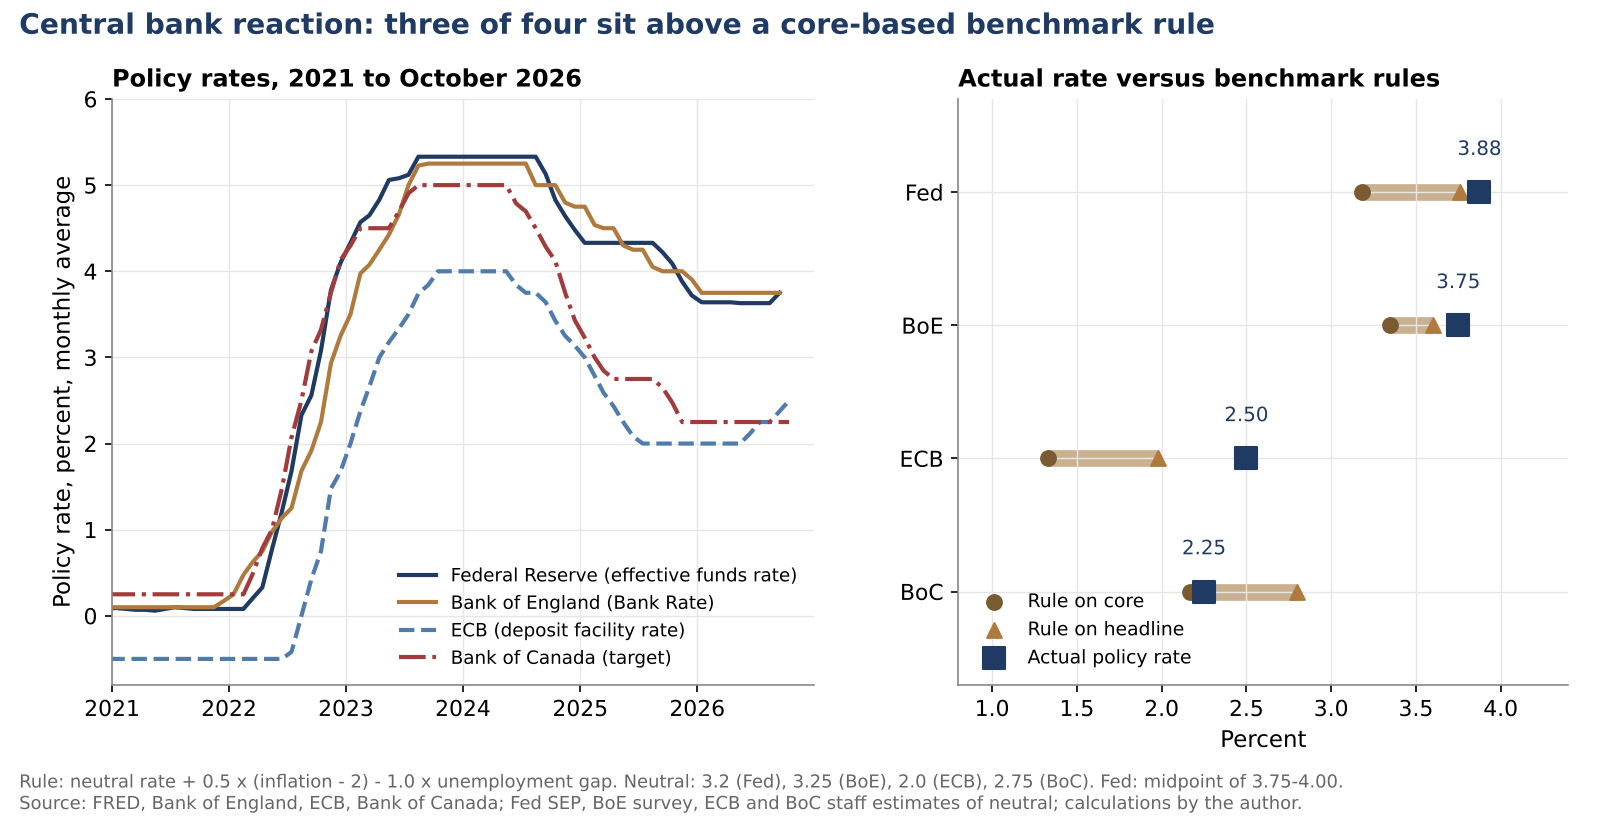
- The ECB, 1.17 points above a core-based rule, has tightened most where second-round risk is lowest; the Bank of Canada sits on its rule, and the Bank of England may be under-reacting to UK momentum near 4 percent.
Abstract
The war that began at the end of February 2026 doubled the price of oil. Brent averaged 62.5 dollars a barrel in December 2025 and 127.0 dollars in the first weeks of October 2026, and headline inflation has risen again in the United States (3.7 percent in September), the United Kingdom (3.1 percent in August), France (3.4 percent), Germany (3.3 percent) and Canada (3.1 percent). The question that matters for interest rates and wages in 2027 is whether this first-round shock is turning into a second-round one, in which wages, services prices and expectations chase energy prices, as in 2022. This note answers it with official data and five original tools: a distributed-lag model of oil pass-through compared across 2021 to 2022 and 2025 to 2026; wage curves and unemployment gaps; a method that recovers three-month inflation momentum from published annual rates; a second-round risk index; and a real wage cushion analysis. Central bank reactions and scenarios to December 2027 complete the analysis. The answer is “not yet, and not everywhere for the same reason”. The 2026 shock is a narrow oil shock hitting labour markets with spare capacity and positive real policy rates, the opposite of 2022 on both counts. But the risk is concentrated where headline inflation does not point: in British wage-setting, which follows past inflation more than labour tightness; in American household expectations; and among German and French workers who never recovered the purchasing power lost in 2021 to 2023.
Keywords: second-round effects, oil shock, wage-price spiral, core inflation, services inflation, wage growth, Beveridge curve, inflation expectations, monetary policy, United States, United Kingdom, France, Germany, Canada
JEL codes: E24, E31, E52, E58, J31, Q43
Key findings
1. A narrow shock. Since February 2026, the gap between headline and core inflation has widened by 0.7 to 1.8 percentage points, against 2.5 to 6.8 points in 2022. A pass-through model estimated on 2015 to 2019 explains 88 percent of the 2026 widening in the United States and all of it in the United Kingdom, but only 16 to 17 percent of the 2022 widening in Germany and the United Kingdom, where gas, electricity and food did most of the damage. 2. The labour gate is closed. Vacancies per unemployed person, indexed to 2019, stand at 89 in the United States and 70 in the United Kingdom, against 171 and 165 at the 2022 peaks. Unemployment is above the IMF’s medium-term rate in all five economies. The author’s second-round risk index ranges from -0.87 (Germany) to +0.35 (United Kingdom), against 1.7 to 3.2 at the 2022 to 2023 peaks. 3. Two routes to persistence: British pay and American expectations. UK wage growth responds to past inflation with a coefficient of 0.51, 2.8 times the American 0.19. If UK inflation reaches 4 percent in early 2027, the wage curve points to pay growth of 3.9 to 4.6 percent just as the April 2027 pay round is set. US household one-year expectations have risen by 1.3 points since February, to 4.7 percent, and the United States has the highest probability in the author’s model of core inflation above 3 percent at the end of 2027 (51 percent, against 43 percent in the United Kingdom and 26 to 28 percent elsewhere). 4. The euro area risk is a grievance, not a tight market. German and French real wages are still 3.5 and 3.2 percent below their level at the end of 2020; British real wages are 1.2 percent above it. This is why IG Metall is asking for 5 percent despite the weakest labour market in the sample, and why France’s minimum wage indexation has already been triggered once in 2026. 5. The ECB has tightened most where the risk is lowest. At 2.50 percent, the ECB deposit rate is 1.17 points above a benchmark rule on core inflation and 0.52 points above a rule on headline inflation. The Fed is 0.69 points above its core rule, the Bank of England 0.40 points; only the Bank of Canada sits on its rule (+0.08). Real policy rates against core inflation range from 0.0 to 1.31 percent, against -2.3 to -4.6 percent in September 2022.
1. Introduction
Every oil shock raises headline inflation. Only some leave inflation higher a year later. The difference is the second round: the moment when workers, firms and households stop treating the price rise as a one-off and build it into pay claims, price lists and expectations. In the 1970s the second round turned oil shocks into a decade of inflation. In 2021 and 2022 it partly did: headline inflation reached 7 to 12 percent in the five economies studied here, core inflation 4.7 to 7.1 percent and wage growth about 5 to 8 percent, before central banks raised policy rates by 4.5 to 5.25 percentage points.
The 2026 shock is different in origin and, so far, in scale. It is an oil shock, caused by the disruption of the Strait of Hormuz after the outbreak of war with Iran at the end of February, not a gas and food shock as in 2022. Brent rose from 70.9 dollars a barrel in February to 117.3 dollars in April, fell back to 83.8 dollars in July after a mid-June interim agreement between the United States and Iran, and climbed again to 114.2 dollars in September and 127.0 dollars in October, 103 percent above its December 2025 low.
Central banks have reacted in different ways. The Federal Reserve raised its target range by 25 basis points to 3.75 to 4.00 percent on 16 September, its first increase since 2023. The European Central Bank raised its deposit rate in June and September, to 2.50 percent. The Bank of England held Bank Rate at 3.75 percent on 17 September, with three of nine Monetary Policy Committee members voting for an increase. The Bank of Canada has held at 2.25 percent since late 2025. Either some of these central banks are wrong, or the shock is not the same shock in each economy.
This note tests the second explanation with three questions. How large and how broad is the first round compared with 2022? Are the conditions for a second round present: tight labour markets, wage growth above what is consistent with the inflation target, rising underlying momentum, drifting expectations? And are central banks reacting to these conditions, or to headline numbers? The answers rest on official data from FRED (US Bureau of Labor Statistics, Federal Reserve), the UK Office for National Statistics, Eurostat and the ECB, the Bank of Canada, Statistics Canada and the IMF, retrieved on 20 October 2026. Recent decisions, surveys and wage settlements were checked against official releases and press reports.
The note builds five tools: a pass-through model that separates what oil explains from what it does not; wage curves for the United States and the United Kingdom; a method to recover seasonally adjusted three-month momentum from published twelve-month rates (Box 1); a second-round risk index; and a measure of the real wage cushion built in 2024 and 2025. Sections 2 to 8 apply them, Section 9 assesses central banks, Section 10 presents scenarios and Sections 11 to 14 turn the results into thresholds, implications and a watch list.
2. The same shock, a different economy
The most useful comparison is in event time. Russia invaded Ukraine on 24 February 2022; the war with Iran began at the end of February 2026. Both shocks reached energy markets in March and both have been followed by about seven months of data. Table 1 compares each economy in February and September of each year (August for the United Kingdom in 2026).
| Indicator | United States | United Kingdom | France | Germany | Canada |
|---|---|---|---|---|---|
| Headline, Feb 2022 to Sep 2022, % | 7.9 to 8.2 | 6.2 to 10.1 | 4.2 to 6.2 | 5.4 to 11.0 | 5.7 to 6.9 |
| Headline, Feb 2026 to latest, % | 2.4 to 3.7 | 3.0 to 3.1 | 1.1 to 3.4 | 2.0 to 3.3 | 1.8 to 3.1 |
| Core, Feb 2022 to Sep 2022, % | 6.5 to 6.6 | 5.2 to 6.5 | 2.6 to 3.7 | 3.0 to 4.7 | 4.8 to 6.0 |
| Core, Feb 2026 to latest, % | 2.5 to 2.6 | 3.2 to 2.6 | 1.3 to 1.8 | 2.5 to 2.5 | 2.3 to 2.2 |
| Wage growth, Sep 2022, % | 5.1 | 5.8 | 3.4 | 3.3 | 3.1 |
| Wage growth, latest 2026, % | 3.0 | 3.7 | 2.0 | 3.1 | 3.2 |
| Unemployment, Sep 2022, % | 3.5 | 3.8 | 7.1 | 3.1 | 5.1 |
| Unemployment, latest 2026, % | 4.2 | 4.7 | 8.2 | 4.0 | 6.5 |
Table 1. Eight months after the shock: 2022 and 2026 compared. Core: CPI excluding food and energy (United States), CPI excluding energy, food, alcohol and tobacco (United Kingdom), HICP excluding energy, food, alcohol and tobacco (France, Germany), average of CPI-trim and CPI-median (Canada). Wages: average hourly earnings (United States), AWE regular pay (United Kingdom), labour cost index wages, two-quarter average (France, Germany), SEPH weekly earnings (Canada). Sources: FRED, ONS, Eurostat, ECB, Bank of Canada, Statistics Canada; calculations by the author.
Three differences stand out, and they bear on the three ingredients a second round needs: a visible shock, an economy where firms and workers can pass costs on, and accommodating policy. The starting point: in February 2022, headline inflation was already 4.2 to 7.9 percent and core inflation 2.6 to 6.5 percent, because reopening after the pandemic had overheated goods markets; in February 2026, headline inflation was 1.1 to 3.0 percent and core inflation close to target except in the United Kingdom. The direction of core inflation: in 2022 it rose everywhere, by 0.1 to 1.7 points in seven months; in 2026 it has risen by 0.5 points in France, from a very low level, and 0.1 point in the United States, has not moved in Germany, and has fallen in the United Kingdom and Canada. The labour market: unemployment is higher today than in September 2022 in every country, by 0.7 to 1.4 points.
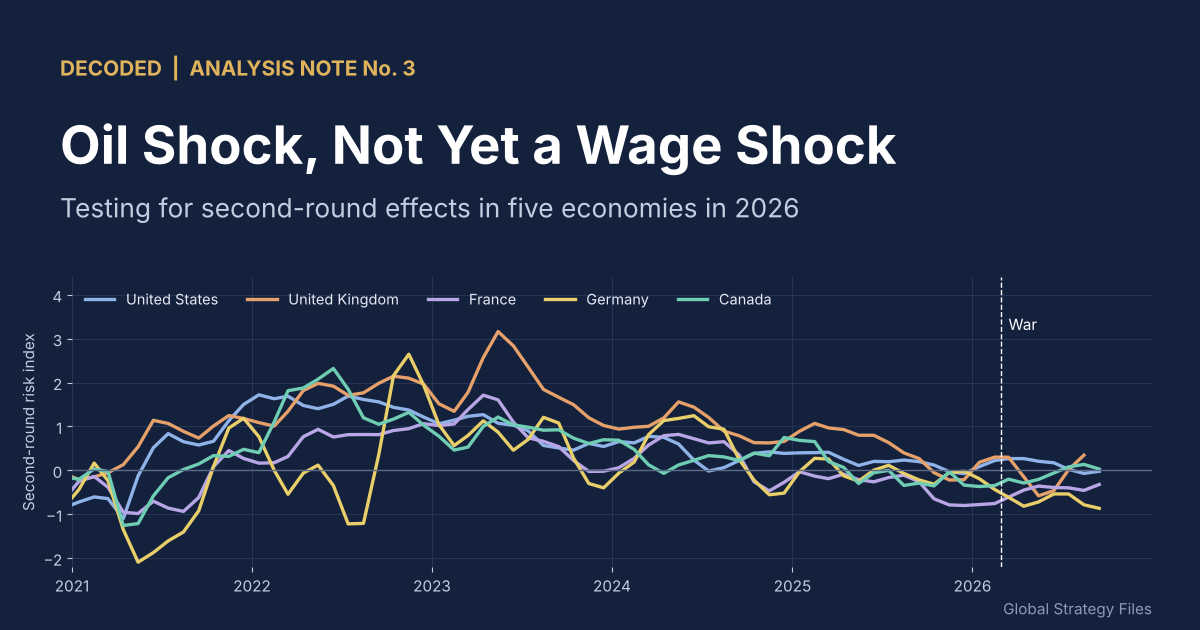
Figure 1 shows the whole period. In 2022, headline and core inflation climbed together, and services inflation in the United Kingdom and Germany kept rising long after energy prices had peaked: a textbook second round. In 2026, headline lines have jumped while core lines have stayed flat. Germany is the extreme case: headline inflation rose from 2.0 to 3.3 percent between February and September, while core inflation stayed at 2.5 percent and services inflation fell from 3.5 to 2.8 percent.
A first look at the results
The full note goes much further, with original models, scenarios and a dashboard of leading indicators. Two of its 14 charts and diagrams are shown below.
Continue reading
Get the full note: 25 pages, 14 charts and diagrams, 8 tables
This page shows the first part of the note. The full PDF adds: framework and data; the first round: how much oil, and how much else; labour markets: the gate that has closed; underlying momentum; a second-round risk index; the real wage cushion, and the grievance gap; central banks: over- or under-reacting?; scenarios to December 2027; what would turn the oil shock into a wage shock.
29 USD, instant PDF download, secure card payment.
Buy the full noteNeed this analysis for your organisation?
We prepare confidential briefings, executive talks and studies on countries, markets and policies, built on the same method as this article.
Request a briefingSupport independent analysis
Our studies are free to read and carry no advertising. If this one was useful, a small contribution helps us publish the next.
Support our workGo further: books by Global Strategy Files

Frequently asked questions
What are second-round effects of an oil shock?
Second-round effects occur when an initial rise in energy prices feeds into wages, the prices of other goods and services, and inflation expectations, so that inflation stays high after oil prices stabilise. The first round is the direct rise in fuel and heating prices. In 2022 strong second-round effects pushed core inflation to 4.7 to 7.1 percent in the US, UK, France, Germany and Canada.
Is the 2026 oil shock causing a wage-price spiral?
Not yet. Since February 2026, core inflation has barely moved or fallen in four of the five economies studied, wage growth is close to or below target-consistent norms except in the UK and Canada, and unemployment is above its medium-term level everywhere. A second-round risk index built by the author is between -0.87 and +0.35, against 1.7 to 3.2 at the 2022 to 2023 peaks.
Which economy is most at risk of persistent inflation after the 2026 oil shock?
In the author’s scenario model, the United States has the highest probability of core inflation above 3 percent at the end of 2027 (51 percent), because household expectations rose to 4.7 percent. The United Kingdom follows at 43 percent: its pay growth responds strongly to past inflation and its April 2027 pay round comes just after an expected inflation peak above 4 percent.
Is the ECB over-reacting to the 2026 energy shock?
On the evidence of second-round indicators, probably. The ECB raised its deposit rate to 2.50 percent in June and September 2026 while euro area core inflation stayed near 2.5 percent, German services momentum collapsed and unemployment rose in France and Germany. Its rate is 1.17 points above a benchmark rule based on core inflation, the largest gap among the four central banks studied.
Sources
- Atlanta Fed, Wage Growth Tracker, September 2026 update.
- Bank of Canada, Valet data service: V39079, STATIC_TOTALCPICHANGE, CPI_TRIM, CPI_MEDIAN, CPI_COMMON, V41690973, V41693242 (retrieved 20 October 2026).
- Bank of Canada, “Assessing the US and Canadian neutral rates: 2026 update”, Staff Analytical Paper 2026-21, May 2026.
- Bank of Canada, policy rate announcement of 2 September 2026 (as reported by CREA Cafe, Canadian Real Estate Association).
- Bank of England, Bankstats: Bank Rate, IUMABEDR (retrieved 20 October 2026).
- Bank of England, Monetary Policy Summary, September 2026 (as reported by Investment Week and Kael Tripton), and Decision Maker Panel, September 2026 (as reported by Global Banking and Finance Review).
- Bank of England, Market Participants Survey results, April 2026.
- Banque de France, ECB Consumer Expectations Survey results for February 2026 and August 2026.
- Brightmine, pay awards for the three months to July 2026 (as reported by Onrec).
- Citi/YouGov UK inflation expectations, February to July 2026 (as reported by BBC Bermuda and Crypto Briefing).
- Editions Tissot, “SMIC 2026: une hausse de 2,41 % au 1er juin”.
- Employment and Social Development Canada, Major wage settlements by COLA and year.
- European Central Bank, Data Portal: deposit facility rate, euro area negotiated wages, unemployment for France and Germany (retrieved 20 October 2026).
- European Central Bank, press release on the ECB wage tracker, 17 June 2026.
- European Central Bank, decision of 10 September 2026 and June 2026 staff projections (as reported by StockWireX); staff estimates of the neutral rate (as reported by MNI, February 2025).
- Eurostat, HICP (prc_hicp_minr) and labour cost index (lc_lci_r2_q) (retrieved 20 October 2026); euro area HICP for September 2026 (as reported by Trading Economics).
- Federal Reserve Bank of St. Louis, FRED: CPIAUCSL, CPILFESL, PCEPILFE, CES0500000003, ECIWAG, UNRATE, JTSJOL, MICH, T5YIE, FEDFUNDS, ECBDFR, DCOILBRENTEU (retrieved 20 October 2026).
- Federal Reserve Board, FOMC decision of 16 September 2026 (as reported by Central Banking) and Summary of Economic Projections, 16 September 2026.
- IG Metall, “Tarifrunde Metall und Elektro 2026”, and fundresearch.de, “Metall-Tarifrunde: IG Metall fordert fuenf Prozent mehr Geld”, September 2026.
- International Monetary Fund, World Economic Outlook database, October 2026.
- Office for National Statistics: D7G7, DKO8, D7NN, D7G8, KAI9, AP2Y, MGSX (retrieved 20 October 2026).
- Oeffentlicher Dienst News, “TVoeD Tarifverhandlungen 2027: die Termine stehen fest”.
- Retail Insider, “Bank of Canada reports weaker business, consumer sentiment as inflation expectations rise”, July 2026.
- Statistics Canada: Labour Force Survey (v2062815) and Survey of Employment, Payrolls and Hours (v79311153) (retrieved 20 October 2026).
- Trading Economics: US CPI for September 2026 (14 October 2026); University of Michigan consumer sentiment, October 2026 preliminary; Canada household inflation expectations.
- Association of Convenience Stores, “National Living Wage rise to 12.71 pounds, April 2026”.
- Meeting calendars: fedratecalc.com (FOMC 2026), Admiral Markets (ECB, October and December 2026), Cambridge Currencies (Bank of England, 2026 and 2027).
