
Five Bond Markets, One Shock: Who Really Pays for the 2026 Yield Surge

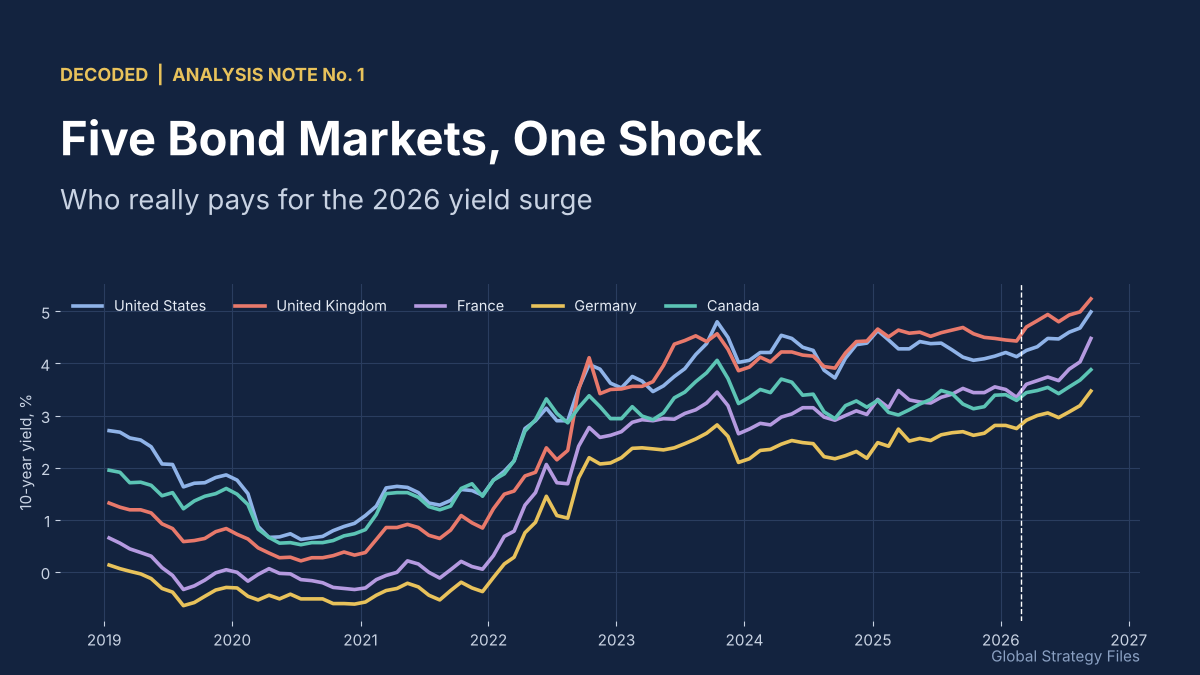
Five Bond Markets, One Shock: Who Really Pays for the 2026 Yield Surge
Driss EFFINA, PhD Independent Researcher, Global Strategy Files Decoded, analysis note No. 1, 19 October 2026. Reading time: about 50 minutes
Key takeaways
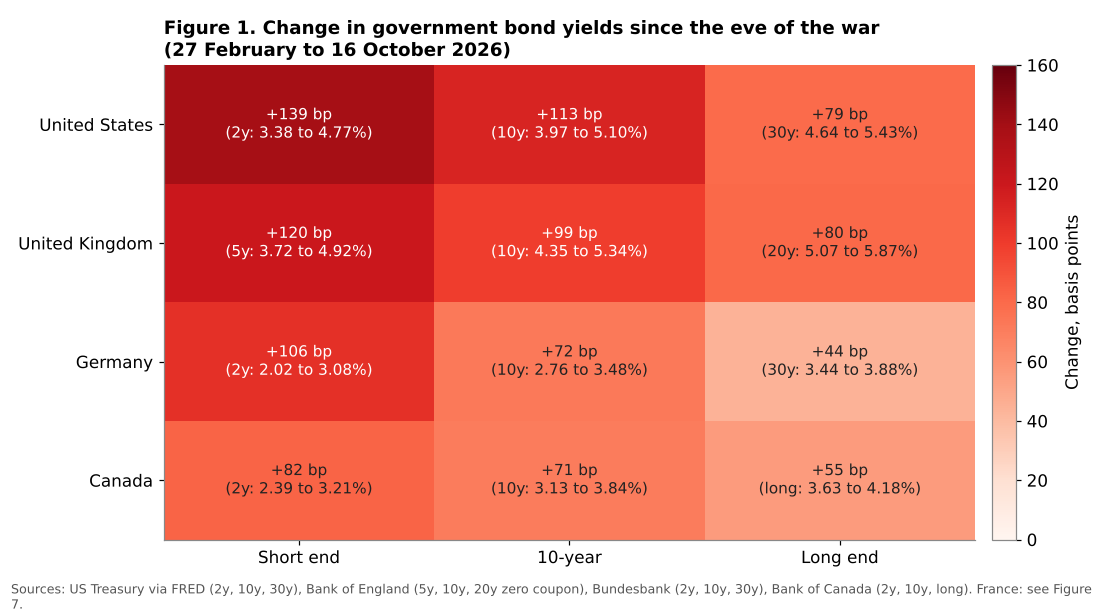
- Between 27 February and 16 October 2026, 10-year yields rose by 71 to 113 basis points in the US, UK, Germany and Canada, and short-term yields rose even more: the sell-off was a bear flattening, not a fiscal blow-out.
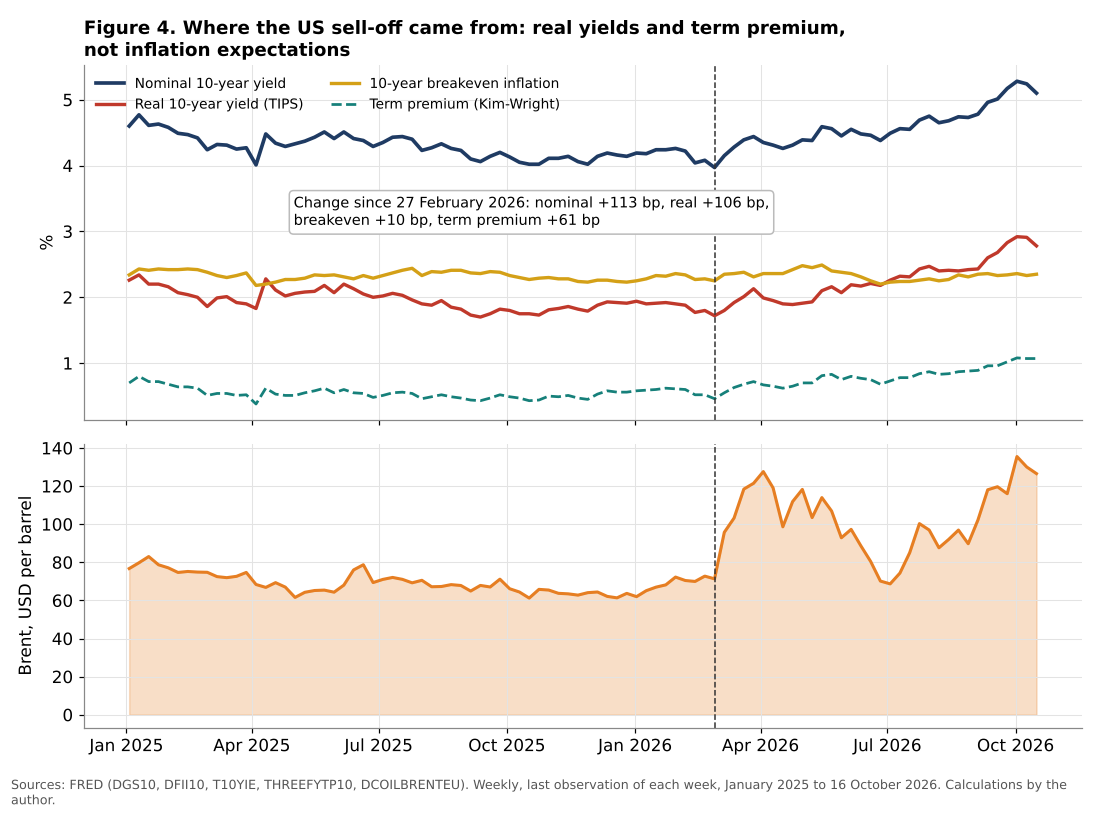
- In the United States, 94 percent of the rise in the 10-year yield came from real yields; breakeven inflation rose by only about 10 basis points, while the term premium rose by 61 basis points.
- If yields stay at October levels, the extra interest bill reaches 0.71 percent of GDP in year 1 in the US and 0.51 percent in the UK, and 1.55 and 1.25 percent of GDP after ten years in the US and France.
- The UK pays first (almost two-thirds of its ten-year cost in year 1, through inflation-linked gilts and QE reserves), the US pays most, and France pays longest.
Abstract
Between 27 February 2026, the last trading day before the war with Iran closed the Strait of Hormuz, and 16 October 2026, government bond yields rose by 70 to 140 basis points at the short and medium maturities across the United States, the United Kingdom, France, Germany and Canada. The US 10-year Treasury yield reached its highest level since 2002, the UK 30-year gilt briefly touched 6 percent, and France now pays more to borrow than Italy. Commentary has framed this as a fiscal revolt by bond markets, or as a classic inflation scare. This note tests both stories with daily and weekly data from the US Treasury, the Bank of England, the Bundesbank, the Bank of Canada and the OECD, and builds an original model of how fast each government’s interest bill absorbs the shock. Five findings emerge. First, the sell-off was a bear flattening, not a fiscal blow-out: in all four countries with full yield curves, two-year yields (five-year in the United Kingdom) rose more than ten-year yields, and ten-year yields more than thirty-year yields. Second, in the United States, 94 percent of the rise in the ten-year yield came from real yields; breakeven inflation rose by only about 10 basis points, while the estimated term premium rose by 61 basis points. The oil shock has been transmitted to bonds through the price of time, not through expected inflation. Third, the oil sensitivity of yields roughly tripled during the war, and it is highest in the United Kingdom, where a 1 percent rise in Brent has moved five-year gilt yields by 0.87 basis points on average. Fourth, bond markets first moved as one (the common factor explained up to 89 percent of weekly yield changes in June) and then split again in September and October, as country-specific fiscal risk returned. Fifth, the fiscal cost differs far more in timing than in size. If yields stay at October levels, the extra interest bill reaches 0.71 percent of GDP in the first year in the United States, 0.51 percent in the United Kingdom, 0.31 percent in France, 0.15 percent in Canada and 0.10 percent in Germany; after ten years, it rises to 1.55, 0.80, 1.25, 0.45 and 0.46 percent of GDP respectively. The United Kingdom pays first, the United States pays most, France pays longest, and Germany and Canada are protected by low central-government debt. A model calibrated on these structures gives results of the same order as the official sensitivities published by the UK Office for Budget Responsibility. The note ends with a dashboard of leading indicators and thresholds that would signal a second leg of the shock.
Keywords: government bonds, term premium, real yields, oil shock, public debt, interest costs, debt maturity, inflation-linked debt, fiscal sustainability, United States, United Kingdom, France, Germany, Canada
JEL codes: E43, E44, E62, H63, G12, Q43
1. Introduction
Every energy shock eventually becomes a question about public debt. In 1973 and 1979, oil shocks pushed inflation and interest rates up at a time when most governments owed little. In 2022, the energy crisis that followed the invasion of Ukraine raised interest rates at a time when governments owed a great deal, but most of that debt had been locked in at the lowest yields in recorded history. The 2026 shock is different from both. It arrives after four years of rising interest rates, after the long-dated debt issued at near-zero yields has started to mature, and at a moment when three of these five economies run deficits of 4 to 9 percent of GDP outside any recession.
The facts of the shock are well known. Hostilities with Iran began in early March 2026; the Strait of Hormuz was all but closed for several weeks; Brent crude rose from 71 dollars a barrel at the end of February to above 120 dollars by late March; a ceasefire in April and a slow reopening of the Strait in June brought prices back towards 70 dollars, before the bombing of the Saudi East-West pipeline on 11 September and renewed attacks in the Gulf sent them back above 120 dollars. Diesel benchmarks reached record highs above 200 dollars a barrel in September, according to the International Energy Agency.
The bond market reaction is also well known in its headlines. The US 10-year yield rose above 5 percent and touched 5.34 percent, its highest level since 2002, according to UK Finance. The UK 30-year gilt yield briefly reached 6 percent at the start of October, its highest level since 1998. The French 10-year yield rose to about 5 percent and its spread over German Bunds to 152 basis points, the widest since the euro crisis of 2011 and 2012, so that France now pays more than Italy and Greece to borrow, according to Euronews. The Federal Reserve raised its policy rate in September for the first time since 2023, and markets expect the Bank of England to follow in November.
What is not well known is what these movements mean, and who will pay for them. Two stories dominate commentary. The first is a fiscal story: investors are refusing to finance large deficits at old prices, and long-term yields are rising because governments borrow too much. The second is an inflation story: the oil shock will feed into wages and prices, central banks will have to tighten, and yields are rising to compensate for inflation. Both stories contain some truth, but they lead to different conclusions. If the fiscal story dominates, the cure is fiscal consolidation. If the inflation story dominates, the cure is monetary policy and patience.
This note does three things that the daily commentary does not. It decomposes the sell-off along the yield curve and, for the United States, into real yields, inflation expectations and the term premium, to identify which story the data support. It measures how the sensitivity of each bond market to oil has changed, and whether the five markets moved as one or separately. And it builds a model of the fiscal pass-through, which shows how fast and how much each government’s interest bill will rise if yields stay where they are, and through which channel. The model is calibrated on the actual structure of each country’s debt: the share of short-term bills, the average maturity, the share of inflation-linked bonds, and the holdings of central banks financed by reserves. It is then checked against the official sensitivities published by the UK Office for Budget Responsibility.
The answer to the question in the title is not the one most often given. The country that pays first is not the one with the highest deficit, and the country that pays most over ten years is not the one with the highest debt. Timing matters more than levels, and timing is decided by the plumbing of public debt: maturities, bills, inflation indexation and quantitative easing.
Section 2 sets out the context. Section 3 presents the data and the method. Section 4 presents the results on markets. Section 5 presents the results on public finances. Section 6 presents scenarios. Section 7 proposes a dashboard of leading indicators. Section 8 discusses the findings and their limits, and Section 9 concludes.
2. Context: a second energy shock in a high-rate world
2.1 The timeline of the shock
Table 1 summarises the main events that drove energy prices and bond yields in 2026. The pattern matters for the analysis: there were two distinct waves of the oil shock, one in March and April and one from mid-September, separated by a period of partial relief.
| Date | Event | Brent (USD per barrel) |
|---|---|---|
| 27 Feb 2026 | Last trading day before the war (baseline of this note) | 71 |
| Early March | Hostilities begin; Strait of Hormuz nearly closed | 81 to 96 |
| 20 to 27 March | Iraq declares force majeure; IEA collective action on stocks | 112 to 121 |
| 8 April | Ceasefire announced; largest one-day fall since 2020 | 95 |
| 30 April | United States extends its blockade of Iranian ports; futures above 126 | 126 (futures) |
| 24 June | Tankers transit the Strait again | 74 |
| 11 September | Bombing of the Saudi East-West pipeline | above 100 |
| 16 September | Federal Reserve raises its target range to 3.75 to 4.00 percent | about 120 |
| Late September | Diesel benchmarks above 200 dollars; US 10-year above 5 percent | 117 (Dated Brent average) |
| Early October | UK 30-year gilt at 6 percent; France 10-year at about 5 percent, 152 bp over Bunds | 107 (futures) to 135 (spot) |
Table 1. Timeline of the 2026 shock. Sources: chronology compiled from press reports and the IEA Oil Market Report of October 2026; Brent spot prices from FRED (weekly), futures prices as reported. Levels rounded.
2.2 The macroeconomic starting point
The five economies entered the shock in very different fiscal positions. According to the April 2026 World Economic Outlook of the International Monetary Fund, general government gross debt for 2026 was projected at 126.8 percent of GDP in the United States, 118.5 percent in France, 115.6 percent in Canada, 102.0 percent in the United Kingdom and 64.6 percent in Germany. The projected deficits for 2026 were 8.5 percent of GDP in the United States, 5.4 percent in France, 4.3 percent in Germany, 3.8 percent in the United Kingdom and 2.5 percent in Canada.
These headline numbers are misleading for the purpose of this note in two ways. First, gross general government debt includes items that are not traded in bond markets, such as the unfunded pension liabilities included in the Canadian figure, and debts of regional governments that are financed separately, such as the German Länder and the Canadian provinces. Second, what determines how fast higher market yields reach the budget is not the level of debt but its structure. A country with high debt but very long maturities can absorb a rise in yields slowly; a country with moderate debt but many short-term bills feels it immediately. The rest of this note therefore focuses on central-government marketable debt, which is the part of public debt that is refinanced in the bond market and whose cost moves with market yields.
On that measure, the United States, the United Kingdom and France are strikingly similar: each has central-government marketable debt equal to about 94 percent of GDP (30.7 trillion dollars of marketable Treasury debt, 2.82 trillion pounds of gilts including inflation uplift, and 2.88 trillion euros of negotiable state debt). Germany’s federal securities, excluding the government’s own holdings, represent about 42 percent of GDP, and Canada’s federal market debt about 50 percent. Similar levels, as we will see, produce very different costs.
2.3 Monetary policy before and after
Policy rates diverged before the war. The Federal Reserve had cut its target range to 3.50 to 3.75 percent by early 2026; the Bank of England had cut Bank Rate to 3.75 percent; the Bank of Canada had held its rate at 2.25 percent since October 2025; and three-month euro interbank rates were close to 2 percent. The war reversed the direction of travel. The Federal Reserve raised its target range to 3.75 to 4.00 percent on 16 September. Three-month euro rates rose to 2.64 percent by September, according to OECD data. The Bank of England has held Bank Rate at 3.75 percent, but markets expect a rise in November, and the Bank’s September forecast showed inflation above 4 percent in early 2027. The Bank of Canada has not moved, even though inflation stood at 3.0 percent in August and the Canadian dollar fell to about 70 US cents.
A first look at the results
The full note decomposes the sell-off in each market and measures, country by country, how fast and how much the interest bill will rise. Two of its thirteen charts are shown below.
Continue reading
Get the full note: 23 pages, 13 charts and diagrams, 8 tables
This page shows the first part of the note. The full PDF adds the anatomy of the sell-off in four bond markets, the decomposition of US yields into real rates, inflation expectations and term premium, the oil beta of bond yields, the return of national risk, a fiscal pass-through model validated against the UK Office for Budget Responsibility, the extra interest bill for each country year by year over ten years, the primary balance now required to stabilise debt, three scenarios to 2032 and a dashboard of leading indicators with alert thresholds.
29 USD, instant PDF download, secure card payment.
Buy the full noteNeed this analysis for your organisation?
We prepare confidential briefings, executive talks and studies on countries, markets and policies, built on the same method as this article.
Request a briefingSupport independent analysis
Our studies are free to read and carry no advertising. If this one was useful, a small contribution helps us publish the next.
Support our workGo further: books by Global Strategy Files

Frequently asked questions
Why did government bond yields rise so much in 2026?
Mainly because markets priced tighter monetary policy after the oil shock caused by the war with Iran. Short-term yields rose more than long-term yields in every country studied, and in the United States the rise came almost entirely from real yields and the term premium, not from inflation expectations.
Which country pays the most for the 2026 rise in bond yields?
The United States, because of its short debt maturity (about 71 months), its large share of bills and its deficit of 8.5 percent of GDP. If yields stay at October 2026 levels, its extra interest bill reaches 0.71 percent of GDP in the first year and 1.55 percent after ten years.
Why does the UK feel the cost of higher yields so quickly despite long gilt maturities?
Because about a quarter of gilts are inflation-linked and about 17 percent are held by the Bank of England and financed by reserves paid at Bank Rate. These two channels reprice immediately, so almost two-thirds of the UK’s ten-year cost arrives in the first year.
What does the higher yield level mean for France’s budget?
France’s cost starts small but grows for a decade as debt is refinanced: about 15 billion euros a year by year 3 and about 38 billion euros by year 10 if yields stay at current levels, compared with a 2027 budget package of about 54 billion euros.
Sources
- Bank of Canada, Valet data service: Government of Canada benchmark bond yields and policy rate (retrieved 19 October 2026).
- Bank of England, statistical interactive database: nominal zero-coupon yields at 5, 10 and 20 years and Bank Rate (retrieved 19 October 2026).
- BDC, Monthly Economic Letter, October 2026.
- Deutsche Bundesbank, time series database: estimated term structure of interest rates for listed federal securities; list of federal securities, July 2026.
- Deutsche Finanzagentur, investor presentation and issuance plan 2026.
- Eurostat, government revenue, expenditure and main aggregates (gov_10a_main), July 2026 release.
- Euronews, “France’s sovereign debt crisis explained: How dangerous could it be?”, 6 October 2026.
- Federal Reserve Bank of St. Louis, FRED: DGS2, DGS10, DGS30, DFII10, T10YIE, THREEFYTP10, DCOILBRENTEU, BAMLH0A0HYM2, TREAST and OECD long-term interest rate series (retrieved 19 October 2026).
- Agence France Trésor, Bulletin mensuel, August 2026.
- Finance Canada, Debt Management Report 2024-2025, and Fall Economic Update 2026, Annex on debt management.
- ifo Institute, economic forecast for Germany, 3 September 2026.
- INSEE, comptes nationaux des administrations publiques, année 2025, and quarterly public debt release for the second quarter of 2026 (as reported by Euronews).
- International Energy Agency, Oil Market Report, October 2026.
- International Monetary Fund, World Economic Outlook database, April 2026.
- Office for Budget Responsibility, debt interest ready reckoner (central government debt interest net of APF).
- UK Debt Management Office, Quarterly Reviews, October to December 2025 and April to June 2026.
- UK Finance, Monthly Economic Review, October 2026.
- US Government Accountability Office, Federal Debt Management, GAO-26-107529.
- US Department of the Treasury, presentation to the Treasury Borrowing Advisory Committee, Q2 2026.
- Kim, D. H. and Wright, J. H. (2005), “An Arbitrage-Free Three-Factor Term Structure Model and the Recent Behavior of Long-Term Yields and Distant-Horizon Forward Rates”, Federal Reserve Board, Finance and Economics Discussion Series 2005-33.
