
Housing in a 5 Percent World: The Affordability Gap in Five Markets and Why Prices Will Grind, Not Crash


Driss EFFINA, PhD Independent Researcher, Global Strategy Files Decoded, analysis note No. 12, 24 October 2026. Reading time: about 55 minutes
Key takeaways
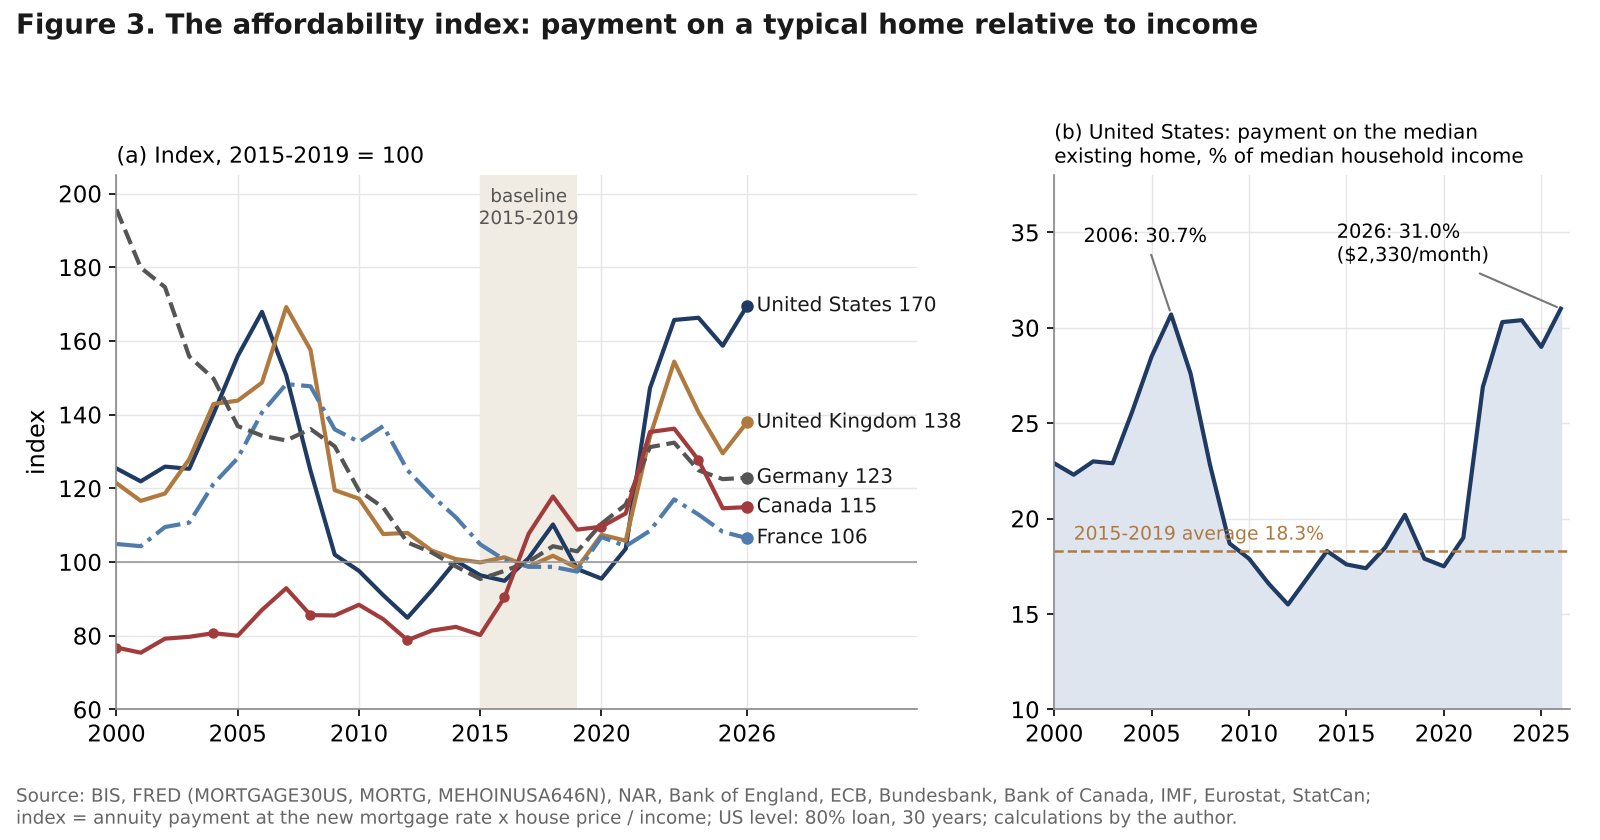
- The payment on a new mortgage for a typical US home, relative to median household income, is 69.5 percent above its 2015 to 2019 average and above its 2006 peak; it absorbs 31.0 percent of median income, against 18.3 percent before the pandemic.
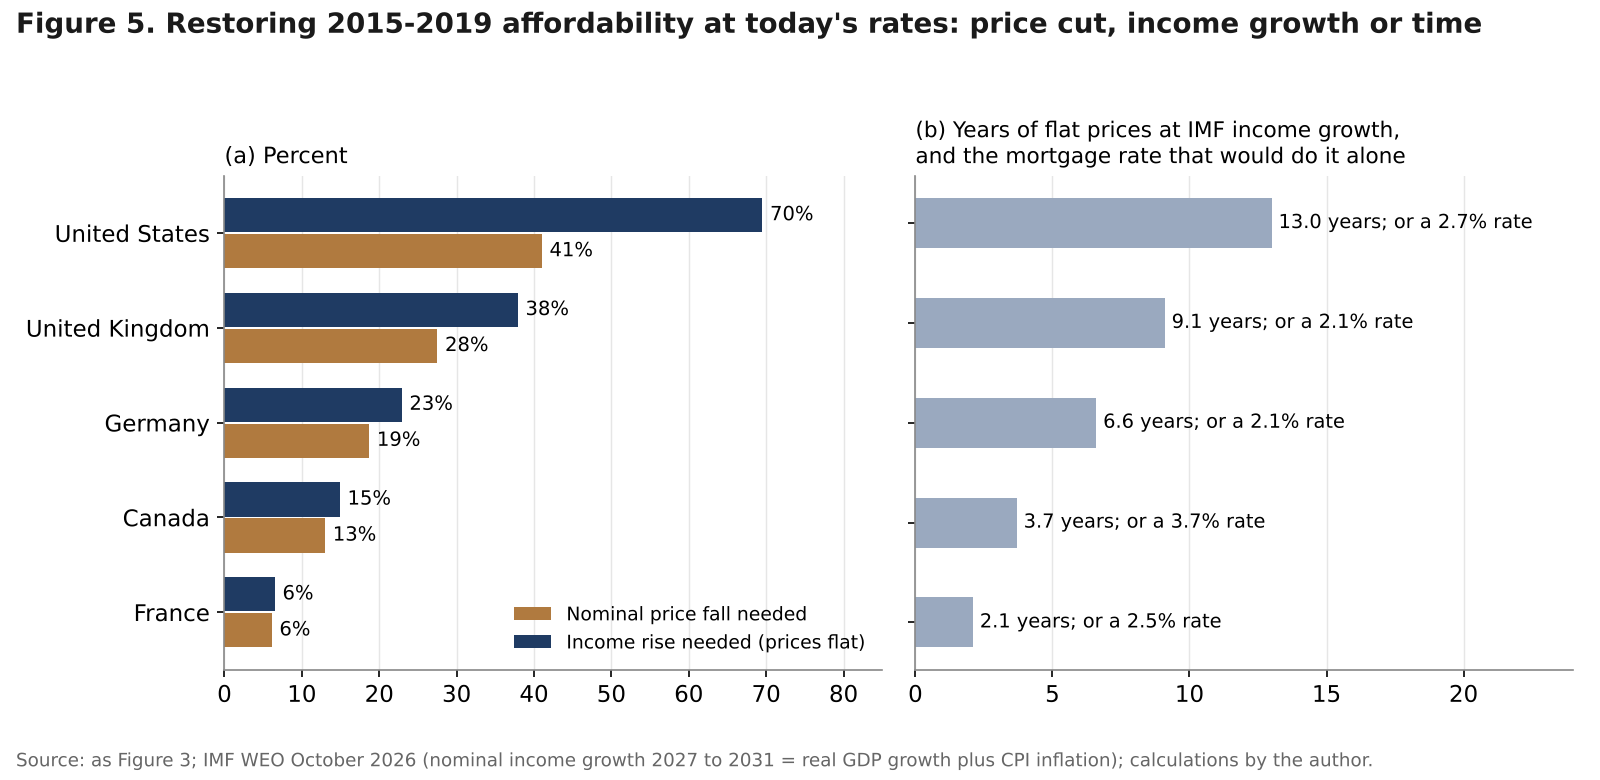
- At today’s rates, restoring 2015 to 2019 affordability would take nominal price falls of 41 percent in the United States, 27.5 percent in the United Kingdom, 18.7 percent in Germany, 13 percent in Canada and 6.1 percent in France, or 2 to 13 years of flat prices.
- Lock-in follows the mortgage contract: a 1-point rise in rates cuts transactions by 10.1 percent in the United States, 8.1 percent in France, 4.8 percent in Canada and 1.8 percent in the United Kingdom; the rate explains 23 of the 25 percent US sales shortfall.
- In the author’s scenarios to 2028, probability-weighted nominal prices fall 3.5 percent in the United States and 5.5 percent in Canada and rise 1.5 to 4.6 percent in Europe; affordability improves but the US index stays 45 percent above its pre-pandemic norm.
Abstract
The 2026 oil shock has pushed the rate on a new mortgage back above 5 percent in the United States, the United Kingdom and Canada, and to 4 percent in Germany. For a household that wants to buy, the question is no longer whether rates will return to the levels of the 2010s but what has to give instead: prices, incomes or time. This note answers that question for the United States, the United Kingdom, France, Germany and Canada with five tools built for it. The first is an affordability index, the annual payment on a new mortgage for a typical home relative to income, computed from 2000 to 2026 and decomposed into the contributions of rates, prices and incomes. The second is the “required correction”: the fall in nominal prices, the rise in incomes or the number of years of flat prices that would restore the affordability of 2015 to 2019 at today’s rates. The third is a set of valuation gaps (price-to-rent, price-to-income, real prices and the cost of owning relative to renting), combined in a heatmap. The fourth is a model of transactions against mortgage rates that measures the lock-in effect country by country. The fifth is a price-adjustment model, estimated on 120 country-years, that drives three scenarios to 2028 with explicit probabilities. The central result is a ranking. The United States has the least affordable market in at least 26 years and needs the largest adjustment; the United Kingdom and Germany sit in the middle; Canada has already done most of its correction through falling prices; France is close to its pre-2020 norm. In none of the five does the arithmetic point to a crash. It points to a long grind in which incomes, not prices, do most of the work, and in which the first casualty is the number of homes that change hands.
Keywords: housing affordability, mortgage rates, house prices, price-to-rent, lock-in effect, housing transactions, error-correction model, scenarios
JEL codes: E43, G21, R21, R31
Key findings
1. The United States is at its least affordable point since at least 2000. The annual payment on a new 30-year mortgage for a typical home, relative to median household income, stands 69.5 percent above its 2015 to 2019 average, above the previous peak of 2006 (67.9 percent above). For the median existing home, principal and interest absorb 31.0 percent of median household income, against 18.3 percent in 2015 to 2019. The index is 37.9 percent above that norm in the United Kingdom, 22.9 percent in Germany, 14.9 percent in Canada and 6.5 percent in France.
2. Since 2021 the rate has done the damage; elsewhere, incomes and falling prices have absorbed most of it. Between 2021 and 2026 the rise in mortgage rates added 50 log points to the US payment burden and 40 in the United Kingdom, but only 19 to 31 in France, Germany and Canada, where nominal prices were flat or lower (Canada minus 6.8 percent) and income growth of 18 to 24 log points offset most of the rate shock. Real prices are 31.5 percent below their peak in Canada and 21.5 percent in Germany, but only 3.8 percent in the United States.
3. The required correction is large where it is least likely to happen. At today’s rates and incomes, restoring 2015 to 2019 affordability would take a 41 percent fall in nominal US prices, 27.5 percent in the United Kingdom, 18.7 percent in Germany, 13 percent in Canada and 6.1 percent in France. With flat nominal prices and IMF income growth, the same result takes 13.0 years in the United States, 9.1 in the United Kingdom, 6.6 in Germany, 3.7 in Canada and 2.1 in France. Rates alone would have to fall to 2.1 to 2.7 percent in four of the five markets.
4. Lock-in shows up in volumes, and it follows the mortgage contract. In annual data for 2016 to 2026, a 1-point rise in the new mortgage rate lowers transactions by 10.1 percent in the United States (30-year fixed loans that cannot be moved), 8.1 percent in France, 4.8 percent in Canada and only 1.8 percent, not significantly, in the United Kingdom (short, portable fixes). Once the rate is controlled for, the price-to-income ratio adds nothing. The rate alone explains 23 of the 25 percent shortfall in US existing-home sales against 2016 to 2019, about 1.35 million fewer sales a year.
5. Grind, not crash, to 2028. In the author’s scenarios (slow grind 50 percent, price correction 25 percent, rate relief 25 percent), probability-weighted nominal prices change by minus 3.5 percent in the United States and minus 5.5 percent in Canada between 2026 and 2028, and rise by 1.5 to 4.6 percent in the three European markets. Affordability improves everywhere, but in 2028 the US index is still 45 percent above its 2015 to 2019 norm and the UK index 26 percent; Canada (98) and France (101) are back to it. Even the price correction scenario does not restore US affordability, because the rates that cause it also raise the payment.
1. Introduction: the buyer’s arithmetic
A household that wants to buy a home faces three numbers: the price of the home, the rate on a new mortgage and its own income. For a decade after the global financial crisis, the second number was so low that the first could rise faster than the third without making homes harder to buy. That decade ended in 2022. The oil shock of 2026 has now closed the door on any quick return to it.
The war involving Iran that began at the end of February 2026 disrupted the Strait of Hormuz. Brent averaged 70.9 dollars a barrel in February and 127.0 dollars in October. Long-term yields rose, and new mortgage rates followed them. The US 30-year fixed rate averaged 7.36 percent in October, against 6.05 percent in February, and was 7.32 percent in the week of 22 October. The quoted UK 2-year fixed rate at 75 percent loan-to-value rose from 3.97 to 5.13 percent between February and September. In Canada, the rate actually offered on a 5-year fixed loan, approximated by the 5-year government yield plus 150 basis points, rose from 4.31 to 5.08 percent. The composite cost of borrowing for house purchase rose from 3.77 to 4.00 percent in Germany and from 3.10 to 3.20 percent in France between February and August.
Decoded No. 2, “The Mortgage Reset Clock”, measured when those rates reach households that already have a mortgage. This note is about the other side of the market: the buyer, the seller who would have to become a buyer, the builder, the lender that originates new loans and the policy maker who cares whether young households can still own a home. Its questions are simple. How unaffordable are homes in each market, against their own history? What moved the burden: rates, prices or incomes? What would it take to restore the affordability of the late 2010s if rates stay near 5 percent? How much of the collapse in transactions is lock-in? And what are the plausible paths to 2028?
The answer to the third question shapes the rest. If affordability can only be restored by a price fall of 40 percent, it will not be restored by prices; history shows that nominal house prices rarely fall that far outside a banking crisis. It will be restored by time, as incomes grow and prices stall, and the cost of that adjustment will be paid in lost transactions, fewer first-time buyers and lower construction. That is what this note calls the grind.
Section 2 sets out the 2026 picture in each market. Section 3 builds the affordability index and Section 4 decomposes it. Section 5 computes the required correction. Section 6 turns to valuation. Section 7 measures lock-in through transactions, and Section 8 estimates how prices adjust. Section 9 presents three scenarios to 2028. A dashboard, implications for buyers, builders, banks and policy, and a dated watch list close the note.
2. Five markets in 2026
2.1 The snapshot
Table 1 brings together the latest official readings for each market. They describe a common shock with very different starting points.
Table 1. Housing markets in 2026: latest official readings. Sources: S&P Cotality, NAR, US Census Bureau, BLS, Freddie Mac; ONS, HMRC, Bank of England; INSEE-Notaires, Banque de France, Observatoire Credit Logement/CSA, SDES; Destatis, ECB; CREA, CMHC, Statistics Canada, Rentals.ca/Urbanation, Bank of Canada. Retrieved 24 October 2026.
| Market | Prices | Transactions and lending | New mortgage rate | Rents | Supply |
|---|---|---|---|---|---|
| United States | Case-Shiller national +1.9% y/y (Jul); NAR median 417,500 USD, +1.3% (Sep) | Existing-home sales 3.99m SAAR (Sep), -2.2% y/y; 4.8 months’ supply; first-time buyers 31% | 30-year fixed 7.36% (Oct average); 7.32% (week of 22 Oct) | CPI rent +2.8% y/y (Sep) | Starts 1.221m SAAR (Sep), -7.4% y/y; permits 1.400m, -3.0% |
| United Kingdom | ONS UK HPI 273,000 GBP, +0.9% y/y (Aug); London -2.2% | HMRC residential 96,710 SA (Jul), -1% y/y; approvals for house purchase 54,900 (Aug) | 2-year fixed 75% LTV 5.13% (Sep); effective rate on new loans 4.6% (Aug) | Private rents 1,406 GBP, +3.8% y/y (Sep) | No UK-wide monthly series |
| France | Existing homes -0.8% y/y (Q2) | 958,000 sales over 12 months (Jun); new housing loans 12.2bn EUR (Aug) | 3.32% (Banque de France, Aug); 3.40% (Credit Logement, Sep) | IRL +1.57% y/y (Q3) | 370,673 dwellings authorised over 12 months to July, 9.5% below 5-year average |
| Germany | Destatis +0.6% y/y (Q2) | No official national count | 4.00% composite cost of borrowing (Aug) | Net cold rents +1.9% y/y (Sep) | Permits 169,480 Jan to Aug, +12.1% y/y; completions 2025: 206,000, -18% |
| Canada | CREA HPI -3.4% y/y; average 666,538 CAD, -1.6% (Sep) | Sales -7.7% y/y (Sep); CREA 2026 forecast 444,530, -5.2% | 5-year fixed proxy 5.08% (Oct); posted 6.19% | Asking rents 2,034 CAD, -4.2% y/y; CPI rent +2.8% (Sep) | Starts 248,896 SAAR (Sep); permits 13.6bn CAD (Aug) |
Three features stand out. First, prices are flat in nominal terms almost everywhere and falling in real terms: with consumer price inflation between 3.1 and 3.7 percent in the five economies, a nominal gain of 1 to 2 percent is a real loss. Canada is the only market where nominal prices are falling clearly, by 3.4 percent on the CREA benchmark. Second, activity is weak where rates rose most. US existing-home sales have been stuck near 4 million a year since 2023; the National Association of Realtors’ chief economist said in October that “further increases in mortgage rates in recent weeks mean fewer buyers can qualify to purchase a home”. UK approvals for house purchase fell to 54,900 in August, the lowest since December 2023, and CREA cut its 2026 sales forecast for the third time, its senior economist calling the September fall “hardly surprising given the latest jump in fixed mortgage rates”. Third, the European markets are calmer. French transactions have recovered to 958,000 over twelve months, from 792,000 at the end of 2024, and German permits are up 12.1 percent this year.
2.2 Twenty-six years of rates, prices and rents
Figure 2 places 2026 in a longer frame. Panel (a) shows the new mortgage rate. The rates of 2026 are not high by the standard of 2000, when buyers paid 7 to 8 percent; they are high by the standard of the decade that formed today’s price levels. Between 2015 and 2019 the average new rate was 3.99 percent in the United States, 2.83 percent in Canada and below 1.8 percent in the United Kingdom, France and Germany. Panels (b) and (c) show that prices were built on those rates. Nominal prices in 2026 are 72 percent above their 2015 to 2019 average in the United States, 25 to 36 percent above in the United Kingdom, Germany and Canada, and 20 percent above in France. Panel (d) shows the other side of the buyer’s choice: rents rose by 29 to 30 percent between 2021 and 2026 in the United States, the United Kingdom and Canada.
A first look at the results
The full note goes much further, with original models, scenarios and a dashboard of leading indicators. Two of its 14 charts and diagrams are shown below.
Continue reading
Get the full note: 25 pages, 14 charts and diagrams, 9 tables
This page shows the first part of the note. The full PDF adds: the affordability index; what moved the burden: rates, prices and incomes; the required correction; valuation: price-to-rent, real prices and the cost of owning; transactions and the lock-in effect; how prices adjust; scenarios to 2028; leading-indicators dashboard; implications for buyers, builders, banks and policy.
29 USD, instant PDF download, secure card payment.
Buy the full noteNeed this analysis for your organisation?
We prepare confidential briefings, executive talks and studies on countries, markets and policies, built on the same method as this article.
Request a briefingSupport independent analysis
Our studies are free to read and carry no advertising. If this one was useful, a small contribution helps us publish the next.
Support our workGo further: books by Global Strategy Files

Frequently asked questions
How unaffordable are US homes in 2026?
On an index of the annual payment on a new 30-year mortgage for a typical home relative to median household income, the United States stands 69.5 percent above its 2015 to 2019 average in 2026, higher than in 2006. Principal and interest on an 80 percent loan for the median existing home take 31.0 percent of median household income, against 18.3 percent before the pandemic, or about 2,330 dollars a month.
How much would house prices have to fall to restore affordability?
At 2026 mortgage rates and incomes, returning to the affordability of 2015 to 2019 would require nominal price falls of 41 percent in the United States, 27.5 percent in the United Kingdom, 18.7 percent in Germany, 13 percent in Canada and 6.1 percent in France. With flat prices and IMF income growth, the same result takes 13, 9.1, 6.6, 3.7 and 2.1 years respectively.
What is the mortgage lock-in effect and where is it strongest?
Lock-in occurs when owners with low fixed-rate mortgages avoid selling because a new loan would cost much more. Across 2016 to 2026, a 1-point rise in new mortgage rates lowered transactions by 10.1 percent in the United States, where 30-year loans cannot be moved, 8.1 percent in France and 4.8 percent in Canada, but only 1.8 percent in the United Kingdom, where fixes are short and portable.
Will house prices crash by 2028?
The author’s scenarios point to a grind rather than a crash. With a 50 percent slow grind, 25 percent price correction and 25 percent rate relief, probability-weighted nominal prices fall 3.5 percent in the United States and 5.5 percent in Canada and rise 1.5 to 4.6 percent in the United Kingdom, France and Germany between 2026 and 2028. Real prices fall in all five markets, mostly through inflation.
Sources
- Bank for International Settlements, residential property prices (nominal and real), via FRED: QUSN628BIS, QGBN628BIS, QFRN628BIS, QDEN628BIS, QCAN628BIS, QUSR628BIS, QGBR628BIS, QFRR628BIS, QDER628BIS, QCAR628BIS, QFRN368BIS, QFRR368BIS; credit to households (Q*HAM770A).
- Freddie Mac Primary Mortgage Market Survey via FRED: MORTGAGE30US, MORTG; weekly rate of 22 October 2026 as reported by Trading Economics.
- US Census Bureau, “Monthly New Residential Construction, September 2026”, 20 October 2026; median household income via FRED (MEHOINUSA646N, updated 16 September 2026).
- National Association of Realtors, “Existing-Home Sales Increased 1.5% in September”, 13 October 2026; NAHB, “Nationwide Sales and Inventory”; HousingWire, “2017 was the best year for existing home sales since 2006”; Mortgage News Daily, 22 January 2020; AP, “2025 home sales stuck at 30-year low”, January 2026.
- S&P Dow Jones Indices, “S&P Cotality Case-Shiller Index Reports Annual Gain in July 2026”, 29 September 2026.
- Bureau of Labor Statistics, “Consumer Price Index, September 2026”, 14 October 2026; CPI rent of primary residence (CUSR0000SEHA) and ECI wages and salaries (ECIWAG) via FRED.
- Office for National Statistics, “Private rent and house prices, UK: October 2026”, 21 October 2026, and October 2025 edition (via Mortgage Solutions, 22 October 2025).
- Bank of England, Money and Credit, August 2026 (as reported 29 September 2026); Bank of England Database: IUMBV34, IUMBV42, IUMABEDR, CFMHSDE; Household variable mortgage rate (HVMRUKQ, Millennium of Macroeconomic Data) via FRED.
- HMRC, UK monthly property transactions (July 2026, as reported by Money to the Masses), and UK Housing Review 2026, Table 40 (Chartered Institute of Housing).
- INSEE, Informations Rapides No. 216, “Prix des logements anciens, deuxieme trimestre 2026”, 8 September 2026; IPLA releases for the fourth quarters of 2016, 2017, 2019, 2020, 2021, 2022, 2023, 2024 and 2025; Informations Rapides No. 246, “Indice de reference des loyers, troisieme trimestre 2026”, 15 October 2026.
- Banque de France, Stat Info “Les credits aux particuliers, aout 2026”, 6 October 2026.
- Observatoire Credit Logement/CSA, September 2026 (as reported by MySweetImmo, 15 October 2026); tableaux de bord trimestriels T4 2012 and T4 2014.
- SDES, Sitadel results to end-July 2026 (as reported by BoursedesCredits, 16 September 2026).
- La finance pour tous, “Pret a taux zero : deux evolutions majeures a partir du 1er avril 2025”, 13 March 2025.
- Destatis, press releases No. 336 (house price index, 24 September 2026) and No. 364 (consumer prices, 13 October 2026); building permits August 2026 and completions 2025 (as reported by Baulinks, 16 October 2026 and 22 May 2026).
- Deutsche Bundesbank, housing loan rates SU0046 and SUD118 (annual averages as tabulated by baufivergleich.de, August 2026).
- European Central Bank, MFI interest rate statistics (composite cost of borrowing for house purchase, France, Germany, euro area).
- Canadian Real Estate Association: September 2026 data and forecast (The Canadian Press, 16 October 2026); annual sales for 2017, 2018, 2020, 2021, 2023 and 2025 (CREA, The Globe and Mail, CBC, Advisor.ca).
- CMHC, “Housing starts: September 2026”, 16 October 2026; Statistics Canada, building permits August 2026 (14 October 2026) and CPI September 2025 and September 2026; Rentals.ca/Urbanation rent report (Advisor.ca, 7 October 2026).
- Bank of Canada Valet: V39079, V80691335, BD.CDN.5YR.DQ.YLD; 10-year yield IRLTLT01CAA156N via FRED.
- Department of Finance Canada, “Government announces boldest mortgage reforms in decades”, September 2024.
- Setfords, “Stamp duty for first time buyers”, 3 April 2025 (changes from 1 April 2025).
- OECD consumer price indices, actual rentals for housing (GBRCP040100IXOBQ, FRACP040100IXOBQ, CANCP040100IXOBQ); Eurostat HICP actual rentals (CP0410FRM086NEST, CP0410DEM086NEST) via FRED.
- Eurostat quarterly national accounts via FRED (CPMEURNSAB1GQFR, CPMNACSCAB1GQDE); OECD (GBRGDPNADSMEI); IMF (NGDPXDCCAA); ICAEW, “Chart of the week: a 3tn economy”, April 2026.
- IMF, World Economic Outlook, October 2026 (DataMapper); World Bank population estimates.
- FRED: DCOILBRENTEU, FEDFUNDS, ECBDFR. Bank of England, Federal Reserve, ECB and Bank of Canada meeting calendars for 2026 and 2027.
- Global Strategy Files, Decoded No. 2, “The Mortgage Reset Clock”, 2026.
- Data retrieved on or before 24 October 2026; notes data files fetched on 20 October 2026.
Books from Global Strategy Files
Go further on this topic
The Tariff GambleHow America’s trade war is reshaping power, prices and prosperity.24.99 USD, see the book Future-Proofing AmericaEconomic challenges and the road to reform.20 USD, see the book
 Kill KennedyWhat the 2025 declassified files reveal about the machinery of American power.20 USD, see the book
