America’s Interest Bill: When Debt Service Outgrows Defence and Medicare

Driss EFFINA, PhD Independent Researcher, Global Strategy Files Foresight, prospective note No. 7, 24 October 2026. Reading time: about 60 minutes
Key takeaways
- Net interest reached 1,052 billion dollars in fiscal year 2026, 19.5 percent of federal revenue, above the 1991 record of 18.4 percent; it exceeds defence by 87 billion dollars and is 21 billion dollars short of Medicare.
- In the two most likely yield paths (65 percent combined), interest overtakes Medicare in fiscal year 2027, a year earlier than in CBO’s February baseline; it reaches 2.17 trillion dollars and 26 percent of revenue by 2036 in the central path.
- The growth cushion is gone: over 2027 to 2036 interest and nominal growth roughly cancel in the central path, so primary deficits drive the whole rise in debt; the effective rate exceeds growth from 2031.
- Stabilising debt at about 102 percent of GDP requires a primary improvement of 2.4 percent of GDP from 2028 (about 834 billion dollars a year), or 3.8 percent if action waits until 2031; drift is the most likely political outcome (45 percent).
Abstract
In fiscal year 2026, which ended on 30 September, the United States federal government paid 1,052 billion dollars in net interest. That is 81 billion dollars more than a year earlier, 87 billion dollars more than it spent on national defence, and only 21 billion dollars less than it spent on Medicare. Net interest absorbed 19.5 percent of federal revenue, a share never recorded in the official series that start in 1940; the previous record, 18.4 percent, dates from 1991. Put differently, every dollar the federal government collected between 1 October and about 10 December 2025 went to its creditors.
This note asks where the interest bill goes from here, and why. It builds an original projection model of the federal interest bill to 2036 that follows the Treasury’s debt portfolio maturity by maturity: bills that reprice within months, notes and bonds that roll off over years, inflation-linked securities whose principal grows with prices, and new borrowing of about 2 trillion dollars a year. The model is calibrated on the Treasury’s September 2026 debt statistics and the fiscal year 2026 outturn, and it is run under four yield paths, from a relief scenario in which the oil shock fades to a term-premium shock that pushes the 10-year yield above 6 percent. It then dates the years in which interest overtakes defence, Medicare and Social Security; decomposes the debt ratio into primary deficits, interest, growth and stock-flow effects; compares the American interest burden with history and with the other G7 economies on IMF data; computes the fiscal adjustment that would stabilise debt, in percent of GDP and in dollars; and sets out four political-economy scenarios with explicit probabilities. Every projection is the author’s.
Keywords: United States, federal budget, net interest, public debt, debt management, Treasury bills, maturity structure, r minus g, fiscal sustainability, Medicare, defence spending, 2025 tax law
JEL codes: H63, H62, H68, E43, E62, G12
Key findings
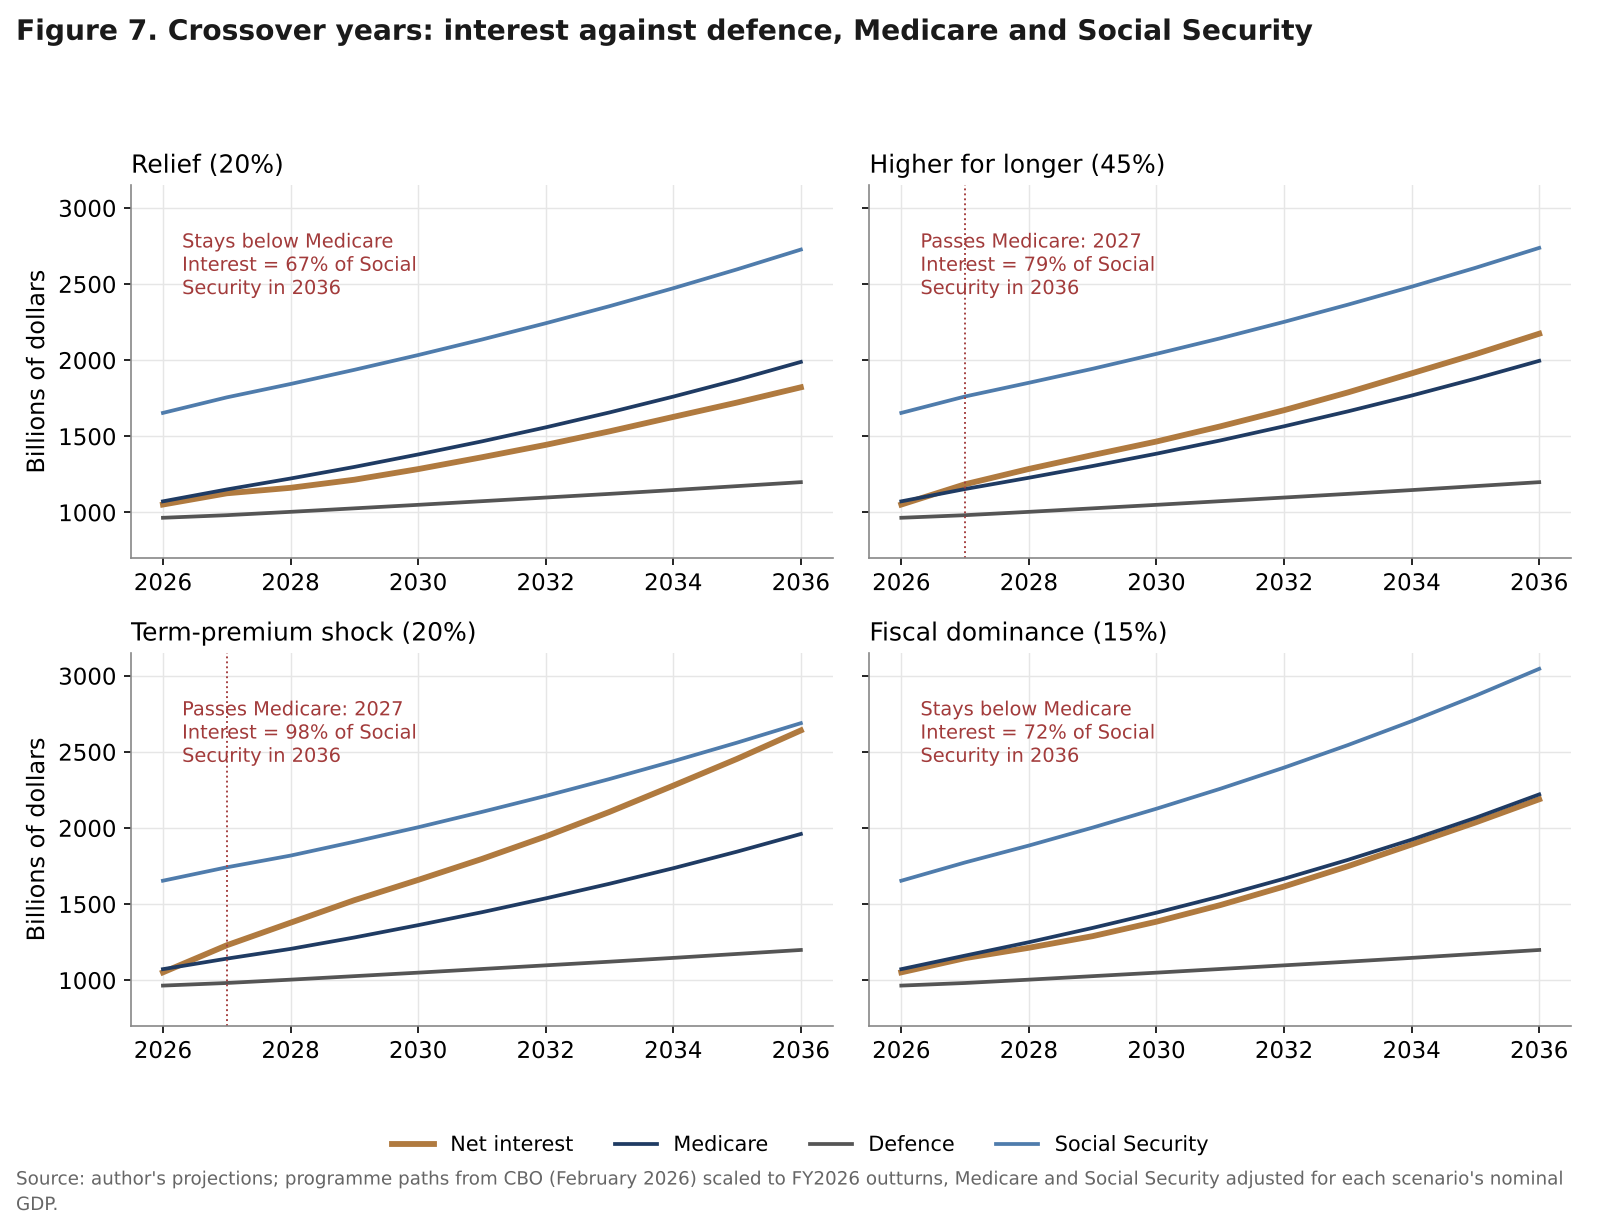
1. The record has already been broken. Net interest reached 19.5 percent of federal revenue in fiscal year 2026, above the 1991 peak of 18.4 percent, and 3.26 percent of GDP on the author’s estimate of fiscal-year GDP, also a record since 1940. Interest exceeds national defence by 87 billion dollars and is 21 billion dollars short of Medicare. 2. Interest overtakes Medicare in fiscal year 2027 in the two most likely yield paths. In the central “higher for longer” path (probability 45 percent) and in the term-premium shock (20 percent), net interest passes Medicare next year, one year earlier than in the Congressional Budget Office’s February 2026 baseline. Only in the relief path does it stay below Medicare to 2036. No path takes interest above Social Security by 2036, but in the term-premium shock interest reaches 98 percent of Social Security outlays that year. 3. The bill reprices fast because the debt is short. With 33 percent of marketable debt maturing within 12 months and 55 percent within 36 months, 59 percent of the debt will carry an interest rate set after fiscal year 2026 by 2029. Net interest reaches 2.17 trillion dollars in 2036 in the central path (4.6 percent of GDP, 26 percent of revenue), and between 1.82 and 2.64 trillion dollars across the four paths. A permanent 1 percentage point rise in all yields adds 99 billion dollars in the first year, 290 billion dollars by 2030 and 651 billion dollars by 2036. 4. The growth cushion is gone. Over 2027 to 2036, interest adds 40 points of GDP to the debt ratio in the central path and nominal growth removes 41: for the first time in a generation, interest and growth roughly cancel, so primary deficits (23 points) explain the entire rise in debt. The effective interest rate on the debt exceeds nominal growth from 2031 in the central path and immediately in the term-premium shock. 5. Stabilising debt now costs about 2.4 percent of GDP; waiting raises the price. Bringing debt back to its 2027 ratio of about 102 percent of GDP by 2036 requires a primary improvement of 2.4 percent of GDP, phased in from 2028, about 834 billion dollars a year at fiscal year 2028 GDP. Starting in 2031 raises the requirement to 3.8 percent of GDP. Among the G7 economies covered by IMF data, the United States already has the heaviest general government interest burden and the fastest increase to 2031 (from 3.2 to 5.0 percent of GDP). 6. Drift is the most likely outcome, and markets will notice. In four political-economy scenarios, drift at higher rates is the most likely (45 percent). The probability-weighted path takes debt held by the public to 116 percent of GDP and net interest to 24.6 percent of revenue in 2036. Shortening the debt further would lower expected interest costs (by about 0.5 trillion dollars over ten years if bills rose from 22 to 30 percent of the debt) but would raise the cost of a bill-rate shock by about 30 percent.
1. Introduction
For most of the last forty years, interest on the federal debt was a budget line that took care of itself. Between 1991 and 2015, the share of federal revenue absorbed by interest fell from 18.4 percent to 6.9 percent, even though debt held by the public rose from 44 to 72 percent of GDP. Falling interest rates did the work. A government that borrows at a rate below the growth rate of its economy can run modest primary deficits forever without raising its debt ratio, and for most of the 2010s the United States was such a government.
That world ended in two steps. The first was the inflation of 2021 and 2022 and the rise in policy rates that followed. The second was 2026. The war that began at the end of February 2026 and disrupted the Strait of Hormuz sent Brent crude above 100 dollars a barrel in March and to a monthly average of about 127 dollars in October. Inflation rose back above 3.5 percent. On 16 September 2026, the Federal Reserve raised its target range for the federal funds rate by a quarter point, to 3.75 to 4.00 percent. The 10-year Treasury yield, which had averaged about 4.3 percent in 2025, stood at 5.1 percent in mid-October 2026.
Decoded No. 1 in this series analysed the 2026 bond sell-off and the speed with which it passes into the interest bills of five governments. This note does something different. It takes yield paths as inputs (the bond market side of the story is covered in Decoded No. 1 and Foresight No. 6) and asks a budget question: what happens to the federal interest bill over the next ten years, how does it compare with the programmes it competes with, and what would it take to stop it rising as a share of the economy? The note works on the federal budget as the Congressional Budget Office (CBO) and the Treasury measure it, over a ten-year horizon, rather than on general government debt to 2050, which Foresight No. 1 covered.
Four questions structure the analysis. When does interest overtake the large programmes of the federal budget? How much of the coming increase comes from more debt and how much from higher rates? Where does the United States stand against its own history and against other advanced economies? And what does stabilisation require? Figure 1 maps the chain from a yield shock to the budget that the rest of the note quantifies.
Three limits should be stated at the outset. First, the model is a model: it reproduces the structure of the Treasury portfolio in a simplified form, and its levels depend on assumptions documented in Box 1. Second, the yield paths are assumptions, not forecasts of the bond market. Third, the comparisons with defence, Medicare and Social Security use CBO’s programme projections, scaled to the fiscal year 2026 outturn; they do not model changes in programme policy, which belong to the political-economy scenarios in Section 12.
2. Fiscal year 2026: interest passes defence, Medicare in sight
2.1 The outturn
Table 1 sets out the fiscal year 2026 numbers. Revenue rose by 3.2 percent, held back by falling customs duties, while outlays rose by 5.5 percent. Net interest rose fastest of all major lines, by 8.3 percent. The deficit reached 1,993 billion dollars, about 6.2 percent of GDP on the author’s estimate of fiscal-year GDP and 140 billion dollars more than CBO projected in February.
Table 1. The federal budget in fiscal years 2025 and 2026, billions of dollars
| Item | FY2025 | FY2026 | Change | Change, % | FY2026, % of GDP | FY2026, % of outlays |
|---|---|---|---|---|---|---|
| Receipts | 5,235 | 5,403 | +168 | 3.2 | 16.7 | 73.1 |
| Outlays | 7,010 | 7,396 | +386 | 5.5 | 22.9 | 100.0 |
| Deficit | 1,775 | 1,993 | +218 | 12.3 | 6.2 | 26.9 |
| Social Security | 1,569 | 1,654 | +85 | 5.4 | 5.1 | 22.4 |
| Medicare | 997 | 1,073 | +76 | 7.6 | 3.3 | 14.5 |
| Net interest | 971 | 1,052 | +81 | 8.3 | 3.3 | 14.2 |
| National defence | 917 | 965 | +48 | 5.2 | 3.0 | 13.0 |
| Customs duties | 195 | 172 | -22 | -11 | 0.5 | n.a. |
Sources: Treasury, final Monthly Treasury Statement for FY2026 (16 October 2026), budget functions as reported by the American Action Forum (18 October 2026); CBO, Monthly Budget Review: September 2026 (Social Security benefits, receipts, outlays, customs duties); GDP for FY2026 is the author’s estimate (CBO’s FY2025 GDP grown by 6.3 percent).
Three facts stand out. First, net interest was 3.26 percent of GDP, above the previous high of 3.16 percent reached in 1991, and 19.5 percent of revenue, above the 1991 record of 18.4 percent. Fiscal year 2025 had already set a new record on the revenue measure (18.5 percent); 2026 extended it by a full point. At 2.88 billion dollars a day, the interest bill absorbed all federal revenue for 71 days of the year.
Second, net interest exceeded national defence by 87 billion dollars, against 54 billion dollars in fiscal year 2025. Interest is now the third-largest line of the federal budget, behind Social Security and Medicare.
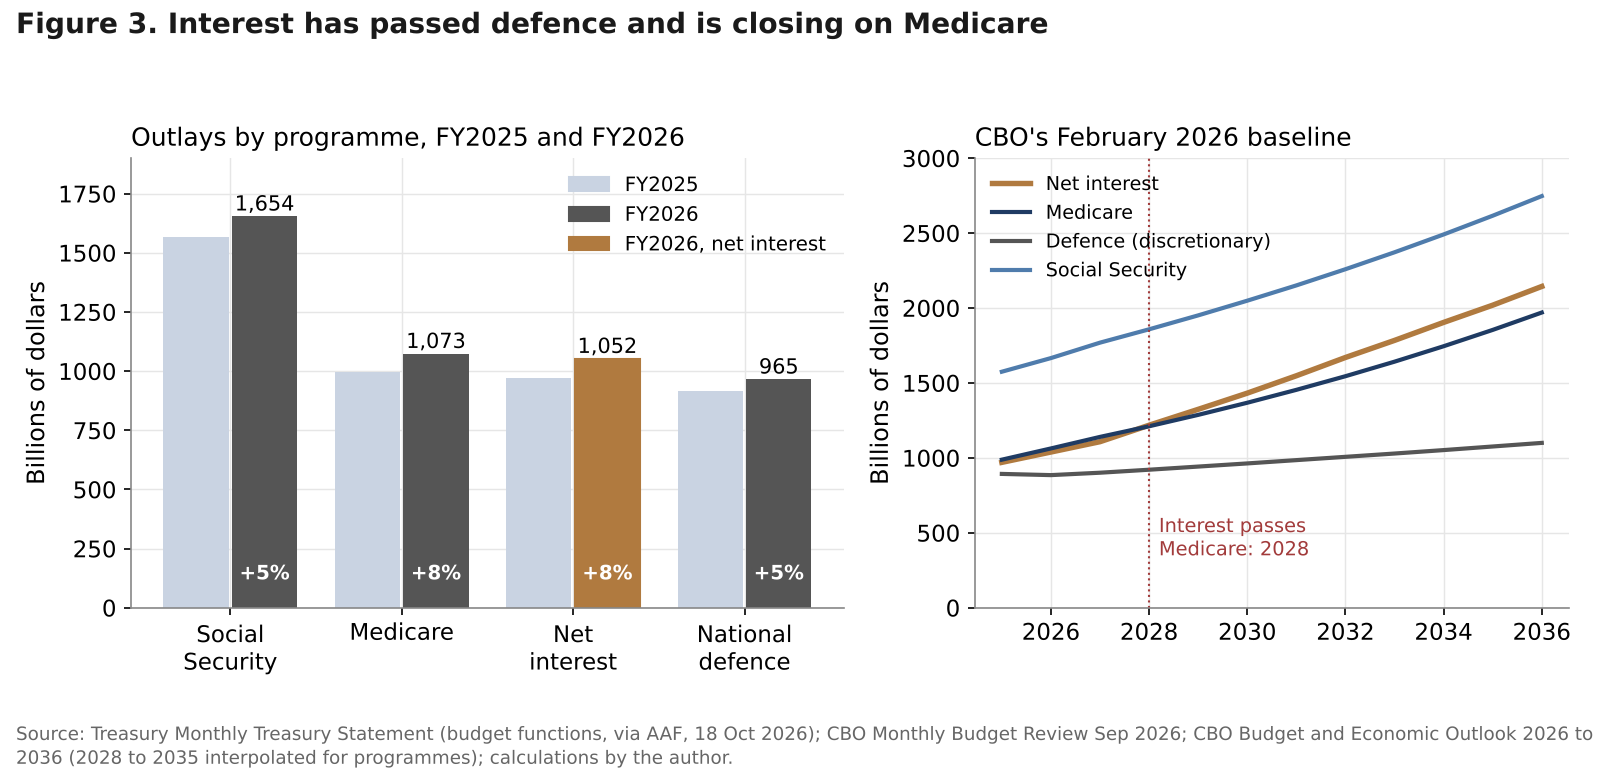
Third, the gap between Medicare and interest narrowed to 21 billion dollars. Medicare grew quickly (7.6 percent), but interest grew faster. At the growth rates of 2026, the lines cross within a year.
Figure 2 places these numbers in history. The left panel shows that the share of revenue going to interest has been above 15 percent only twice since 1940: in the decade after 1982, when the Federal Reserve held interest rates very high to break inflation, and now. The right panel shows why the two episodes differ. In 1991 the United States paid 3.2 percent of GDP in interest on debt of 44 percent of GDP, because the average interest rate on its debt was high (the average rate on marketable Treasury debt was 8.06 percent in September 1991). In 2026 it pays about the same share of GDP on debt more than twice as large, at an average rate of 3.52 percent. The burden is the same; the exposure is twice as large. A given rise in rates now costs twice as much in percent of GDP as it did in 1991.
2.2 The CBO baseline and what has changed since February
CBO’s February 2026 baseline projected net interest at 1,039 billion dollars in fiscal year 2026, rising to 2,144 billion dollars in 2036, or from 3.3 to 4.6 percent of GDP. It projected debt held by the public to rise from 101 percent of GDP in 2026 to 120 percent in 2036, a record above the 106 percent reached in 1946, which it projected to be passed in 2030. Interest rates in that baseline were moderate: a 3-month bill rate of 3.2 to 3.3 percent in 2026 and 2027 falling to 3.1 percent, and a 10-year yield of 4.1 percent in 2026 rising to 4.4 percent from 2031.
In CBO’s baseline, interest passes Medicare in 2028 (Figure 3, right panel), the same year identified in CBO’s long-term outlook of March 2026, which also projected interest to exceed Social Security in 2047 and to reach 6.9 percent of GDP in 2056.
Three things have changed since February. Market rates are higher: the 10-year yield is about 1 percentage point above CBO’s 2026 assumption and the bill rate about 0.6 point above it. Inflation is higher, which raises the indexation of Treasury Inflation-Protected Securities (TIPS) and nominal GDP. And the revenue base has shifted, because the Supreme Court ruled on 20 February 2026 that tariffs could not be imposed under the International Emergency Economic Powers Act (IEEPA).
2.3 What the 2025 tax law and the tariff ruling did to the interest bill
The 2025 reconciliation act, Public Law 119-21, is part of the interest story in two ways. In its August 2025 estimate, CBO found that the law raises primary deficits by 3.4 trillion dollars over 2025 to 2034 and debt-service costs by 718 billion dollars, a total of 4.1 trillion dollars. Debt service is therefore 17.5 percent of the law’s total cost: each dollar of primary cost carries 21 cents of interest within the first decade, at the interest rates CBO assumed in 2025. If the temporary provisions of the law were made permanent, the total cost would rise to 5.0 trillion dollars. In its February 2026 baseline, CBO attributed 4.7 trillion dollars of higher deficits to the law once economic and debt-service effects are included, against 3.0 trillion dollars of lower deficits from higher tariffs.
The tariff offset has since shrunk. CBO estimated on 5 March 2026 that the IEEPA ruling would raise deficits by 2.0 trillion dollars over 2026 to 2036, of which 1.6 trillion dollars in lower revenue and 0.4 trillion dollars (20 percent) in additional interest. Replacement tariffs under Section 122 of the Trade Act of 1974 (from 24 February 2026) and under Section 301 have recovered part of the loss; according to a CBO estimate cited by the Committee for a Responsible Federal Budget in August 2026, trade policy changes through 31 July 2026 raise primary deficits by 0.7 trillion dollars and total deficits by 0.9 trillion dollars over 2027 to 2036 relative to the February baseline. Refunds of IEEPA duties, about 130 billion dollars in fiscal year 2026 according to CBO, explain the fall in customs receipts in Table 1. The projections in this note include CBO’s 0.7 trillion dollar primary adjustment, spread evenly as a share of GDP (0.18 percent of GDP a year).
The lesson for the interest bill is simple. Every unfunded tax cut or lost revenue stream raises the interest bill by roughly a fifth of its own cost over a decade at 2025 rates, and by more at 2026 rates. Because interest compounds, the share rises with the horizon.
A first look at the results
The full note goes much further, with original models, scenarios and a dashboard of leading indicators. Two of its 15 charts and diagrams are shown below.
Continue reading
Get the full note: 28 pages, 15 charts and diagrams, 9 tables
This page shows the first part of the note. The full PDF adds: the plumbing: a short debt that reprices fast; four yield paths; the interest bill to 2036; crossover years: defence, Medicare and Social Security; volume or price? What drives the interest bill up; debt dynamics: the end of the growth cushion; the interest burden threshold: history and the G7; debt management: the bill-share dilemma; what it would take to stabilise the debt.
29 USD, instant PDF download, secure card payment.
Buy the full noteNeed this analysis for your organisation?
We prepare confidential briefings, executive talks and studies on countries, markets and policies, built on the same method as this article.
Request a briefingSupport independent analysis
Our studies are free to read and carry no advertising. If this one was useful, a small contribution helps us publish the next.
Support our workGo further: books by Global Strategy Files

Frequently asked questions
How much does the United States pay in interest on its debt?
In fiscal year 2026, which ended on 30 September 2026, federal net interest was 1,052 billion dollars, according to the Treasury’s final Monthly Treasury Statement. That is 81 billion dollars more than in 2025, about 3.3 percent of GDP and 19.5 percent of federal revenue, the highest share since at least 1940. Interest now exceeds national defence spending and is only 21 billion dollars below Medicare.
When will interest on the US debt exceed Medicare?
In CBO’s February 2026 baseline, net interest passes Medicare in 2028. With yields at their October 2026 levels, the author’s model brings the crossing forward to fiscal year 2027 in the central higher-for-longer path and in a term-premium shock, which together carry a 65 percent probability. Only if yields fall back markedly does interest stay below Medicare until 2036.
Why does the US interest bill react so quickly to higher yields?
Because the debt is short. About 22 percent of marketable Treasury debt is in bills, a third matures within twelve months and 55 percent within three years, while the average maturity is 71 months. On the author’s model, a permanent 1 point rise in all yields adds about 99 billion dollars of interest in the first year, 290 billion dollars by 2030 and 651 billion dollars by 2036.
What would it take to stabilise US federal debt?
On the author’s projections, returning debt held by the public to its 2027 level of about 102 percent of GDP by 2036 requires a primary improvement of about 2.4 percent of GDP, phased in from 2028, or roughly 834 billion dollars a year. If action waits until 2031, the requirement rises to about 3.8 percent of GDP, and to 5 percent in a term-premium shock.
Sources
All data retrieved on or before 24 October 2026.
- American Action Forum, “U.S. Treasury: FY 2026 Deficit Totaled $2 Trillion”, 18 October 2026 (budget functions from the final Monthly Treasury Statement for FY2026).
- American Action Forum, “Highlights of CBO’s February 2026 Budget and Economic Outlook”, 11 February 2026.
- AACOM, “President Trump Signs Continuing Resolution to Fund Government Through December 11”, 8 September 2026.
- Bloomberg, as published by The Star, “US interest costs hit record US$1 trillion”, 19 October 2026 (average rate on marketable Treasuries, nominal GDP growth).
- Bureau of Economic Analysis, “Gross Domestic Product (Third Estimate), 2nd Quarter 2026”, 30 September 2026.
- Center for Strategic and International Studies, “Tracking FY 2027 Defense Appropriations, Reconciliation, and the Supplemental Request”, August 2026.
- Committee for a Responsible Federal Budget, “Section 301 and 338 Tariffs Replace Less Than 60% of Lost IEEPA Revenue”, 23 July 2026, updated 20 August 2026.
- Congressional Budget Office, The Budget and Economic Outlook: 2026 to 2036, February 2026 (Tables 1-1 and 1-3).
- Congressional Budget Office, Monthly Budget Review: September 2026, 8 October 2026.
- Congressional Budget Office, The Long-Term Budget Outlook: 2026 to 2056, March 2026, as summarised by the Peter G. Peterson Foundation, “National debt projected to hit 175% of GDP; interest totals $99 trillion”, 20 March 2026.
- Congressional Budget Office, “Effects on Deficits and the Debt of Public Law 119-21 and of Making Certain Tax Policies in the Act Permanent”, 4 August 2025.
- Congressional Budget Office (P. Swagel), “An Update About CBO’s Projections of the Budgetary Effects of Tariffs”, 5 March 2026.
- EconoFact, “Did interest payments on the federal debt represent a record share of revenue in FY2025?”, June 2026.
- Federal Reserve Board, FOMC statement, 16 September 2026.
- FRED, Federal Reserve Bank of St. Louis: FYOIGDA188S, FYFRGDA188S, FYONGDA188S, FYPUGDA188S (OMB Historical Tables); DGS2, DGS10, DGS30, T10YIE, DFII10, THREEFYTP10 (weekly averages to mid-October 2026); IRLTLT01USM156N and IR3TIB01USM156N (OECD monthly rates); FEDFUNDS; CPIAUCSL; DCOILBRENTEU.
- Government Accountability Office, “Federal Debt Management: Treasury Is Meeting Borrowing Needs but the Deteriorating Fiscal Outlook Poses Risks”, GAO-26-107529, March 2026.
- Haver Analytics, “Interest on the Public Debt Is a Metastasizing Budgetary Cancer”, 18 October 2026.
- International Monetary Fund, World Economic Outlook and Fiscal Monitor databases, October 2026 (GGXCNL_NGDP, GGXONLB_G01_GDP_PT, GGR_G01_GDP_PT, GGXWDG_NGDP, NGDPD), and Public Finances in Modern History (interest expense).
- ISTAT, “PIL e indebitamento AP, anni 2023 to 2025”, 2 March 2026.
- Japan Ministry of Finance, JGB Investor Presentation, August 2026.
- Joint Economic Committee (Republicans), Monthly Debt Update, 7 October 2026.
- Mortgage News Daily, 10-year Treasury yield, daily closes to 21 October 2026.
- National Taxpayers Union, “Projecting the Debt Limit”, 20 August 2026.
- U.S. Department of the Treasury, “Minutes of the Meeting of the Treasury Borrowing Advisory Committee, August 4, 2026”; “Treasury Presentation to TBAC”, Q3 2026; “Treasury Announces Marketable Borrowing Estimates”, 3 August 2026.
- Global Strategy Files, Decoded No. 1, “Five Bond Markets, One Shock”, October 2026; Foresight No. 1, “The Ageing Bill”, October 2026.
Books from Global Strategy Files
Go further on this topic