China Idle Capacity and Shortage Insurance


Driss EFFINA, PhD Independent Researcher, Global Strategy Files Decoded, China series, 24 October 2026.
A plant can sit inside design capacity yet require upgrades, reliable gas and time before it supplies a usable tonne. This preview gives the public evidence boundary and the complete physical, probability, information and real-cost assumptions before reporting conditional results. It does not estimate a national Chinese reserve, an observed foreign causal response or a calibrated welfare return.
Design slack is not a ready insurance option
Design-capacity slack does not measure technically operable shortage insurance. The public pilot does not establish that an identified pre-existing Chinese reserve supplied additional urea to named foreign customers during the selected disruption and covered its real annual costs. It does establish why that inference is difficult: a suspended plant needed upgrades and reliable gas, one unchanged output observation acquired two utilization ratios, and rising international sales exceeded additional production. These are positive measurement findings, rather than evidence that every form of Chinese production flexibility has zero value. (BlueChemical 2021) (BlueChemical 2022) (BlueChemical 2023) (BlueChemical 2025)
The product is fertilizer urea in physical metric tonnes, with 46% nitrogen as its definition. Grade, engineering readiness, feedstock, permissions and delivery dates still constrain eligibility. The Chinese case is China BlueChemical, not a national plant census. The stable operating comparison follows Fudao I, Fudao II and Huahe in 2019-2025, separately from the changing consolidated group and suspended or disposed Tianye assets. Selected older observations remain useful context without filling missing years or manufacturing a continuous national reserve series. (BlueChemical 2020) (BlueChemical 2023) (BlueChemical 2025)
Unchanged output can acquire a new utilization ratio
The same FY 2022 group output, 1,962,091 tonnes, appears in two report vintages. The original 2022 report assigns it 83.1% utilization; the 2023 report’s prior-year comparator assigns it 106.6%. The difference is exactly 23.5 percentage points, with no change in the underlying output. Figure 3 is therefore a reporting-perimeter counterexample to interpreting a higher utilization ratio as physical activation. It does not describe a new surge of 2022 production discovered a year later. (BlueChemical 2022) (BlueChemical 2023)
Profile design capacity changes from 2.36 million to 1.84 million tonnes per year around Tianye’s disposal, which the issuer reports as completed in 2023. The comparison links the ratio change to a changing reported denominator and group perimeter. It does not use rounded ratios to reverse-engineer a new precise engineering capacity. Both the original observation and the later comparator are retained, so a reader can see which statement belongs to which report. The stable named-plant window remains separate from this group-level reconciliation. (BlueChemical 2022) (BlueChemical 2023)

Complete scenario setup before the results
The experiment is an 84-day physical stock-flow model, measured in metric tonnes, days and illustrative constant USD. Before a possible annual event, the planner selects reserve capacity C from 0, 100, 250 or 500 tonnes per day, and initial eligible China inventory I from 0, 2,000 or 5,000 tonnes. These twelve policies include passive C=I=0. None is assigned to Tianye, the stable plants, CF or a national reserve. C is a candidate engineering bound requiring validation, rather than annual design capacity less production.
The assumed annual probability of one event is p=0.10. Conditional on an event, the states are 35% short/open, 35% medium/open, 15% long/open, 10% joint-energy and 5% blocked. The foreign disruption lasts 14, 28, 56, 56 and 56 days respectively. There is no overlapping-event or stationary renewal model. The no-event year still incurs carrying costs. Probability sensitivity later changes the chance of using the option, not the physical loss valuation or the observed frequency of Chinese disruptions.
Normal base output and committed donor demand are each 500 tonnes daily. The foreign replacement shortfall is 500 tonnes daily during the disruption, with an initial 1,000-tonne foreign buffer identical across policies. There is no pre-event China shipment pipeline. Normal startup is seven days with a three-day ramp; transit is fourteen days and departure capacity is 1,000 tonnes daily. Operability, eligible grade and feedstock shares are initially one. Every one of those quantities is an assumption, not a source-derived estimate.
Joint-energy conditions lengthen startup to fourteen days and transit to twenty-one, delay permission to day seven, and reduce reserve feedstock to 0.4 and base production to 0.8 during the disruption. Blocked exports prohibit departures. Recourse observes the complete scenario duration and permission path, an optimistic information assumption that can permit delayed or declined startup. The model holds the foreign outage fixed across policies: Chinese shipments do not repair the foreign plant. Its service outcomes are cumulative unmet tonnes, with daily timing treated cautiously because alternate optimal dispatches can tie.
Table 5. Conditional event states, all assumed
| State / weight | Foreign duration | Departure and production conditions |
|---|---|---|
| Short open / 0.35 | 14 days | Normal startup 7/transit 14; open |
| Medium open / 0.35 | 28 days | Same normal conditions |
| Long open / 0.15 | 56 days | Same normal conditions |
| Joint energy / 0.10 | 56 days | Startup 14/transit 21/permission 7; reserve feedstock 0.4/base 0.8 |
| Blocked / 0.05 | 56 days | No export departures; donor base adequate |
Weights conditional on one event sum to one; annual event probability is assumed 0.10. Horizon 84 days. Capacity grid 0/100/250/500 t/day; stock grid 0/2000/5000 t. No issuer calibration.
Daily stocks, startup and arrivals constrain service
For each day t from 0 through 83, the China balance is closing stock = opening stock + base output + additional output – departures – donor demand + donor unmet. Initial China stock is I. The foreign balance is closing stock = opening stock + arrivals – foreign shortfall + foreign unmet, starting with the common 1,000-tonne buffer. Arrivals are departures from fourteen days earlier in normal states; before transit elapses they are zero. Separate donor and foreign unmet variables are nonnegative and bounded by the applicable daily demand.
Additional production is bounded by activated capacity, operable fraction, grade eligibility, feedstock and the startup ramp. With startup seven days, the first increment can be produced on day seven, using zero-based dates, and arrive on day twenty-one under fourteen-day transit. A fourteen-day foreign shortage cannot benefit from that new output even when exports are open. Existing inventory can leave earlier, which is why the same initial I must be held fixed when testing reserve’s marginal contribution. Counting departures as new output would erase that distinction.
The model forbids departures that would arrive after the 84-day horizon, requires terminal foreign stock to be zero, and bounds terminal China stock between zero and its initial I. These boundary conditions prevent terminal salvage arbitrage and remove shortage credit for shipments arriving after useful demand has ended. China can meet donor commitments, draw initial stock, make incremental product or leave demand unmet, but every tonne must reconcile through the physical equations. A donor shortfall is not hidden inside the export variable.
Real annual and event costs are explicit
Annual candidate-capacity carry is assumed USD 1,200 per tonne/day per year: maintenance 350, capital opportunity 600, readiness 150 and routine environmental cost 100. Inventory carry is USD 30 per tonne per year: storage 12, capital opportunity 15 and spoilage 3. These are illustrative real resource and opportunity costs, not Chinese estimates or conversions from RMB accounts. A reserve that is never activated still incurs its assumed carrying bill. The sensitivity range later permits lower carrying costs, including a zero multiplier.
During an event, each extra tonne costs USD 260 in resources: 220 for production and 40 in incremental environmental damage. Shipping costs 70 per tonne. Depleting initial China inventory incurs a 250-per-tonne replacement resource charge, separate from its annual carrying cost. Starting an active reserve costs 12,000 plus 40 times daily candidate capacity; no start cost is charged when activation is declined. Baseline donor and foreign shortage losses are both USD 1,500 per unmet tonne, a social scarcity valuation assumption rather than an observed fertilizer price, crop-loss estimate or producer margin.
For a policy, annual cost equals capacity carry plus inventory carry plus p times the probability-weighted event cost. Event cost includes additional production, shipping, inventory depletion, startup and both customers’ unmet demand. A subsidy, tax or contractual purchase payment is a transfer unless it purchases a separately counted real resource; it is not added again as social loss. Capital opportunity cost must not duplicate sunk investment, depreciation or another charge for the same alternative use. Actual cost accounting would have to reconcile the routine and incremental environmental components before calibration.
These boundaries matter for interpretation. Avoided shortage loss is not producer profit, and a positive event saving need not cover annual readiness. A policy can also benefit donor customers during a joint-energy event; that contribution must not be relabeled foreign insurance. The model will report foreign relief, donor relief and extra real resources separately, then show a foreign-only calculation with an explicit joint-cost convention. Neither valuation is identified from the financial inventory account, the impairment charge or CF’s aggregate purchase and sale receipts.
A favorable long event is not the baseline average
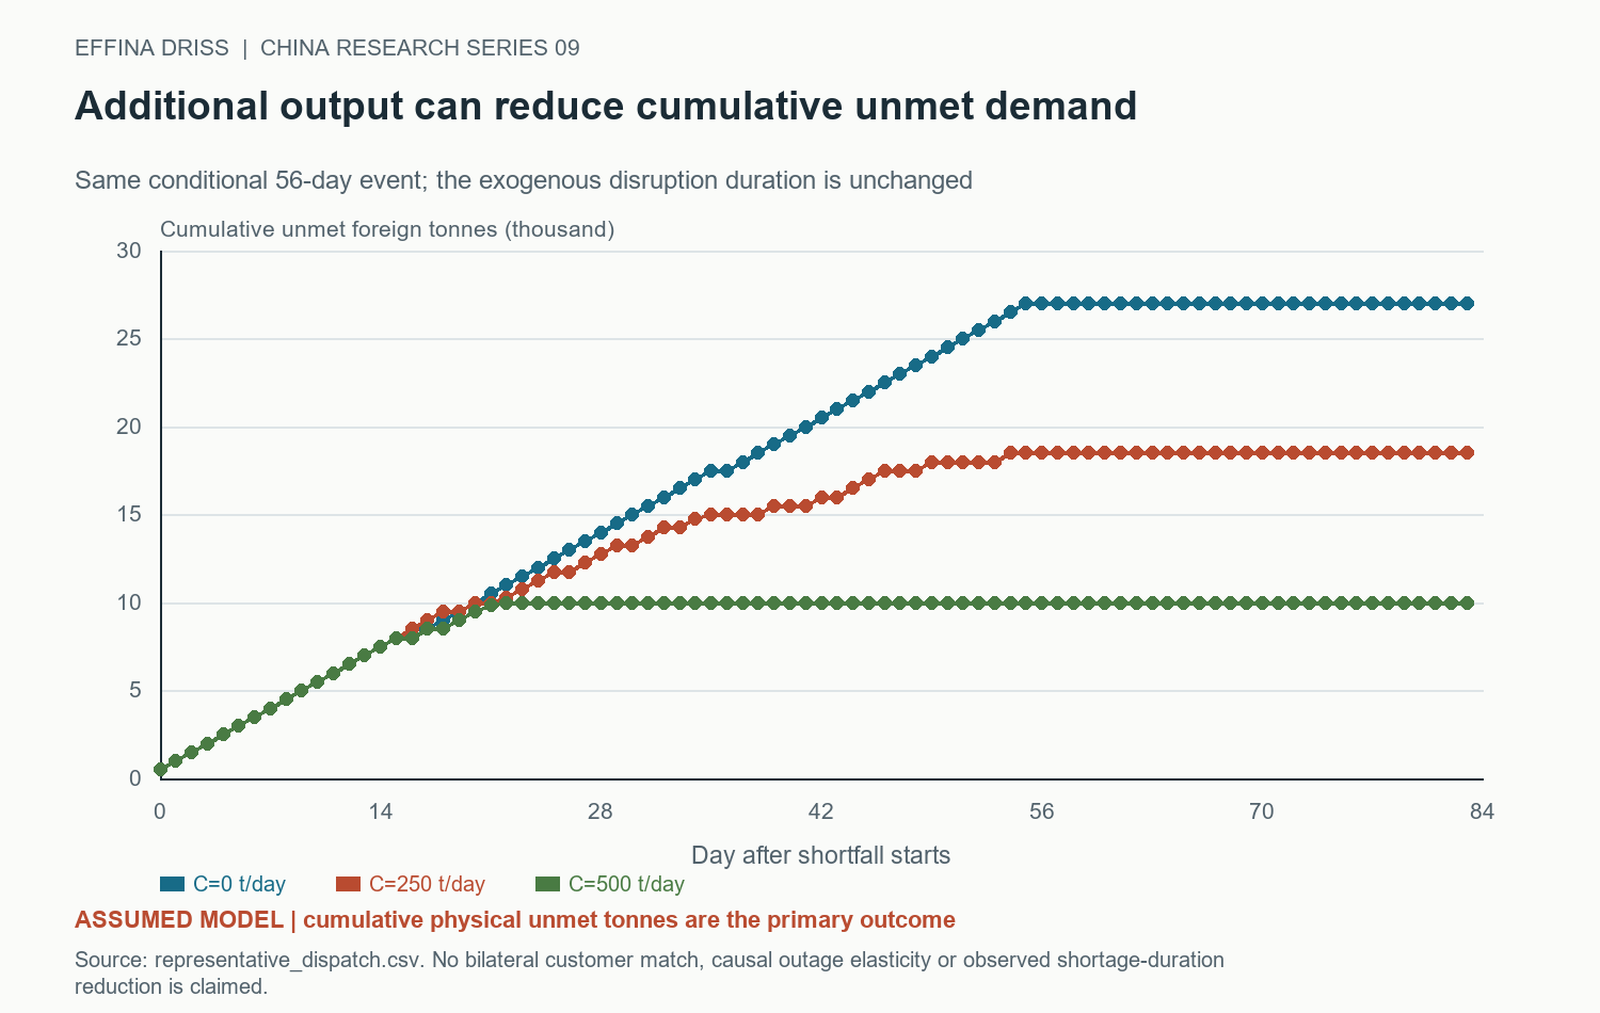
In the same 56-day open scenario, C=250 tonnes/day, I=0 reduces cumulative foreign unmet demand from 27,000 to 18,500 tonnes. Additional production is 8,500 tonnes. Figure 9 traces cumulative shortfall without treating departures, initial stock or donor displacement as new product. These are conditional physical results under the disclosed model, not an observed Chinese response to a foreign disruption and not the expected outcome across the five-state baseline mixture.
The break-even probability is global
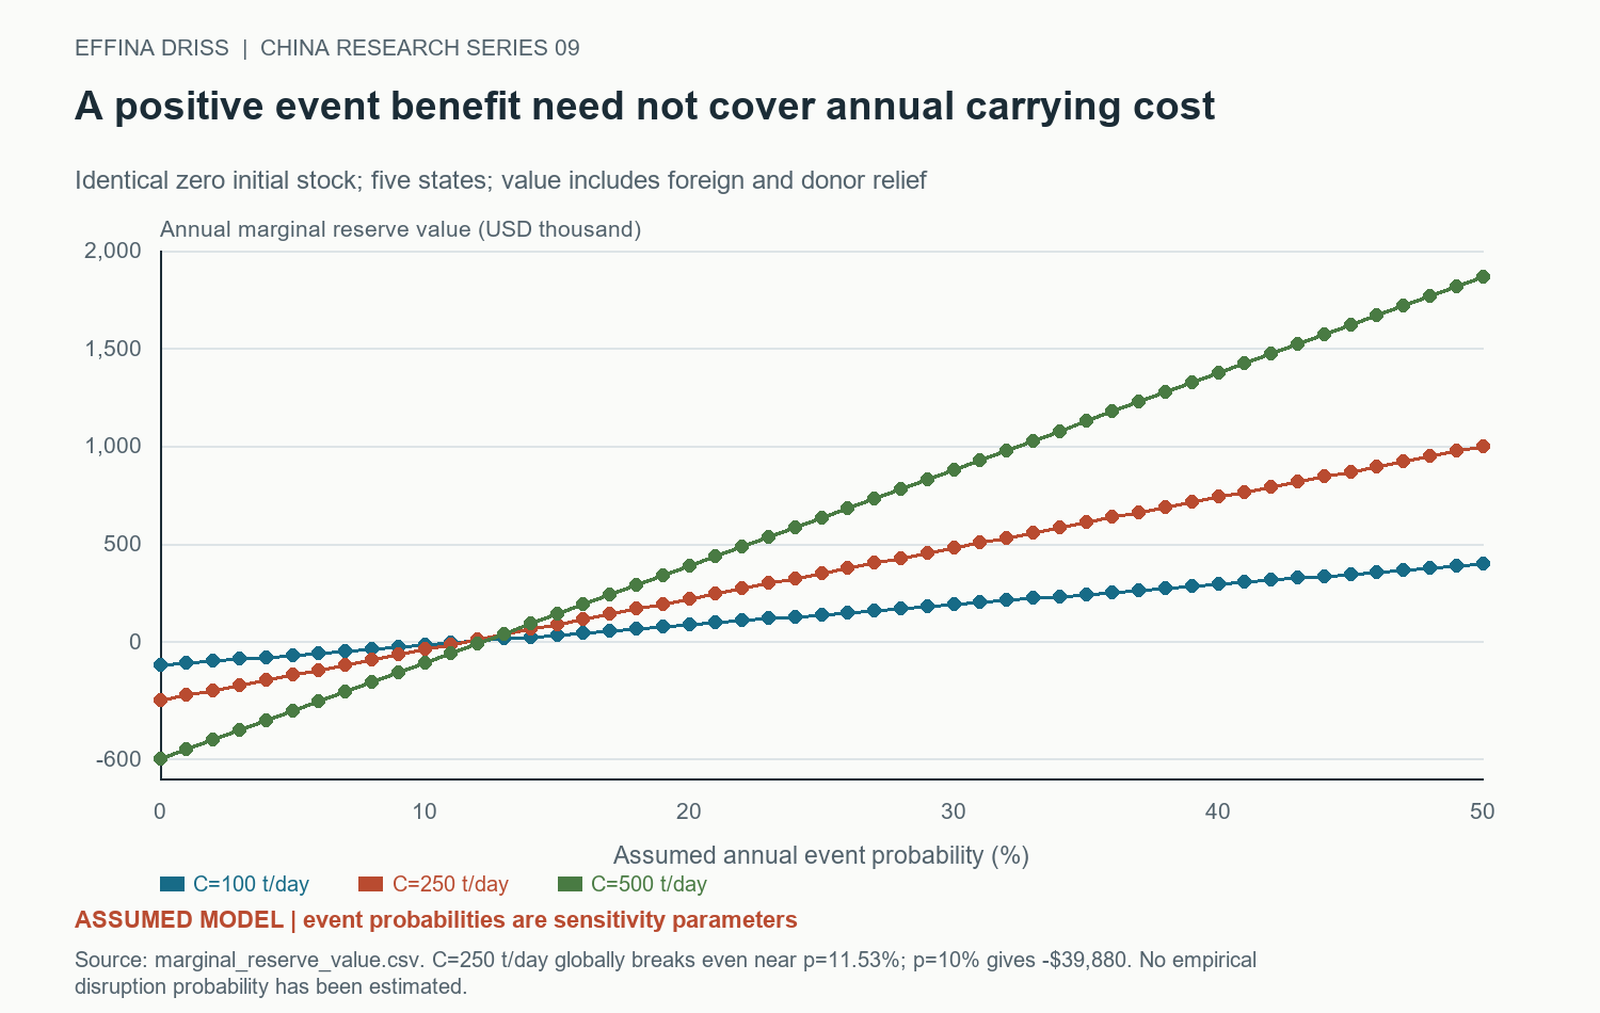
For C=250, I=0, expected conditional global event saving is USD 2,601,200 relative to the same zero-inventory baseline. Annual real capacity carry is USD 300,000. At assumed event probability p=0.10, annual net is therefore minus USD 39,880: 0.10 times the event saving, less carry. Figure 12 varies the probability rather than estimating one from the historical reports. The global break-even annual probability is 0.115331, or about 11.53%.
Foreign relief, donor relief and extra resources
For C=250, I=0, the five-state conditional expectation reduces foreign unmet demand by 1,800 tonnes and donor unmet by 410 tonnes. At the assumed common USD 1,500 shortage loss, those are USD 2.700 million foreign relief and USD 0.615 million donor relief. Extra real resources are USD 0.7138 million. Figure 16 displays the three components separately, yielding USD 2.6012 million global event saving. None is an observed Chinese delivery or a market-price valuation.
At p=0.10, global annual net is minus USD 39,880, after USD 300,000 of capacity carry. Crediting only foreign relief and charging it all incremental resources and carry instead gives minus USD 101,380. This is an explicit allocation of joint costs to the foreign-only calculation, not an estimate that foreign customers should economically bear every dollar. The difference between the two annual values is the probability-weighted donor relief, USD 61,500. Hiding that term would overstate what the global calculation establishes about foreign insurance.
The decomposition also prevents the break-even threshold from changing meaning. p=0.115331 is the global threshold, based on both customer groups’ relief. It is not a foreign-only threshold. A different allocation of joint costs or relative shortage valuations could produce another buyer-focused result, but would require a separately declared objective. The present evidence does not identify those social weights, customer losses or real costs. The threshold calculation is useful because its incidence and accounting are exposed, including its negative baseline sign; it is not a calibrated welfare forecast or a national reserve value.

Inventory and reserve increments have different comparators
Marginal reserve value compares C greater than zero with C=0 at the same I. It equals annual probability times the expected event-cost reduction, minus capacity carry. Inventory costs cancel because both sides begin with the same eligible stock. This is a different question from whether a mixed policy beats passive C=I=0. Giving a reserve credit for the inventory already present would produce an inflated value for capacity even when the reserve adds less event saving than its annual cost.
At I=5,000 tonnes, C=250 has annual value USD 165,170 against passive, but inventory alone yields USD 207,500. The reserve increment is therefore minus USD 42,330. At I=2,000, the same reserve’s mixed value is USD 42,770, compared with USD 83,000 for inventory alone, leaving a minus USD 40,230 reserve increment. These positive mixed totals do not reverse the negative marginal-capacity conclusion. The mixed total and the same-inventory reserve increment answer different questions.
The mechanism has explicit zero cases
Four deliberate failures are exposed for the C=250 candidate: no operable capacity, exports blocked, delivery too late, and production resource cost dominating relief. Each yields zero additional production and zero event gain. Annual net remains minus USD 300,000, the real cost of carrying the unused option. These are constructed disconfirmations, not four historical findings about Chinese plants, trade rules or fertilizer events.
The late-delivery test combines a fourteen-day event with twenty-one-day transit. The cost-dominance test raises the production resource cost to USD 2,000 per tonne, making activation unattractive under the stated shortage valuation. Startup is a decision, so the engine can decline to incur an event cost that produces no useful benefit. Blocked exports in this test coexist with adequate donor base supply; the reserve cannot gain value by solving a separate domestic shortage that was not part of that zero case.
Continue reading
Get the complete 30-page research note
The English PDF contains 16 scientific figures, 11 tables, the stable plant comparison, Tianye negative case, exact export bridge, physical stock-flow equations, same-inventory policy comparisons and independently certified optimization. The model evaluates twelve policies; its scenario information is optimistic and no off-grid optimum is claimed.
29 USD, instant PDF download, secure card payment.
Buy the full noteOne-time PDF-only purchase. Evidence cutoff: 24 October 2026. All model parameters are assumed; private third-party originals are excluded from reader materials. No raw paid PDF link is exposed here.
Need this analysis for your organisation?
We prepare confidential briefings, executive talks and studies on countries, markets and policies, built on the same method as this article.
Request a briefingSupport independent analysis
Our studies are free to read and carry no advertising. If this one was useful, a small contribution helps us publish the next.
Support our workGo further: books by Global Strategy Files

Books from Global Strategy Files
Go further on this topic
The Tariff GambleHow America’s trade war is reshaping power, prices and prosperity.24.99 USD, see the book Future-Proofing AmericaEconomic challenges and the road to reform.20 USD, see the book
 Kill KennedyWhat the 2025 declassified files reveal about the machinery of American power.20 USD, see the book