
A Multi-Speed French Industry in 2026: Why Do Some Sectors Hold Up Better Than Others?

A Multi-Speed French Industry in 2026: Why Do Some Sectors Hold Up Better Than Others?
Driss EFFINA, PhD Independent Researcher, Global Strategy Files Reading time: about 31 minutes
Key takeaways
- Manufacturing value added represents about 10 percent of French GDP, against 22 percent in 1970 and 14.5 percent in 2000.
- Manufacturing output was 1.2 percent lower than a year earlier in the three months to August 2026, with cars causing about 42 percent of the fall.
- In the first half of 2025, 82 French factories closed and 44 opened, reversing the positive balance of 2017 to 2024.
- France's bilateral goods deficit with China grew from about 30 to about 50 billion euros since 2019.
Abstract
French industry in 2026 moves at several speeds. In its monthly business survey published on 12 October 2026, the Banque de France describes aeronautics as very dynamic with particularly full order books and a favourable cash position, while chemicals, rubber, plastics and glass, and wood and paper report very weak order books, tense cash positions and margins squeezed by a sharp rise in input costs. This article asks why some sectors hold up better than others, and what this means for the French reindustrialisation strategy. It relies on data from the Banque de France survey, INSEE (industrial production, quarterly accounts and business outlook), Airbus, the French customs, the State’s industrial barometer and France Industrie, and on calculations by the author: a scorecard of ten branches coded from the survey, a decomposition of the recent fall in manufacturing output by branch, an analysis of the aerospace order book and of corporate margins, and a simulation of the share of manufacturing in GDP to 2040. The results show a clear divide. Over the three months to August 2026, manufacturing output was 1.2 percent lower than a year earlier; the automotive industry alone accounts for about 42 percent of the decline, followed by rubber and plastics, food, wood and paper and chemicals, while electronics, electrical equipment and pharmaceuticals grew and the index of other transport equipment, which includes aerospace, stood at 134, the highest of all branches. Airbus delivered 547 aircraft between January and September 2026, 7.9 percent more than a year earlier, and its backlog of 9,310 aircraft represents about 11.7 years of production at the 2025 pace. Meanwhile, the margin rate of non-financial corporations fell from 32.5 percent of value added at the end of 2025 to 31.5 percent in the first half of 2026, mainly because of the deterioration of the terms of trade. The article concludes that the sectors that resist share four features: a global order book independent of the European cycle, a low energy intensity, strong pricing power and a technological lead, while the sectors in difficulty combine high energy costs, dependence on weak European demand and direct Chinese competition. Reindustrialisation will depend on whether the first group can grow fast enough to offset the second.
Keywords: France, industry, manufacturing, aerospace, Airbus, margins, Banque de France business survey, automotive industry, energy-intensive industries, reindustrialisation
JEL codes: L60, L52, O14, F14, E23
1. Introduction
France is one of the most deindustrialised large economies in Europe. Manufacturing, which accounted for more than a fifth of national value added in 1970, now accounts for about a tenth. Industrial regions in the north and east of the country lost hundreds of thousands of jobs in steel, textiles, mining and automotive manufacturing. The decline was faster in France than in Germany or Italy, and it left a lasting mark on the country’s trade balance, its regional geography and its politics.
From the mid-2010s, the trend seemed to change. A series of measures to reduce production costs, including the reduction of social contributions and of production taxes, the transformation of the competitiveness tax credit into a permanent cut in charges, and a more favourable tax treatment of investment, coincided with a period in which factory openings exceeded closures. The pandemic and the war in Ukraine added a new motivation: sovereignty in strategic supplies such as medicines, semiconductors, batteries and energy. The France 2030 plan, announced in October 2021 with a budget of 54 billion euros, aimed to finance new industrial sectors, from small nuclear reactors to green hydrogen and electric vehicles.
By 2026, the results are mixed and the momentum has faded. But the aggregate figures hide a striking divergence between sectors. Aeronautics works at full stretch, limited only by shortages of engines and equipment. Electrical equipment and electronics benefit from the investment boom in data centres and defence. At the same time, the automotive industry is in deep difficulty, and chemical and energy-intensive industries face high costs, weak demand and margins squeezed by the rise in energy and raw material prices linked to the conflict in the Middle East. The question asked in this article is therefore: why do some sectors hold up better than others, and what does this multi-speed industry mean for the prospects of French reindustrialisation?
To answer it, the article builds a set of indicators from official sources and carries out its own calculations: a scorecard of ten branches coded from the Banque de France business survey of early October 2026, a decomposition of the recent fall in manufacturing output by branch, an analysis of the aerospace order book and of the margins of firms, an analysis of the trade balance, an assessment of the factory barometer and a simulation of the time needed to raise the share of manufacturing in GDP.
Section 2 presents the context. Section 3 reviews the literature. Section 4 presents the data and methods. Section 5 presents the results. Section 6 discusses them. Section 7 presents scenarios. Section 8 concludes.
2. Context
2.1 Fifty years of decline
According to France Industrie, the employers’ federation of large industrial firms, manufacturing accounted for about 22 percent of French GDP in 1970, 14.5 percent in 2000 and about 10 percent from the mid-2010s onward. In terms of employment, manufacturing lost more than two million jobs between the mid-1970s and the mid-2010s. In 2025, it employed 2,838,000 salaried workers.
The causes of this decline have been widely studied. Part of it is common to all advanced economies: productivity gains in manufacturing are faster than in services, so that, at constant demand, manufacturing’s share of employment and of nominal value added declines. Part of it reflects international competition, first from southern Europe and then from Asia, especially China after its entry into the World Trade Organization in 2001. And part of it is specific to France: a high level of taxes on production, labour costs that rose faster than productivity in the 2000s, a less developed network of medium-sized firms than in Germany or Italy, and a strategy of large French firms that favoured production abroad.
2.2 The turn of the 2010s
The Gallois report of 2012 on the competitiveness of French industry marked a turning point in the diagnosis. It recommended a large reduction in labour costs, which led to the competitiveness and employment tax credit (CICE), later transformed into a permanent reduction of employer contributions. Subsequent governments reduced corporate tax from 33.3 percent to 25 percent and reduced taxes on production, notably by halving the business property tax and phasing out the value added contribution of companies.
Between 2017 and 2024, according to the State’s industrial barometer, openings and extensions of industrial sites exceeded closures and reductions every year. France Industrie estimates that manufacturing created about 80,000 net salaried jobs between 2016 and 2024. Since 2019, manufacturing value added in volume has grown by 8 percent, slightly faster than GDP (6.3 percent), largely thanks to transport equipment and in particular aerospace.
2.3 The France 2030 plan and industrial policy
The France 2030 plan, presented in October 2021, committed 54 billion euros over five years to finance innovation and industrial projects in ten strategic areas, including small modular nuclear reactors, green hydrogen, decarbonisation of industry, electric and hybrid vehicles, low-carbon aircraft, health products, semiconductors and space. At the European level, the Net-Zero Industry Act, the European Chips Act and the Critical Raw Materials Act provided additional frameworks. The 2027 budget bill extends the green industry investment tax credit to electricity grids, solar heat, electric vehicle batteries and permanent magnets, and introduces a temporary exceptional deduction for investments in robotics, 3D printing and generative artificial intelligence.
2.4 The shocks of 2022 to 2026
Three shocks have weighed on French industry since 2022. The first was the energy shock that followed the Russian invasion of Ukraine, which raised electricity and gas prices to unprecedented levels and hit energy-intensive industries. The second was the slowdown of European demand, especially in the automotive sector, combined with the transition to electric vehicles and the arrival of Chinese competitors. The third, in 2026, was the conflict in the Middle East, which raised energy prices again and weakened growth.
3. Literature review
The literature relevant to French industry can be organised around four questions.
The first is why manufacturing declines in advanced economies. The structural change literature explains the decline of manufacturing employment by faster productivity growth in manufacturing and by the shift of demand toward services as incomes rise. Rodrik (2016) documented a phenomenon of “premature deindustrialisation”, in which developing countries reach their peak of manufacturing employment at lower levels of income than earlier industrialisers, linked to globalisation and labour-saving technology.
The second question concerns the effect of competition from China. Autor, Dorn and Hanson (2013) showed that the rise in Chinese imports after 2001 caused large and lasting losses of manufacturing employment in the most exposed local labour markets in the United States. Similar effects have been documented for European countries. The rise of Chinese exports of electric vehicles, batteries, solar panels and other green technologies since 2022 has revived this debate in Europe, sometimes described as a “second China shock”.
The third question concerns industrial policy. After decades of scepticism, the economic literature has become more open to industrial policy. Juhász, Lane and Rodrik (2024) reviewed the “new economics of industrial policy” and argued that well-designed policies targeting specific sectors can be effective, provided they are disciplined by clear objectives and evaluation. The Draghi report on the future of European competitiveness (2024) called for a large increase in investment, a more integrated capital market and a coordinated industrial strategy to close the productivity and innovation gap with the United States and China.
The fourth question concerns the specific weaknesses of French industry. The Gallois report (2012) emphasised labour costs and the lack of positioning on high-end products. More recent work by the Banque de France (2026) analysed why European and French manufacturing has not returned to its pre-pandemic trend. It found that French manufacturing value added was about 8 percent below its 2015 to 2019 trend at the end of 2025, a gap similar to the euro area average but larger than in Spain, and that the gap was concentrated in the automotive industry, food and energy-intensive sectors.
4. Data and methodology
4.1 Data
- Long-term structure: France Industrie, Portrait de l’industrie manufacturière 2025 (July 2026), based on INSEE and Eurostat national accounts.
- Gap to trend: Banque de France Bulletin 263/2 (April 2026).
- Recent production: INSEE industrial production index (IPI), August 2026, seasonally and working day adjusted, base 100 in 2021, including branch weights and three-month growth rates.
- Trade: French customs (DGDDI) annual results, and France Industrie estimates of bilateral balances.
- Business survey: Banque de France monthly business survey, early October 2026 (published 12 October 2026; about 8,500 firms interviewed between 27 September and 5 October).
- Margins: INSEE quarterly accounts (28 August 2026) and INSEE Note de conjoncture (10 September 2026).
- Aerospace: Airbus monthly orders and deliveries, September 2026 and September 2025.
- Factory openings and closures: State industrial barometer published by the Directorate General for Enterprise (DGE), and Trendeo data reported by France Industrie.
4.2 Methods
1. Survey scorecard. The author codes the qualitative statements of the Banque de France survey for ten branches along six dimensions (activity in September, outlook for October, order books, cash position, input costs and margins, supply constraints): +1 for a favourable statement, 0 for a neutral or mixed one, -1 for an unfavourable one, and “not reported” when the survey text does not mention the branch on that dimension. The sum of the scores gives a simple index of resilience. This coding is a reading of a qualitative text and involves judgement. 2. Decomposition of the change in manufacturing output. The author computes the contribution of each branch to the year-on-year change in manufacturing output over the three months from June to August 2026. The contribution of a branch is its weight in manufacturing (from the INSEE weights, out of a total of 7,529 per 10,000 for manufacturing) multiplied by its growth rate. The sum of contributions is compared with the official change in the manufacturing index. Small differences arise because the weights refer to the base year and not to the current structure of output. 3. Aerospace order book. Deliveries of Airbus commercial aircraft over the first nine months of 2025 and 2026, the full-year target, the backlog expressed in years of production, and the ratio of net orders to deliveries (book-to-bill). 4. Trade balance analysis. Annual goods balances from 2019 to 2025, and the evolution of bilateral balances with China and the euro area. 5. Factory barometer. Comparison of openings and closures by half-year, and of net balances including extensions and reductions. 6. Share simulation. The author simulates the share of manufacturing in GDP to 2040, starting from about 10 percent in 2025, under three assumptions about the difference between the growth of manufacturing value added and GDP: zero, one point and two points per year. The simulation assumes constant relative prices, which is a simplification since manufacturing prices tend to fall relative to services.
4.3 Limitations
The survey provides qualitative assessments, not measured margins by branch: INSEE does not publish recent margin rates by industrial branch, so the analysis of margins combines the survey with the aggregate margin rate of non-financial corporations. Some figures are rounded values taken from secondary syntheses. The decomposition uses base-year weights. The bilateral trade balances are orders of magnitude. The simulation is mechanical and does not model the causes of growth.
5. Results
5.1 The size of French industry
Figure 1 shows the long-term decline of the share of manufacturing in GDP and compares manufacturing value added per inhabitant in France, the euro area and Germany.
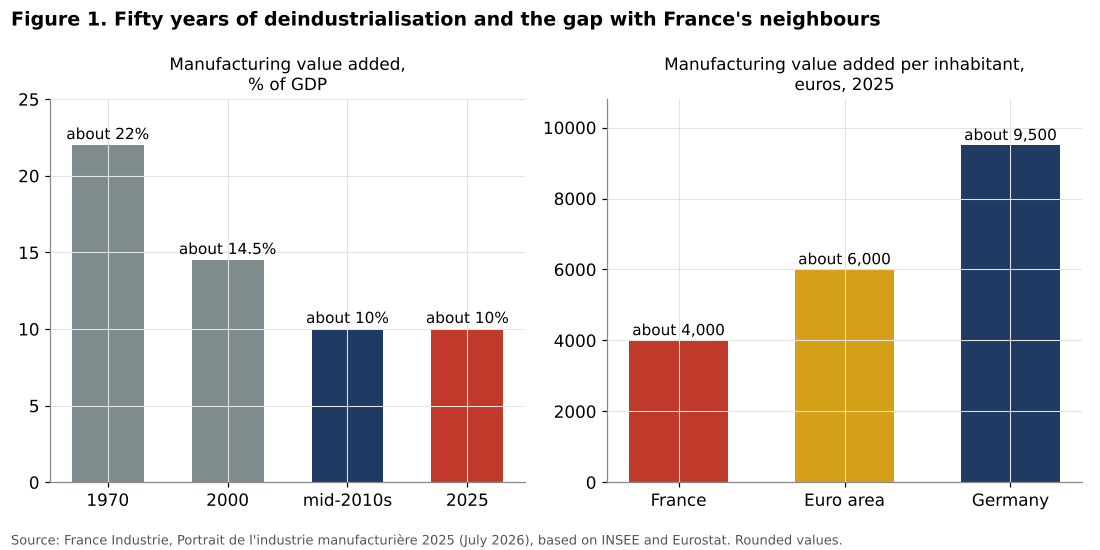
The share of manufacturing in French GDP fell from about 22 percent in 1970 to 14.5 percent in 2000 and about 10 percent in the mid-2010s, where it has remained since. In 2025, manufacturing produced goods worth 815 billion euros, with value added of about 300 billion euros, and invested about 65 billion euros. It employed 2,838,000 salaried workers, 13,000 fewer than in 2024.
The comparison with France’s neighbours is striking. Manufacturing value added per inhabitant is just over 4,000 euros in France, just over 6,000 euros in the euro area and close to 9,500 euros in Germany. In other words, to reach the euro area average, France would need to increase its manufacturing value added by about 50 percent, or about 140 billion euros at current prices. To reach the German level, it would need to more than double it.
These comparisons explain why reindustrialisation has become a political objective. A smaller industrial base means fewer exports, a structural trade deficit in goods, fewer well-paid jobs outside large cities, and less control over strategic supply chains.
5.2 A multi-speed industry: the Banque de France survey of October 2026
Figure 2 presents the author’s coding of the Banque de France monthly business survey published on 12 October 2026, for nine industrial branches and, for comparison, construction.
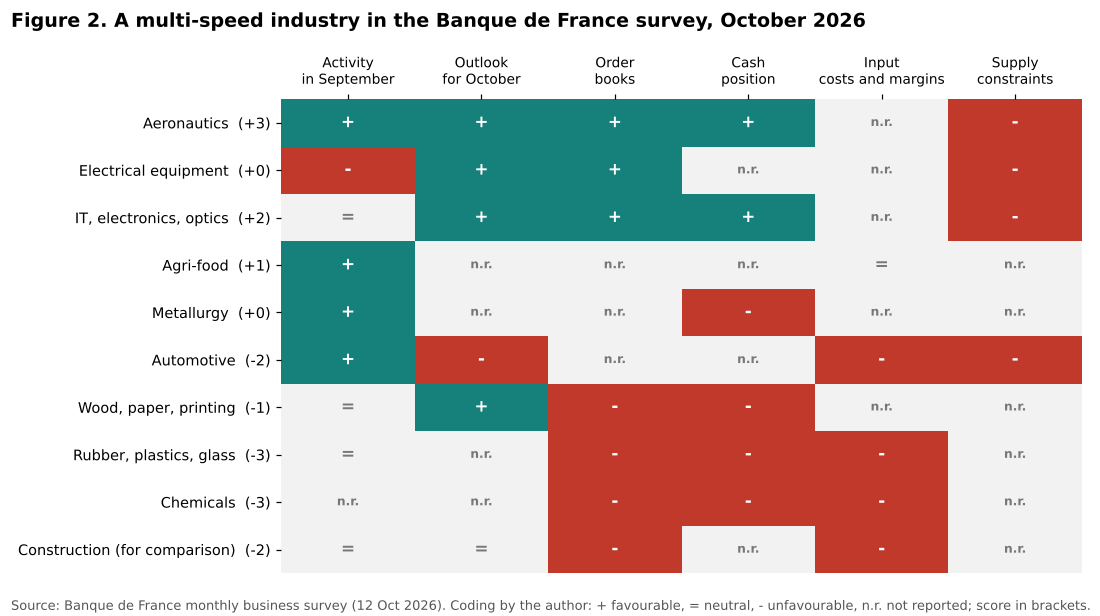
At the aggregate level, the survey describes an industry that is still growing slowly. Industrial production rose in September, but more slowly than its long-term trend and clearly less than firms expected; the balance of opinion on activity was +3 points, and firms expect a slight acceleration in October (+4). The capacity utilisation rate rose to 76.8 percent in September from 76.4 percent in August. Input prices rose sharply and across sectors, driven by energy, fuels, metals and packaging, while selling prices rose much more moderately: 13 percent of industrial firms raised their prices in September, against a historical average of 10 percent for that month. The uncertainty indicator rose clearly in September, ending a decline that had started in March, with fuel prices as the main concern. The Banque de France estimates that GDP grew by only about 0.1 percent in the third quarter, with value added falling in manufacturing and construction.
Behind these averages, the scorecard shows three groups of branches.
The first group is made up of the branches that hold up well: aeronautics (score +3), IT, electronics and optics (+2) and, despite a fall in output in September, electrical equipment (+0, with a strong rebound expected). Aeronautics is described as very dynamic, with particularly full order books, a capacity utilisation rate that rebounded sharply and a favourable cash position. Electrical equipment has full order books supported by data centres. Electronics expects to strengthen. The only negative signal for this group is supply: about 20 percent of aeronautics firms report supply difficulties, linked to shortages of engines and equipment, against 11 percent for industry as a whole. In other words, these branches are constrained by supply, not by demand.
The second group is made up of the branches in a fragile position: agri-food, metallurgy and the automotive industry. Their activity rose in September, but the automotive industry expects a sharp fall in October because of temporary plant stoppages caused by supply shortages, and reports one of the strongest increases in input costs. Metallurgy reports a tense cash position.
The third group is made up of the branches in difficulty: chemicals (-3), rubber, plastics and glass (-3) and wood, paper and printing (-1). Their order books are very weak, their cash positions are tense, and in chemicals and in rubber, plastics and glass the partial pass-through of input costs to selling prices is squeezing margins. Construction, shown for comparison, is in a similar position, with thin order books and margins weighed down by costs.
This divide is not new, but the energy shock of 2026 has sharpened it. The branches that resist are those whose demand is global and long-term and whose costs depend little on energy. The branches in difficulty are those that consume a lot of energy and sell mainly to European industrial customers, notably in construction and the automotive industry.
5.3 The gap with the pre-pandemic trend
According to the Banque de France, manufacturing value added remained well below its 2015 to 2019 trend at the end of 2025.
In France, manufacturing value added was about 8 percent below its pre-pandemic trend at the end of 2025, the same as the euro area average. The gap is smaller than in Italy (10 percent) and much smaller than in Germany (17 percent), but larger than in Spain (3 percent). Excluding Ireland, whose figures are affected by the activities of multinational firms, the euro area gap reaches 11 percent.
In the fourth quarter of 2025, French manufacturing value added was back at its 2019 level, but no higher. Over six years, it had therefore made up for the pandemic shock without returning to its previous growth path. The Banque de France also notes that manufacturing employment rose by 2.3 percent between 2019 and 2025 while value added rose by 1.1 percent, which means that apparent labour productivity fell by about 1 percent. In the third quarter of 2025, manufacturing productivity was 11 percent below its pre-pandemic trend.
The Banque de France decomposes the French gap by sector. Transport equipment is about 19 percent below trend and contributes about 3.1 points to the gap; within it, the automotive industry is about 29 percent below trend. Agri-food is about 15 percent below trend and contributes 2.6 points. Other industrial products, which include chemicals, metallurgy, rubber and plastics, contribute 4.1 points. Capital goods are close to their trend.
| Sector | Approximate gap to trend | Contribution to the French gap (pp) |
|---|---|---|
| Transport equipment | -19% | -3.1 |
| of which automotive | about -29% | n.a. |
| Agri-food | about -15% | -2.6 |
| Other industrial products | about -8% | -4.1 |
| Capital goods | close to trend | -0.3 |
Table 1. Sectoral contributions to the gap between French manufacturing value added and its pre-pandemic trend, end of 2025. Source: Banque de France (2026).
5.4 The 2026 decline: a decomposition by branch
Figure 3 shows the author’s decomposition of the change in manufacturing output between June to August 2025 and June to August 2026.
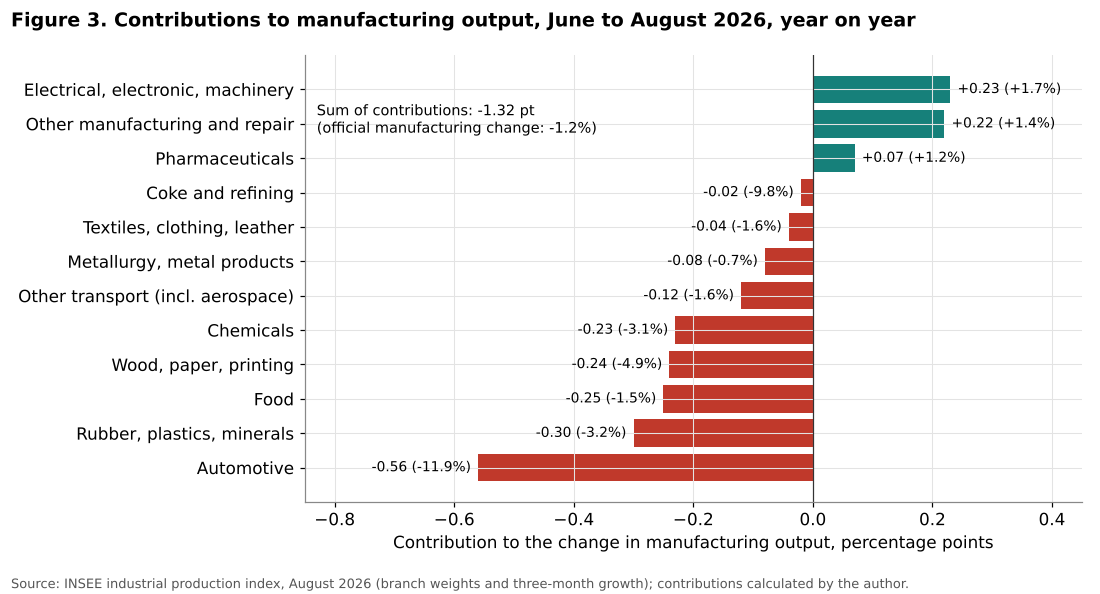
According to INSEE, manufacturing output over the three months to August 2026 was 1.2 percent lower than a year earlier, while total industrial output, including energy, was stable (-0.1 percent), supported by electricity production. The author’s decomposition gives a sum of contributions of -1.32 points, close to the official figure.
The automotive industry is by far the largest contributor to the decline. Its output fell by 11.9 percent year on year, and, with a weight of 354 out of 7,529 in manufacturing, it subtracts 0.56 points from manufacturing growth, or about 42 percent of the total decline. The automotive index stood at 91.6 in August 2026 (base 100 in 2021), and its output fell by 3.4 percent in August alone.
The next largest negative contributions come from rubber, plastics and non-metallic minerals (-0.30 points, with output down 3.2 percent), food industries (-0.25 points, -1.5 percent), wood, paper and printing (-0.24 points, -4.9 percent) and chemicals (-0.23 points, -3.1 percent). These branches share two characteristics: they are energy-intensive, and they depend largely on European demand, notably from the construction and automotive sectors, which are both weak.
On the positive side, three branches contribute to growth: electrical, electronic and computer equipment and machinery (+0.23 points, with output up 1.7 percent, driven by computer and electronic products, +5.5 percent, and electrical equipment, +3.0 percent), other manufacturing and repair (+0.22 points, +1.4 percent), and pharmaceuticals (+0.07 points, +1.2 percent).
The aerospace industry, included in other transport equipment, fell slightly (-1.6 percent), but remains at a high level: the index for other transport equipment stood at 134.0 in August 2026, the highest of all branches, reflecting the recovery of aircraft production since 2023.
This decomposition shows that the decline of 2026 is not general. It is concentrated in the automotive industry and in energy-intensive branches, while technology and defence-related branches are growing. French industry is therefore undergoing a change in composition as much as a decline.
5.5 The trade balance
Figure 4 shows the French trade balance in goods and the evolution of bilateral balances.
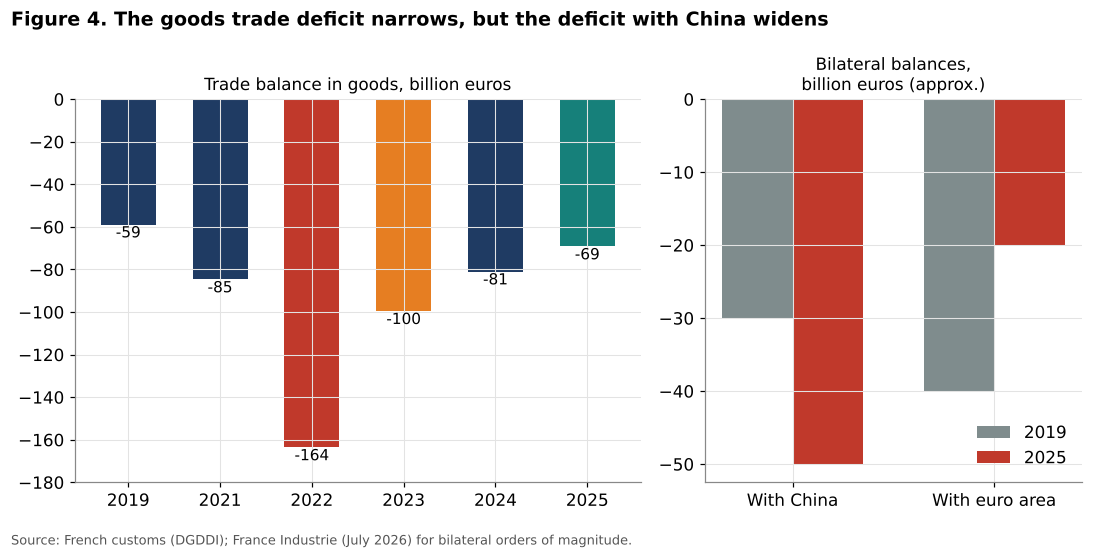
The French goods trade balance has been in deficit for about two decades. The deficit was 58.9 billion euros in 2019, rose to 84.7 billion in 2021 and to a record 163.6 billion in 2022, when energy prices exploded. It then fell to 99.6 billion in 2023, 81.0 billion in 2024 and 69.2 billion in 2025. Exports reached 614.7 billion euros in 2025, up 2.5 percent.
| Year | Goods trade balance (bn euros) |
|---|---|
| 2019 | -58.9 |
| 2021 | -84.7 |
| 2022 | -163.6 |
| 2023 | -99.6 |
| 2024 | -81.0 |
| 2025 | -69.2 |
Table 2. French goods trade balance. Source: French customs.
The improvement since 2022 is largely due to the fall in energy prices, which reduced the energy bill, and to the recovery of aerospace exports. But the deficit in manufactured goods remains large, at about 1.5 points of GDP.
The geographical structure of the deficit has changed significantly. Between 2019 and 2025, the deficit with the euro area fell from about 40 to about 20 billion euros, while the deficit with China rose from about 30 to almost 50 billion euros. China has become the main source of the French goods deficit. This reflects the rapid growth of Chinese exports of manufactured goods to Europe, including electric vehicles, batteries, electronics and machinery, at prices that European producers often cannot match.
5.6 Aerospace at full stretch, margins under pressure
Figure 5 compares the momentum of aerospace with the evolution of corporate margins.
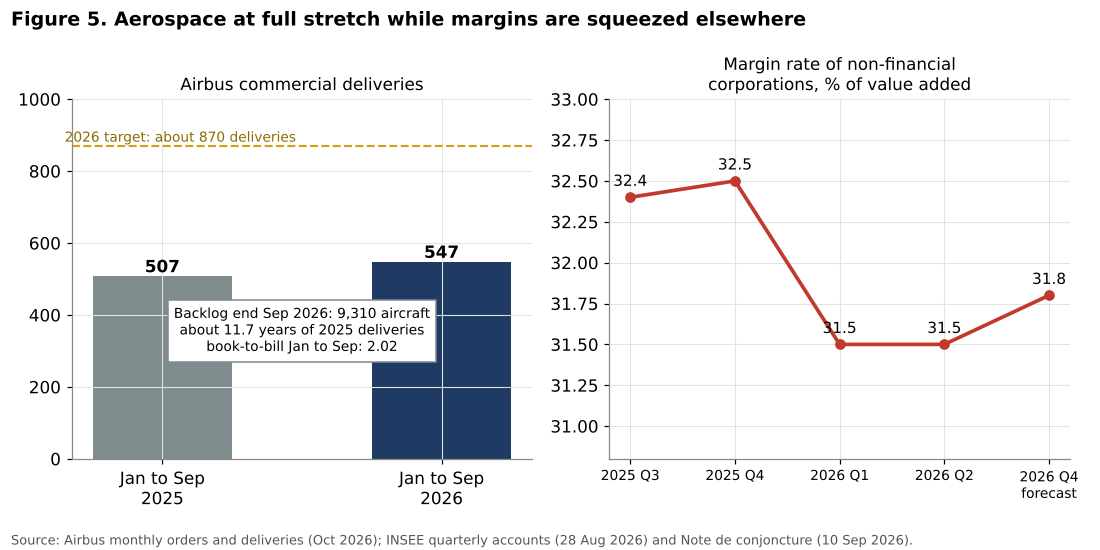
Aerospace is the clearest case of a sector that holds up. Airbus, which is headquartered in Toulouse and has a large part of its final assembly and supply chain in France, delivered 547 commercial aircraft between January and September 2026, against 507 over the same period of 2025, an increase of 7.9 percent. In September alone, it delivered 72 aircraft. Net orders over the first nine months reached 1,105 aircraft, about twice the number delivered, and the backlog stood at 9,310 aircraft at the end of September, equivalent to about 11.7 years of production at the 2025 pace of 793 deliveries, or 10.7 years at the 2026 target of about 870.
| Indicator | Value |
|---|---|
| Deliveries, January to September 2025 | 507 |
| Deliveries, January to September 2026 | 547 |
| Change | +7.9% |
| 2026 delivery target | about 870 |
| Deliveries needed in the fourth quarter | 323, about 108 per month against 61 on average so far |
| Net orders, January to September 2026 | 1,105 |
| Backlog, end of September 2026 | 9,310 aircraft |
| Backlog in years of 2025 deliveries | 11.7 |
Table 3. Airbus commercial aircraft orders and deliveries. Source: Airbus, monthly data reported in October 2026; calculations by the author.
These figures explain why aerospace resists the slowdown: its activity is determined by an order book covering more than a decade of production, placed by airlines all over the world, and largely independent of the European business cycle. INSEE expects aerospace output to grow by about 10 percent in 2026, after a summer slowdown. The constraint is on the supply side: to reach its 2026 target, Airbus would need to deliver 323 aircraft in the fourth quarter, about 108 per month against 61 on average so far, and the shortage of engines and equipment reported in the Banque de France survey shows that the supply chain remains the bottleneck.
The rest of industry faces the opposite situation: a demand constraint and a cost shock. The margin rate of non-financial corporations, which measures the share of value added that remains with firms after paying wages and production taxes, fell from 32.5 percent in the fourth quarter of 2025 to 31.5 percent in the first quarter of 2026, a drop of one point in a single quarter, and remained at 31.5 percent in the second quarter. INSEE attributes this fall mainly to the deterioration of the terms of trade caused by the rise in energy and import prices, whose contribution to the change in the margin rate in 2026 is about -0.8 point. On average, INSEE expects the margin rate to fall from 32.4 percent in 2025 to 31.6 percent in 2026, before a slight recovery to 31.8 percent at the end of 2026 if firms succeed in passing on their costs.
The aggregate margin rate covers all non-financial corporations, including services. INSEE does not publish recent margin rates by industrial branch, but the Banque de France survey indicates where the squeeze is concentrated: in chemicals and in rubber, plastics and glass, where input costs rose most and pass-through to selling prices is only partial, and in construction. These are precisely the branches that also report weak order books and tense cash positions. The combination of falling margins and weak demand is the most dangerous configuration for industrial investment, because it reduces both the means and the incentive to invest.
5.7 Factories: openings and closures
The State barometer, which counts openings and closures of industrial sites as well as significant extensions and reductions, recorded 61 openings and 60 closures in the second half of 2024, then 44 openings and 82 closures in the first half of 2025. Closures clearly exceeded openings, a reversal of the trend observed since 2017. Including extensions and reductions, the net balance remained slightly positive (+9 in the first half of 2025), but openings minus closures alone was -38.
Over the whole of 2025, the net balance of the barometer fell to +19, against +88 in 2024 and much higher values in 2022 and 2023. Trendeo, which weights sites by their size, recorded a net balance of -63 in 2025, the lowest since 2013.
The sectoral pattern is consistent with the production data. Green industries (+26), aerospace, space and defence (+19) and electronics (+12) recorded positive net balances in 2025, while transport, chemicals, mechanical engineering and metallurgy recorded negative balances. Regionally, Nouvelle-Aquitaine and Occitanie, home to the aerospace industry, recorded the strongest balances, while Hauts-de-France and Bourgogne-Franche-Comté, traditional industrial regions, recorded negative balances.
The reindustrialisation of 2017 to 2024 was therefore real but fragile. It relied on a limited number of sectors and regions, and it has stalled as soon as conditions deteriorated.
5.8 Productivity and investment
French manufacturing invested about 65 billion euros in 2025, of which about 27.5 percent in research and development, 23 percent in machinery and equipment, 20 percent in software and databases, and 18 percent in buildings. The high share of intangible investment is a strength: it reflects a positioning on high technology products and services related to industry.
However, productivity is weak. According to France Industrie, apparent labour productivity rose by 1.3 percent in 2025 and 3.7 percent in 2024, but these gains followed a sharp fall after the pandemic. As noted above, the Banque de France finds that productivity in 2025 was still about 1 percent below its 2019 level and 11 percent below its pre-pandemic trend. Part of the explanation lies in the hiring of apprentices, whose number in industry rose by 83 percent between 2018 and 2024, from about 64,000 to 117,000. Apprentices increase employment but contribute little to output in the short term. Part of it lies in labour hoarding: firms kept their workers during the downturn in expectation of a recovery.
5.9 Beyond manufacturing: energy and construction
The industrial production index also covers energy and construction, which help to interpret the manufacturing figures. Over the three months to August 2026, output in electricity, gas and steam was 3.7 percent higher than a year earlier, and output in energy and water as a whole 3.5 percent higher. This reflects the recovery of nuclear electricity production after the difficulties of 2022 and 2023, when corrosion problems and maintenance had sharply reduced the availability of the reactor fleet. The improvement in electricity production is what kept total industrial output stable while manufacturing declined. It is also a reminder that France’s main industrial asset in the coming years may be its capacity to produce large volumes of low-carbon electricity.
Construction, in contrast, is in a deep downturn. Its output over the three months to August 2026 was 5.0 percent lower than a year earlier, with buildings down 5.6 percent and civil engineering down 8.2 percent. The construction index stood at 88.2 in August 2026 (base 100 in 2021). Construction is an important customer of several manufacturing branches, including non-metallic minerals, metal products, wood and glass, and its weakness explains part of the decline in these branches. The fall in civil engineering is linked to the reduction of local government investment noted by the Cour des comptes, which forecasts a fall of 3.1 percent in value in 2026, itself a consequence of the fiscal constraint analysed in the first two French articles of this series.
The interaction between these sectors illustrates a broader point: the fortunes of French manufacturing depend not only on its own competitiveness, but also on domestic demand from construction and public investment, which fiscal consolidation is reducing, and on European demand for cars and intermediate goods, which is weak.
6. Discussion
6.1 Why do some sectors hold up better? Four distinguishing features
The comparison of the branches that resist with those in difficulty points to four distinguishing features.
A global, long-term order book. Aerospace, defence equipment and part of electrical equipment sell to customers all over the world, under long-term contracts. Their activity depends on global investment cycles in air transport, defence and digital infrastructure, not on the French or European business cycle. The branches in difficulty, by contrast, sell mainly to European industrial customers, notably in the automotive and construction sectors, which are both in recession or close to it.
Low energy intensity. Energy accounts for a small share of costs in aerospace, electronics or pharmaceuticals, and for a large share in chemicals, glass, paper, metallurgy and plastics. The rise in energy prices in 2026 therefore hit the second group much harder, as it did in 2022.
Pricing power. Firms that sell differentiated, high-technology products with long order books can pass cost increases on to their customers, while firms selling standardised intermediate goods in competition with imports cannot. The Banque de France survey shows exactly this pattern: in chemicals and in rubber, plastics and glass, the pass-through of input costs is only partial and margins are squeezed.
A technological lead and less direct Chinese competition. French aerospace, defence and nuclear industries benefit from a technological lead and from strategic barriers to entry. The automotive industry, by contrast, faces direct competition from Chinese manufacturers in electric vehicles, and basic chemicals face competition from producers with cheaper energy in the United States, the Middle East and China.
These features are largely structural. They explain why the divide observed in 2026 is likely to persist, and why the policy response cannot be the same for all sectors.
6.2 Why reindustrialisation has stalled
The analysis suggests four main reasons for the stalling of French reindustrialisation.
The first is the crisis of the European automotive industry. The automotive industry alone accounts for about 42 percent of the decline in French manufacturing output in 2026 and its value added is almost 30 percent below its pre-pandemic trend. The causes are well known: weak demand for new cars in Europe, the costly transition to electric vehicles, and competition from Chinese manufacturers. French carmakers had already moved a large part of their production abroad before the crisis, which makes the domestic industry even more vulnerable.
The second is the cost of energy. Energy-intensive branches, such as chemicals, rubber and plastics, paper and metallurgy, contribute significantly to the decline. France has a relative advantage thanks to its nuclear electricity, but this advantage has been reduced by the integration of the European electricity market and by the end of the regulated access to historical nuclear electricity at the end of 2025. Gas prices remain much higher than in the United States, and the 2026 energy shock has added to the pressure.
The third is competition from China. The deficit with China has risen by about 20 billion euros since 2019, and Chinese exports are increasingly concentrated in the sectors that Europe hoped to develop, such as electric vehicles, batteries and solar panels. French and European industrial policies, designed to support these sectors, face competitors with much greater scale and lower costs.
The fourth is weak productivity. Without productivity gains, French industry cannot reduce its costs relative to its competitors, and the reductions in taxes and social contributions of the past decade have only partly compensated for this.
6.3 A change in composition
The decline is not uniform. Aerospace, defence, electronics, electrical equipment, pharmaceuticals and green industries are growing, while automotive, chemicals and traditional heavy industries are declining. This reflects a change in the composition of French industry toward higher technology and strategic sectors.
This change has advantages: these sectors have higher value added per worker, export potential and a strategic dimension. But it also has risks. Aerospace depends on a few large firms, particularly Airbus and Safran, and on the global aviation cycle. Defence depends on public orders. Green industries depend on public support and on the outcome of competition with China. And the decline of the automotive industry affects regions and workers that will not easily find jobs in the growing sectors.
6.4 Industrial policy at a crossroads
French industrial policy since 2017 has combined horizontal measures, such as tax reductions, and targeted measures, such as the France 2030 plan. The data suggest that horizontal measures helped stop the decline of the 2000s, but that they are insufficient in the face of the current shocks. Targeted measures have supported the emergence of new sectors, but their scale is modest compared with the American Inflation Reduction Act or Chinese state support.
The fiscal context analysed in the previous articles of this series limits the room for manoeuvre. With a deficit of 5 percent of GDP and rising interest costs, France cannot afford a large increase in industrial subsidies. The 2027 budget bill reflects this constraint: it preserves the research tax credit and extends the green industry investment credit, but does not add major new instruments.
This suggests that the most effective levers may be at the European level: a coordinated trade policy toward Chinese imports in strategic sectors, common financing of strategic investments, and a more integrated energy market that preserves the advantage of low-carbon electricity for industry.
The evaluation of existing instruments should also be part of the answer. The research tax credit, which costs the State several billion euros per year, the France 2030 plan and the various exemptions on production taxes have rarely been evaluated in terms of their effects on industrial output and employment. At a time when every euro of public money must be justified, a systematic evaluation of these instruments, comparing their cost with the jobs and value added they generate, would allow resources to be concentrated on the most effective measures. The new economics of industrial policy reviewed above insists precisely on this point: targeted policies can work, but only if they are disciplined by clear objectives, time limits and independent evaluation.
6.5 Margins: the hidden constraint on investment
The squeeze on margins deserves particular attention. Between 2017 and 2024, the reduction of production taxes and of social contributions helped restore the margins of French industrial firms, which was one of the conditions of the reindustrialisation observed in those years. The energy shock of 2026 has partly reversed this improvement: the margin rate of non-financial corporations lost about one point in a single quarter. For the branches where the squeeze is concentrated, the consequence is a reduction in self-financing at the very moment when they would need to invest in decarbonisation and modernisation. At the same time, the fiscal constraint described in the previous articles of this series limits the room for new tax cuts or subsidies. Stabilising energy costs, through long-term contracts with nuclear electricity and the development of renewable supply, is therefore the most effective lever to protect margins in the energy-intensive branches.
6.6 Energy as a strategic lever
France’s nuclear fleet is a potential competitive advantage that few other countries have. The challenge is to translate this advantage into stable and competitive electricity prices for industry. The new framework for the remuneration of nuclear electricity that replaced the regulated access mechanism from 2026, and the long-term contracts that EDF is negotiating with large industrial consumers, are central to this. The 2027 budget bill also proposes to end what it calls excessive remuneration of older renewable energy support contracts. The success of these arrangements will determine whether energy-intensive industries remain in France.
6.7 Employment and regions
Manufacturing employment fell by 13,000 in 2025, after a decade of increases. Trendeo estimates that the first half of 2025 saw 10,000 fewer industrial jobs than the first half of 2024. The trade union confederation CGT counted 444 restructuring plans since June 2024. These losses are concentrated in traditional industrial regions, where alternatives are limited. The social and political consequences of a new wave of deindustrialisation in these regions could be significant, as the experience of the 1980s and 2000s showed.
6.8 Comparison with Germany, Italy and Spain
The comparison with other large euro area economies is instructive. Germany, which has a much larger industrial base, suffered the largest gap to trend (17 percent), because its industry is more exposed to the automotive sector, to energy-intensive chemicals and to exports to China, three areas that have deteriorated simultaneously. Italy, with a gap of about 10 percent, suffered from its dependence on Russian gas and on energy-intensive branches. Spain, with a gap of only 3 percent, benefited from lower electricity prices thanks to the rapid development of solar and wind power, from a less energy-intensive industrial structure and from strong domestic demand.
France is in an intermediate position. Its smaller industrial base protected it somewhat from the German shock, and its nuclear electricity mitigated the energy shock compared with Italy. But it did not benefit from the dynamism of Spain. The lesson for French industrial policy is that the size of the industrial base is less important, in the short term, than its exposure to the sectors in difficulty, and that the cost of energy has become the main differentiating factor between European industrial economies.
7. Scenarios to 2040
7.1 How long would reindustrialisation take?
Figure 6 presents three simulations of the share of manufacturing in GDP to 2040.
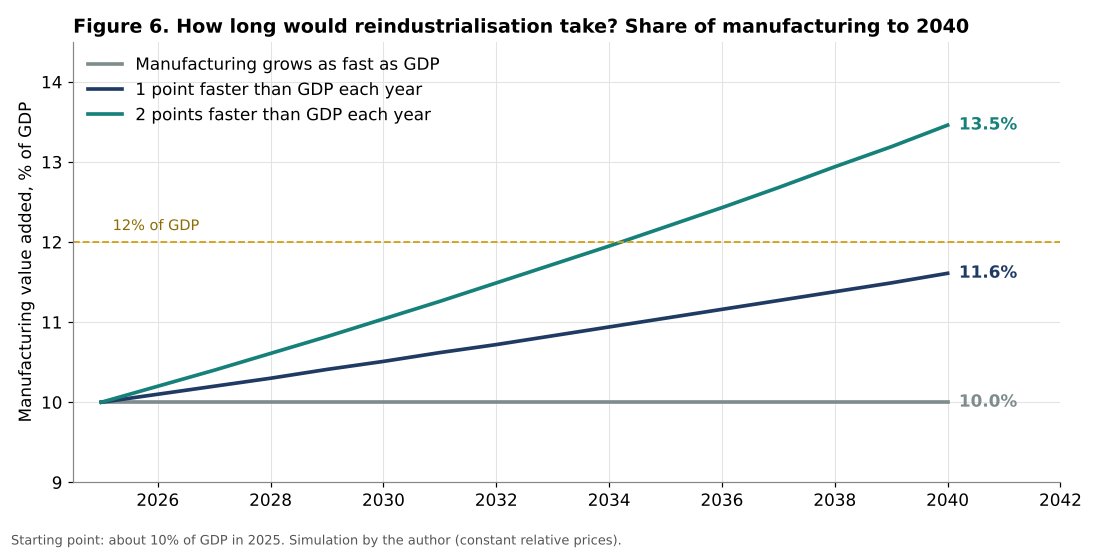
Scenario 1: manufacturing grows at the same rate as GDP. The share remains at about 10 percent of GDP. This corresponds to the situation of the past decade.
Scenario 2: manufacturing grows one point faster than GDP each year. The share rises to about 11.6 percent of GDP in 2040. Reaching 12 percent would take about 18 years. Reaching 15 percent would take about 41 years.
Scenario 3: manufacturing grows two points faster than GDP each year. The share rises to about 13.5 percent in 2040. Reaching 12 percent would take about 9 years, and 15 percent about 20 years.
7.2 Interpretation
These simulations show the scale of the challenge. Even the most optimistic scenario, in which manufacturing grows two points faster than the economy every year for fifteen years, which has never happened in France in recent decades, would bring the share of manufacturing back only to the level of the early 2000s by 2040. A return to 15 percent of GDP, an objective sometimes mentioned in the public debate, would take two to four decades.
This does not mean that reindustrialisation is impossible or useless. It means that it must be understood as a long-term project, measured in decades rather than in electoral cycles, and that its success depends on sustained competitiveness gains rather than on one-off subsidies.
A more realistic objective might be to stabilise the share of manufacturing at about 10 to 11 percent of GDP while increasing its technological content, its exports and its contribution to strategic autonomy. This would already require reversing the trends of 2025 and 2026.
7.3 Indicators to monitor
1. The monthly industrial production index, especially for the automotive, chemicals and energy-intensive branches. 2. The State industrial barometer of openings and closures, published twice a year. 3. The goods trade balance and the bilateral balance with China. 4. Industrial electricity prices under the new nuclear remuneration framework. 5. Manufacturing employment and productivity in the quarterly national accounts.
8. Conclusion
This article has asked why some sectors of French industry hold up better than others in 2026. Its main conclusions are:
1. French industry moves at several speeds. In the Banque de France survey of early October 2026, aeronautics, electronics and electrical equipment report strong activity and full order books, while chemicals, rubber, plastics and glass, and wood and paper report very weak order books, tense cash positions and squeezed margins. 2. Manufacturing output fell by 1.2 percent year on year in the three months to August 2026; the automotive industry accounts for about 42 percent of the decline, and energy-intensive branches for much of the rest, while electronics, electrical equipment and pharmaceuticals grew. 3. Aerospace is constrained by supply, not demand: Airbus deliveries rose by 7.9 percent over the first nine months of 2026, and its backlog of 9,310 aircraft represents about 11.7 years of production at the 2025 pace. 4. The margin rate of non-financial corporations fell by one point in the first quarter of 2026, to 31.5 percent, mainly because of the terms of trade shock, and the squeeze is concentrated in the energy-intensive branches. 5. Manufacturing accounts for about 10 percent of GDP, its value added remained about 8 percent below its pre-pandemic trend at the end of 2025, factory closures exceeded openings in 2025, and the deficit with China has grown to about 50 billion euros. 6. Even under optimistic assumptions, the share of manufacturing in GDP would remain below 14 percent in 2040.
The sectors that resist share four features: a global and long-term order book, low energy intensity, pricing power and a technological lead. The sectors in difficulty combine high energy costs, dependence on weak European demand and direct Chinese competition. French reindustrialisation will therefore depend on two conditions: lifting the supply constraints of the growing sectors, notably in the aerospace supply chain, skills and component production, and protecting the margins of the energy-intensive branches through stable and competitive energy costs and a European response to unfair competition. Neither condition will be met by short-term subsidies alone, and both will have to be pursued under a tight fiscal constraint.
Need this analysis for your organisation?
We prepare confidential briefings, executive talks and studies on countries, markets and policies, built on the same method as this article.
Request a briefingSupport independent analysis
Our studies are free to read and carry no advertising. If this one was useful, a small contribution helps us publish the next.
Support our workGo further: books by Global Strategy Files

Frequently asked questions
Has French reindustrialisation stalled?
Yes. After factory openings exceeded closures from 2017 to 2024, 82 factories closed and only 44 opened in the first half of 2025, and manufacturing output in the three months to August 2026 was 1.2 percent lower than a year earlier.
How large is French industry?
Manufacturing value added represents about 10 percent of French GDP, against 22 percent in 1970 and 14.5 percent in 2000. Per inhabitant it is about 4,000 euros, against 6,000 in the euro area and 9,500 in Germany.
Which industries are pulling French manufacturing down?
The automotive industry alone accounts for about 42 percent of the 1.2 percent fall in manufacturing output in mid-2026, followed by rubber and plastics, food, wood and paper and chemicals, according to the author’s decomposition by branch.
Can France raise industry’s share of GDP?
Only slowly. Even if manufacturing grew one point faster than GDP every year, its share would reach only 11.6 percent of GDP by 2040, so reindustrialisation requires sustained competitiveness gains and stable energy costs rather than short-term subsidies.
Methodological note
The scorecard in Figure 2 is the author’s coding of the qualitative statements of the Banque de France monthly business survey of early October 2026. Airbus figures come from the company’s monthly orders and deliveries data for September 2026 and September 2025. Margin rates come from the INSEE quarterly accounts of 28 August 2026 and the INSEE Note de conjoncture of 10 September 2026. The decomposition of manufacturing output is calculated by the author from the INSEE industrial production index of August 2026, using branch weights and three-month year-on-year growth rates. The simulations of the share of manufacturing in GDP are mechanical and assume constant relative prices. Long-term shares, value added per inhabitant, employment, investment and bilateral trade balances are taken from France Industrie (July 2026), which relies on INSEE, Eurostat and customs data. The gap to trend and its sectoral decomposition are taken from the Banque de France (April 2026). Factory barometer data come from the Directorate General for Enterprise. Rounded values are indicated as approximate.
References
Airbus (2026). Orders and Deliveries, September 2026. Toulouse, October 2026.
Autor, D., Dorn, D. and Hanson, G. (2013). The China Syndrome: Local Labor Market Effects of Import Competition in the United States. American Economic Review, 103(6), 2121 to 2168.
Banque de France (2026). Enquête mensuelle de conjoncture à début octobre 2026. Paris, 12 October 2026.
Banque de France (2026). Pourquoi le secteur manufacturier européen et français n’a-t-il pas retrouvé sa tendance pré-Covid ? Bulletin de la Banque de France, 263/2, April 2026.
Direction générale des entreprises (2026). Baromètre industriel de l’État, 2025. Paris.
Draghi, M. (2024). The Future of European Competitiveness. European Commission, Brussels.
France Industrie (2026). Portrait de l’industrie manufacturière 2025. Paris, July 2026.
Gallois, L. (2012). Pacte pour la compétitivité de l’industrie française. Rapport au Premier ministre, Paris.
INSEE (2026). Au deuxième trimestre 2026, le PIB est stable. Informations rapides n° 212, comptes nationaux trimestriels, résultats détaillés. Paris, 28 August 2026.
INSEE (2026). Indice de la production industrielle, août 2026. Informations Rapides, October 2026.
INSEE (2026). Vigilance orange sur la croissance. Note de conjoncture. Paris, 10 September 2026.
Juhász, R., Lane, N. and Rodrik, D. (2024). The New Economics of Industrial Policy. Annual Review of Economics, 16, 213 to 242.
Rodrik, D. (2016). Premature Deindustrialization. Journal of Economic Growth, 21(1), 1 to 33.
