
Russia: Fewer Hands, Dearer Machines

Fewer Hands, Dearer Machines: The Supply Limits to Expanding Production in Russia
Driss EFFINA, PhD
Independent Researcher, Global Strategy Files
Reading time: 26 minutes
Key takeaways
- Russian fixed investment rose 1.9 percent in nominal terms in the first half of 2026, but its volume fell by 9.9 percent according to Rosstat.
- Investment prices rose about 13.1 percent, 7.3 points faster than consumer prices, so about two thirds of the volume fall is a price effect.
- Unemployment fell from 5.8 percent in 2020 to 2.2 percent in 2025, about 0.8 points more than growth alone predicts, reflecting a shrinking labour force.
- Unit labour costs rose about 12 percent in the first half of 2026, matching the GDP deflator, so wage costs are driving domestic prices.
Abstract
In the first half of 2026, Russian companies spent 16.22 trillion rubles on fixed investment, 1.9 percent more than a year earlier in nominal terms. Yet according to Rosstat, the volume of investment fell by 9.9 percent. The gap between these two figures is the subject of this paper. It reflects a broader question that has become central to Russian economic policy: what limits the expansion of production when the economy faces both a shortage of workers and a shortage of affordable capital goods? Using official data from Rosstat, the Bank of Russia and the International Monetary Fund, I measure four constraints. First, I compute the implied price deflator of investment and find that capital goods and construction prices rose by about 13.1 percent in the first half of 2026, 7.3 percentage points faster than consumer prices; had investment prices risen in line with consumer prices, the real decline in investment would have been 3.7 percent instead of 9.9 percent. About two thirds of the measured fall in investment volume is therefore a price effect. Second, I estimate Okun’s law for Russia over 2011 to 2019 and show that unemployment stops falling at a growth rate of only 0.2 percent, a sign of a shrinking labour force; the decline of unemployment from 5.8 percent in 2020 to 2.2 percent in 2025 exceeds what growth alone would predict by about 0.8 percentage points, consistent with labour withdrawn by mobilisation and emigration. Third, I estimate that unit labour costs rose by about 12 percent in the first half of 2026, almost exactly matching the GDP deflator, which indicates that wage costs, not demand alone, are driving domestic prices. Fourth, quarterly investment growth is strongly and negatively correlated with the key rate two quarters earlier (correlation -0.73). The conclusion is that Russia’s growth is now constrained on the supply side: additional spending, whether public or private, translates increasingly into higher prices rather than more output.
Keywords: Russia, fixed investment, investment deflator, labour shortage, Okun’s law, unit labour costs, capacity utilisation, potential growth, supply constraints.
1. Introduction
Between 2022 and 2024 the Russian economy surprised most forecasters. After a contraction of 1.4 percent in 2022, GDP grew by 4.1 percent in 2023 and 4.9 percent in 2024, according to the latest figures in the IMF World Economic Outlook database. Fixed investment rose by 6.7 percent in 2022, 9.8 percent in 2023 and 8.4 percent in 2024 (revised), driven by state orders, import substitution projects and the relocation of supply chains. Unemployment fell to historic lows.
By 2026 the picture had changed. GDP growth slowed to about 1.0 percent in 2025, and the first half of 2026 brought a contraction of 0.2 percent year on year in the first quarter followed by growth of 1.3 percent in the second. Fixed investment fell by 2.3 percent in 2025 and by 9.9 percent in the first half of 2026, with a drop of 14.3 percent in the first quarter. The Bank of Russia’s survey of enterprises shows capacity utilisation falling from 80.7 percent in 2024 to 77.5 percent in the first quarter of 2026, and hiring plans close to zero.
The standard explanation for this slowdown is monetary: the key rate, which reached 21 percent between October 2024 and June 2025, made credit prohibitively expensive. This explanation is correct but incomplete. The Bank of Russia itself has repeatedly emphasised two other factors: a labour market so tight that wages grow faster than productivity, and the high cost and limited availability of capital goods, many of which were previously imported from countries that now apply sanctions. In September 2026 the Governor stated that “for inflation to decelerate sustainably, the gap between the growth rates of labour productivity and those of wages should narrow further”.
This paper asks a specific question: what limits the expansion of production in Russia today, and how much do labour and capital goods shortages reduce the real gains from higher investment spending? To answer it, I do not rely on the commentary of others but on calculations made directly on official data. The contribution of the paper is to quantify the price effect in investment, the labour supply constraint implied by Okun’s law, the cost pressure measured by unit labour costs, and the sensitivity of investment to monetary conditions.
The paper is organised as follows. Section 2 presents the context. Section 3 reviews the literature. Section 4 describes the data and methods. Section 5 presents the results. Section 6 discusses the policy implications, Section 7 presents scenarios, and Section 8 concludes.
2. Context: from a demand boom to a supply ceiling
The Russian economy since 2022 has gone through three phases.
The first phase, in 2022, was a shock. Sanctions cut access to Western technology, components and markets. Many foreign companies left. GDP fell, but less than initially feared, as the economy reoriented trade towards Asia and the state increased spending.
The second phase, in 2023 and 2024, was a demand boom. Military spending, subsidised mortgages and state-supported investment projects pushed demand above the economy’s capacity. Unemployment fell from 4.0 percent in 2022 to 2.5 percent in 2024. Investment grew strongly, but a growing share of it was absorbed by rising costs.
The third phase, from 2025, is the phase of constraints. The central bank raised the key rate to 21 percent. Investment began to fall from the second quarter of 2025. Wages kept rising faster than productivity. In the first half of 2026, investment volumes fell sharply while nominal spending was roughly stable.
Several structural factors limit supply. The working-age population has been declining for more than a decade because of the demographic legacy of the 1990s. Mobilisation in 2022 and emigration reduced the labour force further. The defence industry absorbs a large share of skilled workers. On the capital side, the replacement of Western equipment by domestic or Asian alternatives has often meant higher costs, longer delivery times and lower quality. The Bank of Russia notes that large projects continue in chemicals, energy and transport vehicle manufacturing, but that investment activity remains weak overall.
3. Literature review
Three strands of literature guide the analysis.
The first concerns potential output and supply constraints. The production function approach decomposes potential growth into contributions from labour, capital and total factor productivity (Solow, 1957). When labour supply shrinks and capital accumulation slows, potential growth falls, and demand stimulus generates inflation rather than output. Blanchard and Galí (2007) showed how real wage rigidities make inflation more costly to stabilise after supply shocks.
The second strand concerns the relationship between output and unemployment. Okun (1962) documented a stable negative relationship between output growth and changes in the unemployment rate. Ball, Leigh and Loungani (2017) showed that Okun’s law holds in most advanced economies but with country-specific coefficients, and that the intercept of the relationship reflects trend growth in labour productivity and labour force. In an economy with a shrinking labour force, unemployment can fall even with very low growth.
The third strand concerns investment, its cost and its sensitivity to interest rates. Jorgenson (1963) formalised the user cost of capital, which depends on the interest rate, depreciation and the relative price of capital goods. When the relative price of capital goods rises, the same nominal investment buys less capital. Eaton and Kortum (2001) showed that international trade in capital goods is an important determinant of the relative price of investment, especially for countries that import machinery. For Russia, sanctions on machinery and equipment are therefore expected to raise the relative price of investment and reduce the effective capital stock bought with a given amount of spending.
4. Data and methodology
4.1 Data
- Investment: Rosstat data on fixed investment, as reported by Interfax, Finmarket and The Moscow Times: nominal volumes for the first half of 2025 (15,914.7 billion rubles) and the first half of 2026 (16,220.6 billion rubles); real growth rates by quarter from 2024 to the second quarter of 2026; annual real growth for 2022 to 2025.
- GDP, unemployment and inflation: IMF World Economic Outlook database (actual values for 2010 to 2025 and projections to 2031), accessed through the IMF DataMapper.
- Monthly inflation: Bank of Russia, annual consumer price inflation by month.
- Key rate: Bank of Russia daily key rate, averaged by quarter.
- Wages and labour market: Rosstat data reported by The Moscow Times and Trading Economics for 2026: nominal wage growth of 12.7 percent and real wage growth of 6.5 percent in the first half; unemployment of 2.2 percent in August 2026.
- Business surveys: Bank of Russia, Monitoring of Enterprises, April 2026 issue: capacity utilisation, staffing levels, hiring plans and investment activity.
- GDP deflator: Rosstat, second quarter of 2026 (12.5 percent).
4.2 Methods
Implied investment deflator. The ratio of nominal growth to real growth gives the implied price change of investment goods and services: deflator = (1 + nominal growth) / (1 + real growth) – 1. I compare it with average consumer price inflation over the same period and compute a counterfactual: the real change in investment that would have been observed if investment prices had grown at the same rate as consumer prices.
Okun’s law. I estimate by ordinary least squares the equation: change in unemployment rate = a + b x real GDP growth, on annual data. The ratio -a/b gives the growth rate at which unemployment is stable. I estimate the equation over 2011 to 2019, before the pandemic and the war, and compare predictions with outcomes for 2020 to 2025.
Unit labour costs. I approximate the growth of unit labour costs as (1 + nominal wage growth) / (1 + real GDP growth) – 1, under the assumption that total employment was approximately stable, which is consistent with unemployment around 2.2 percent and a slowly declining labour force.
Investment and monetary conditions. I compute the correlation between quarterly real investment growth and the average key rate two quarters earlier over 2024 to 2026, and estimate a simple linear regression.
Limitations. The quarterly sample is short (10 observations) and the investment figures come from successive vintages that may be revised. The unit labour cost estimate is approximate. Okun’s law is a statistical regularity, not a structural model. Results are therefore presented as orders of magnitude.
5. Results
5.1 The investment cycle and the key rate
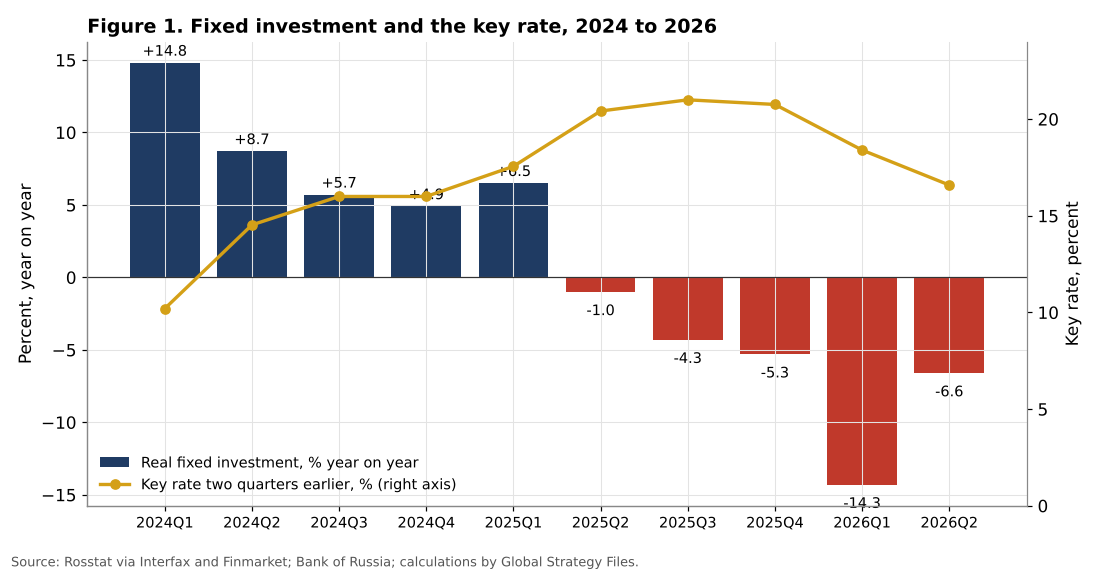
Figure 1 shows quarterly real investment growth from 2024 to the second quarter of 2026, together with the key rate two quarters earlier. The decline is continuous: from +14.8 percent in the first quarter of 2024 to -1.0 percent in the second quarter of 2025 and -14.3 percent in the first quarter of 2026, before a partial improvement to -6.6 percent in the second quarter. Over two years, investment volumes in the second quarter of 2026 are 7.5 percent below those of the second quarter of 2024.
The correlation between investment growth and the key rate two quarters earlier is -0.73. A simple regression suggests that each percentage point of key rate is associated with investment growth about 1.9 percentage points lower two quarters later (R squared 0.53). With only ten observations, this estimate should not be over-interpreted, but the direction and magnitude are consistent with the high sensitivity of investment to financing costs. The partial recovery in the second quarter of 2026 coincides with the easing of the key rate from 21 percent to around 15 percent in the preceding quarters.
Table 1. Real fixed investment and the key rate
| Quarter | Real investment, % y/y | Key rate two quarters earlier, % |
|---|---|---|
| 2024 Q1 | +14.8 | 10.2 |
| 2024 Q2 | +8.7 | 14.5 |
| 2024 Q3 | +5.7 | 16.0 |
| 2024 Q4 | +4.9 | 16.0 |
| 2025 Q1 | +6.5 | 17.6 |
| 2025 Q2 | -1.0 | 20.4 |
| 2025 Q3 | -4.3 | 21.0 |
| 2025 Q4 | -5.3 | 20.8 |
| 2026 Q1 | -14.3 | 18.4 |
| 2026 Q2 | -6.6 | 16.6 |
Source: Rosstat; Bank of Russia; calculations by the author.
The monetary explanation, however, does not account for the gap between nominal and real investment, which is the subject of the next subsection.
5.2 Dearer machines: two thirds of the fall is a price effect
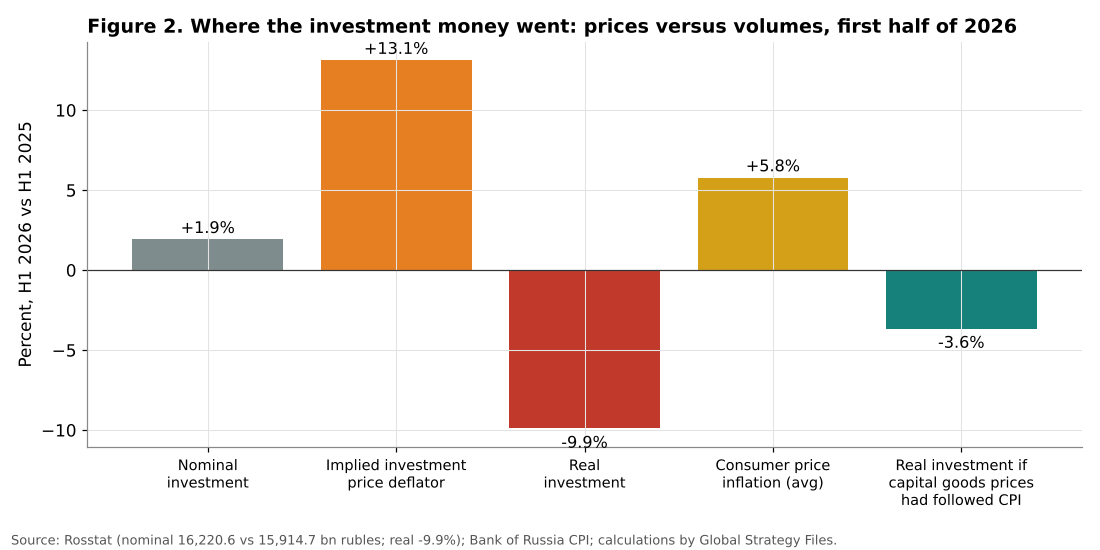
In the first half of 2026, nominal investment reached 16,220.6 billion rubles, compared with 15,914.7 billion in the first half of 2025, an increase of 1.92 percent. Rosstat reports a real decline of 9.9 percent. The implied price deflator of investment is therefore:
(1.0192 / 0.901) – 1 = 13.1 percent.
Over the same six months, annual consumer price inflation averaged 5.78 percent. Investment prices therefore rose 7.3 percentage points faster than consumer prices. If investment prices had risen at the same rate as consumer prices, the real change in investment would have been -3.7 percent instead of -9.9 percent.
This calculation leads to a striking conclusion: about 6.2 of the 9.9 points of decline in investment volume, roughly two thirds, can be attributed to the excess increase in the price of investment goods and construction services, rather than to a reduction in spending. Russian companies and the state did not cut their investment budgets in nominal terms. They received much less capital for the same money.
Several mechanisms explain this relative price increase:
- Imported equipment. Machinery and equipment imported through third countries or parallel channels carry higher logistics costs, intermediary margins and payment costs. The weakening of the ruble in the summer of 2026, from 72.8 to 85.1 rubles per dollar between May and September, will add further pressure in the second half.
- Construction costs. Construction is labour intensive, and wages in construction have risen rapidly because of the competition for workers with the defence industry.
- Domestic substitutes. Domestically produced equipment that replaces Western machinery is often produced in small series at high unit costs.
This result directly answers part of the research question. Shortages of capital goods do not only delay projects; they reduce the real return of every ruble invested. A government that increases investment spending by 10 percent in nominal terms in such an environment may obtain only a small increase in productive capital.
5.3 Fewer hands: what Okun’s law reveals
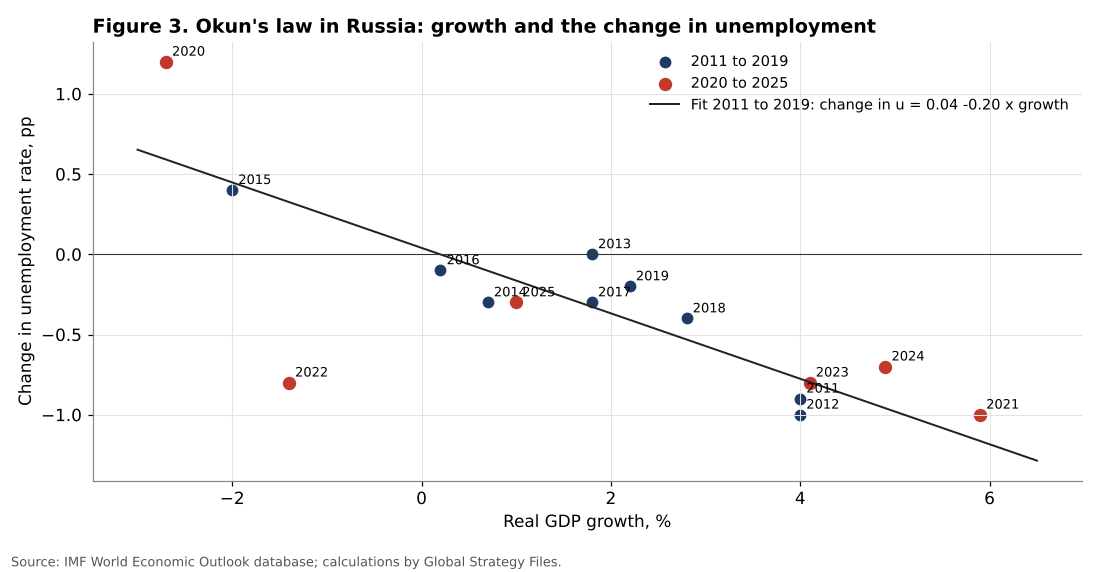
Okun’s law estimated on annual data for 2011 to 2019 gives:
change in unemployment rate = 0.04 – 0.204 x real GDP growth (R squared 0.81, t statistic of the slope -5.44).
Two results are important. First, the slope of -0.20 means that each additional percentage point of growth reduces the unemployment rate by about 0.2 points. Second, the growth rate at which unemployment is stable is only 0.2 percent (0.04 / 0.204). In many advanced economies, this threshold is considerably higher, often around 2 to 3 percent, because labour productivity and the labour force both grow. In Russia, the labour force has been shrinking: unemployment falls whenever the economy grows at all. Including the years 2020 and 2021, the threshold rises to 0.7 percent, and over the full period 2011 to 2025 it is close to zero.
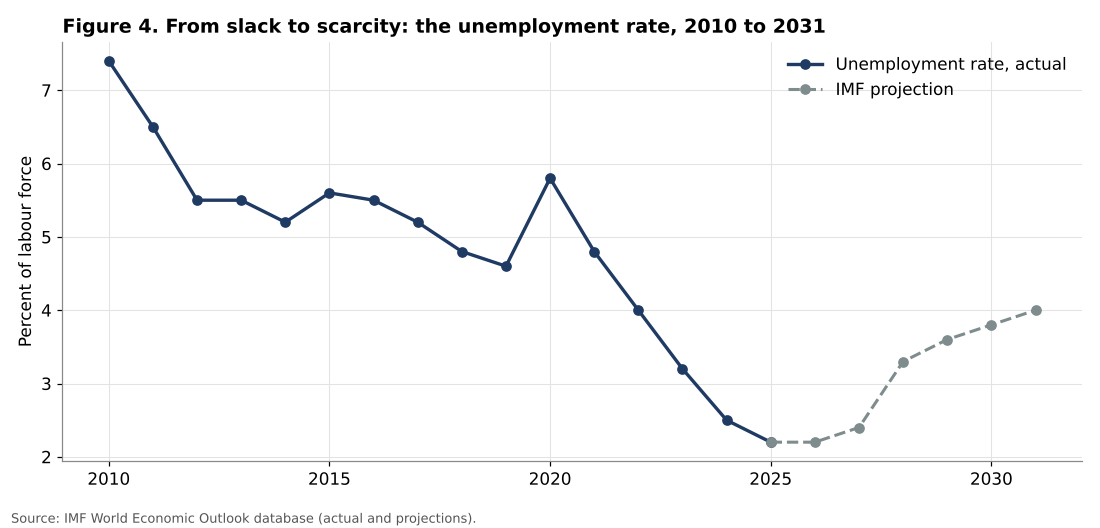
Applying the 2011 to 2019 relationship to 2021 to 2025 predicts a cumulative fall in unemployment of about 2.8 points. The actual fall, from 5.8 percent in 2020 to 2.2 percent in 2025, was 3.6 points. The difference of about 0.8 points of the labour force is concentrated in 2022, when GDP fell by 1.4 percent and yet unemployment fell by 0.8 points instead of rising by about 0.3 points as the historical relationship would predict. This anomaly is consistent with the withdrawal of workers from the civilian labour market through mobilisation, military recruitment and emigration in 2022.
The IMF projects unemployment to rise again, to 2.4 percent in 2027, 3.3 percent in 2028 and 4.0 percent in 2031, with growth of about 1 percent per year. According to the historical Okun relationship, growth of 1 percent should lower unemployment slightly. The IMF projection therefore implies a reversal of the labour withdrawal, for example through the return of workers to the civilian economy, rather than a continuation of past trends.
Table 2. Okun’s law estimates for Russia
| Sample | Intercept | Slope | t statistic | R squared | Growth that stabilises unemployment |
|---|---|---|---|---|---|
| 2011 to 2019 | 0.040 | -0.204 | -5.44 | 0.81 | 0.2% |
| 2011 to 2021 | 0.162 | -0.234 | -7.57 | 0.86 | 0.7% |
| 2011 to 2025 | -0.024 | -0.177 | -4.37 | 0.60 | -0.1% |
Source: IMF World Economic Outlook database; calculations by the author.
The deterioration of the fit when the war years are added (R squared falling from 0.81 to 0.60) is itself informative: since 2022, the labour market has been driven by forces other than output.
5.4 What firms report: capacity, staffing and hiring
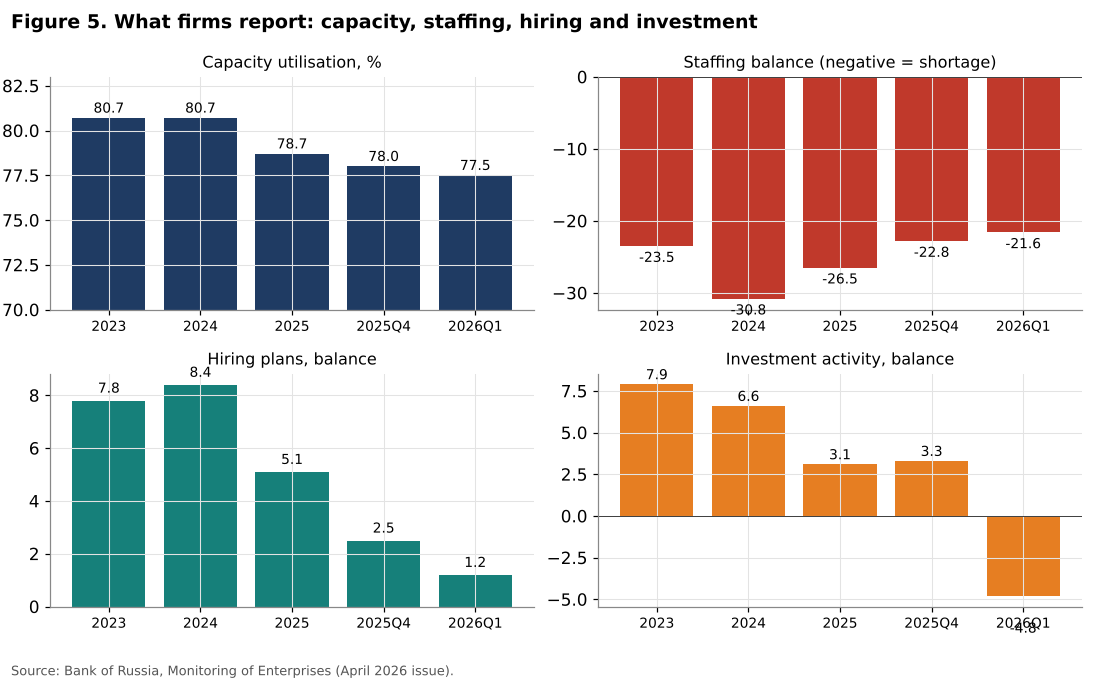
The Bank of Russia’s regular monitoring of non-financial enterprises provides direct evidence of how firms perceive these constraints:
Table 3. Bank of Russia Monitoring of Enterprises
| Indicator | 2023 | 2024 | 2025 | 2025 Q4 | 2026 Q1 |
|---|---|---|---|---|---|
| Capacity utilisation (%) | 80.7 | 80.7 | 78.7 | 78.0 | 77.5 |
| Staffing levels (balance, negative = shortage) | -23.5 | -30.8 | -26.5 | -22.8 | -21.6 |
| Hiring plans (balance) | 7.8 | 8.4 | 5.1 | 2.5 | 1.2 |
| Investment activity (balance) | 7.9 | 6.6 | 3.1 | 3.3 | -4.8 |
Source: Bank of Russia, Monitoring of Enterprises, April 2026.
These indicators show a clear sequence. In 2024, capacity utilisation was high and labour shortages at their peak (staffing balance -30.8). By early 2026, capacity utilisation had fallen by more than 3 points and the staffing shortage had eased significantly, but remained negative: a majority of firms still report insufficient staff. Hiring plans collapsed from 8.4 to 1.2, and investment activity turned negative for the first time in the period.
The combination is revealing. Firms are no longer expanding, but they are not shedding labour either. They keep scarce workers because they fear not being able to rehire them later, a behaviour known as labour hoarding. This keeps unemployment low even as demand slows and limits the disinflationary effect of the slowdown.
5.5 Wages ahead of output: the cost side of the constraint
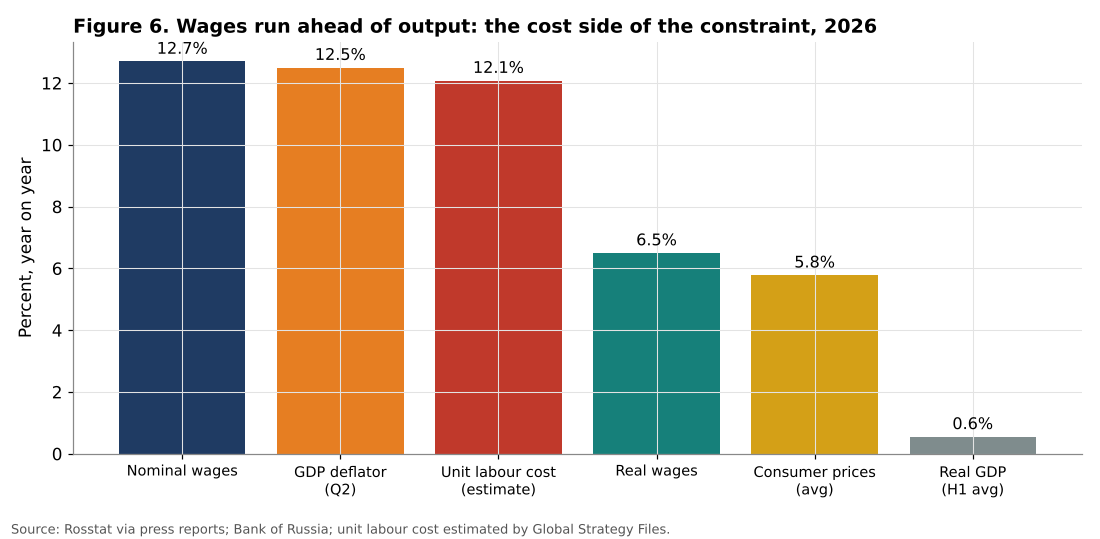
In the first half of 2026, nominal wages rose by 12.7 percent and real wages by 6.5 percent, while real GDP grew by about 0.55 percent on average (-0.2 percent in the first quarter and +1.3 percent in the second). With employment roughly stable, labour productivity growth was therefore close to 0.5 percent, and the gap between real wage growth and productivity growth was about 6 percentage points.
The implied growth of unit labour costs is:
(1.127 / 1.0055) – 1 = about 12.1 percent.
This figure is remarkably close to the GDP deflator in the second quarter of 2026, 12.5 percent. Since the GDP deflator measures the price of domestically produced value added, the similarity suggests that wage costs are the main driver of domestic prices, more than demand pressure alone. It also explains why consumer price inflation, at around 6 percent, is lower than the GDP deflator: part of the cost increase has been absorbed by margins or reflected in the prices of investment goods and exports, rather than consumer goods.
Real wage growth has, however, been slowing: from 8.6 percent in February 2026 to 3.4 percent in June. According to the April monitoring, 80 percent of companies did not plan to raise wages in the second quarter. If this deceleration continues, the gap between wages and productivity will narrow, as the central bank expects.
5.6 A growth accounting perspective: how much does the price premium cost?
To translate these findings into potential growth, I use a simple growth accounting calibration in the tradition of Solow (1957). Potential growth is written as the weighted sum of the growth of the capital stock, the growth of labour input and the growth of total factor productivity:
potential growth = 0.4 x capital growth + 0.6 x labour growth + productivity growth.
The capital share of 0.4 is a conventional value for an economy with a large resource sector. Capital growth depends on the real investment ratio, the capital to output ratio and the depreciation rate: capital growth = (real investment / GDP) / (capital / output) – depreciation. I assume a capital to output ratio of 3 and a depreciation rate of 5 percent per year, values within the usual range for emerging economies. Labour input is assumed to decline by 0.5 percent per year, consistent with the demographic trend and the Okun results above, and total factor productivity to grow by 0.75 percent per year. These assumptions are explicit so that readers can modify them.
The key variable is the real investment ratio. The Ministry of Economic Development expects fixed investment of about 19.5 to 20 percent of GDP in 2026, close to the highest level recorded. But if the price of capital goods rises faster than the GDP deflator, the same nominal ratio buys less capital. Table 4 shows the results.
Table 4. Illustrative potential growth under alternative investment price premia
| Case | Real investment ratio, % of GDP | Capital stock growth, % | Potential growth, % |
|---|---|---|---|
| Investment ratio 19.5%, no price premium | 19.5 | 1.50 | 1.05 |
| Same nominal ratio, 7% price premium on capital goods | 18.2 | 1.07 | 0.88 |
| Same nominal ratio, 13% price premium | 17.3 | 0.75 | 0.75 |
| Investment ratio 22%, no price premium | 22.0 | 2.33 | 1.38 |
Source: calibration by the author; parameters described in the text.
The calibration shows that a persistent price premium of 7 percent on capital goods, close to the gap measured in Section 5.2, reduces potential growth by about 0.2 percentage points per year, and a premium of 13 percent by about 0.3 points. Over a decade, a loss of 0.2 to 0.3 points per year represents a cumulative output loss of 2 to 3 percent of GDP. The calibration also shows the limits of investment as a growth engine when labour is shrinking: even with an investment ratio of 22 percent and no price premium, potential growth reaches only about 1.4 percent. In an economy where labour input declines, the only sustainable sources of faster growth are productivity gains and a more efficient use of capital.
These figures are consistent with the central bank’s medium-term growth forecast of 1.5 to 2.5 percent for 2027 and 2028 only if productivity growth is higher than the 0.75 percent assumed here, or if labour input stops declining. They are consistent with the IMF projection of about 1 percent growth per year from 2026 to 2031 under the baseline assumptions.
6. Discussion
6.1 A supply-constrained economy
The four results converge. Russia’s capacity to expand production is limited by three interconnected constraints:
1. Labour. The labour force is shrinking, and the economy reached a point in 2024 and 2025 where unemployment could hardly fall further. Okun’s law indicates that unemployment falls even at growth of 0.2 percent. Any acceleration of demand therefore runs immediately into labour shortages. 2. Capital goods. The relative price of investment has risen sharply. In the first half of 2026, investment prices increased 7.3 points more than consumer prices, so that two thirds of the measured fall in investment volume was a price effect. 3. Financing. High interest rates reduce the profitability of projects, especially those financed by debt. The correlation of -0.73 between investment and the lagged key rate reflects this channel.
These constraints interact. Labour shortages raise construction costs, which raise the price of investment. Higher investment prices reduce the capital stock bought with a given budget, which limits productivity gains. Weak productivity gains keep wage growth above productivity, which sustains inflation and therefore high interest rates.
6.2 Why more spending does not mean more output
The central implication for policy concerns public spending. When the economy operates at full employment with expensive capital goods, an increase in public investment or defence procurement does not create proportionally more output. Part of the additional spending is absorbed by higher prices for labour and equipment. The GDP deflator of 12.5 percent in the second quarter of 2026, compared with real growth of 1.3 percent, illustrates this split: of the nominal growth of the economy, about nine tenths was price and one tenth was volume.
This does not mean that investment is useless. Investment that raises productivity, through automation, better equipment and improved organisation, is precisely what the economy needs to relax the labour constraint. The problem is that the current environment of high prices and high rates discourages exactly this type of investment, while defence spending, which is insensitive to interest rates, continues.
6.3 Policy options
Three policy directions emerge from the analysis.
Prioritise productivity-enhancing investment. Targeted support for automation, robotics and process improvement would address the labour constraint directly. The central bank has expressed a clear preference for closing the gap between wages and productivity through faster productivity growth.
Reduce the relative price of capital goods. Lower trade frictions for equipment imports, faster certification of foreign equipment and support for domestic machine-building at scale could reduce the investment price premium. This is difficult under sanctions but central to the efficiency of investment.
Rebalance demand towards supply capacity. Reducing the structural fiscal deficit would ease the pressure on labour and prices, allow lower interest rates, and make private investment more profitable. The draft budget for 2027 to 2029 plans deficits of about 2 percent of GDP per year, which leaves limited room for this rebalancing.
6.4 A historical warning
Russia is not the first economy to face diminishing returns from high investment under constrained conditions. Easterly and Fischer (1995) showed that the decline of Soviet growth from the 1960s to the 1980s was largely explained by the falling marginal productivity of capital in an economy that kept investing a high share of output while labour growth slowed and technological progress lagged. The parallel should not be pushed too far: today’s Russian economy is a market economy with a flexible exchange rate and an independent central bank. But the mechanism is similar. When capital accumulation is pursued in an environment where labour is scarce and technology access is restricted, each additional unit of investment yields less output. The measured investment price premium of 2026 is one modern form of this old problem.
7. Scenarios for 2027
Scenario A: gradual easing and productivity investment. If the key rate falls towards 11 to 12 percent by the end of 2027 and investment price inflation returns towards consumer price inflation, the relationship estimated in Section 5.1 suggests that investment could return to positive growth in the second half of 2027. The labour constraint would remain binding, so growth would stay around 1.5 to 2 percent, consistent with the central bank’s forecast.
Scenario B: persistent constraints. If the key rate remains around 14 percent and investment prices continue to rise much faster than consumer prices, investment would keep falling in real terms, capacity utilisation would continue to decline and potential growth would erode. Growth would remain below 1 percent, and inflation would remain above target because unit labour costs would keep rising.
Scenario C: demand stimulus. If fiscal policy loosens further, demand would rise but output would not follow because of labour and capital constraints. The result would be higher inflation, a higher GDP deflator and pressure for tighter monetary policy, with investment crowded out further.
8. Conclusion
What limits the expansion of production in Russia? The answer of this paper is that the economy is no longer constrained mainly by demand but by supply.
First, investment volumes fell by 9.9 percent in the first half of 2026 while nominal spending rose by 1.9 percent. The implied investment deflator of 13.1 percent, 7.3 points above consumer price inflation, means that about two thirds of the fall in volume is a price effect: Russia is paying more for less capital.
Second, Okun’s law shows that unemployment in Russia falls even when growth is close to zero, because the labour force is shrinking. The fall of unemployment since 2020 exceeds what growth predicts by about 0.8 points, consistent with labour withdrawn by mobilisation and emigration.
Third, unit labour costs rose by about 12 percent in the first half of 2026, in line with the GDP deflator, which shows that wage costs are driving domestic prices.
Fourth, investment remains highly sensitive to monetary conditions, with a strong negative correlation with the key rate two quarters earlier.
Taken together, these results show that the real gains from higher investment spending are being eroded by the cost of labour and capital goods. Relaxing these constraints requires productivity-enhancing investment, a lower relative price of equipment and a rebalancing of demand towards the economy’s capacity. Without these changes, additional spending will continue to produce more inflation than growth.
The indicators to watch are the quarterly investment deflator, the staffing balance in the Bank of Russia’s monitoring, real wage growth relative to productivity, and capacity utilisation.
Need this analysis for your organisation?
We prepare confidential briefings, executive talks and studies on countries, markets and policies, built on the same method as this article.
Request a briefingSupport independent analysis
Our studies are free to read and carry no advertising. If this one was useful, a small contribution helps us publish the next.
Support our workGo further: books by Global Strategy Files


Frequently asked questions
Why did investment volumes fall in Russia in 2026 while spending rose?
Investment volumes fell 9.9 percent in the first half of 2026 while nominal spending rose 1.9 percent because capital goods and construction prices rose about 13.1 percent. Had they risen like consumer prices, the real decline would have been only 3.7 percent, so about two thirds of the fall is a price effect.
Is Russia facing a labour shortage?
Yes. Unemployment fell from 5.8 percent in 2020 to 2.2 percent in 2025, about 0.8 percentage points more than economic growth would predict. This is consistent with a shrinking labour force, with workers withdrawn by mobilisation and emigration, and unemployment stops falling at growth of only 0.2 percent.
What limits the expansion of production in Russia?
Supply limits production in Russia more than demand. Workers are scarce, capital goods are expensive and unit labour costs rose about 12 percent in the first half of 2026. As a result, additional public or private spending increasingly produces higher prices rather than more output.
How do interest rates affect investment in Russia?
Investment in Russia is highly sensitive to monetary conditions. Quarterly investment growth shows a strong negative correlation of minus 0.73 with the Bank of Russia key rate two quarters earlier, so high rates weigh on capital spending with a delay of about six months.
Methodological note
All calculations were performed by the author on official data listed in Section 4. The investment deflator is implied from nominal and real growth rates. Okun’s law is estimated by ordinary least squares on annual IMF data. Unit labour costs are approximated from nominal wage growth and real GDP growth assuming stable employment. The quarterly key rate is the average of daily values. Data are available from the author on request.
References
Ball, L., Leigh, D., and Loungani, P. (2017). Okun’s law: Fit at 50? Journal of Money, Credit and Banking, 49(7), 1413 to 1441.
Bank of Russia. (2026). Monitoring of enterprises, April 2026.
Bank of Russia. (2026). Statement by Governor Elvira Nabiullina following the Board of Directors meeting on 11 September 2026.
Blanchard, O., and Galí, J. (2007). Real wage rigidities and the New Keynesian model. Journal of Money, Credit and Banking, 39(s1), 35 to 65.
Easterly, W., and Fischer, S. (1995). The Soviet economic decline. World Bank Economic Review, 9(3), 341 to 371.
Eaton, J., and Kortum, S. (2001). Trade in capital goods. European Economic Review, 45(7), 1195 to 1235.
International Monetary Fund. (2026). World Economic Outlook database, accessed through the IMF DataMapper, October 2026.
Interfax. (2026). Fixed investment in Russia fell 9.9% in the first half of 2026. September 2026.
Jorgenson, D. W. (1963). Capital theory and investment behavior. American Economic Review, 53(2), 247 to 259.
Okun, A. M. (1962). Potential GNP: Its measurement and significance. Proceedings of the Business and Economic Statistics Section of the American Statistical Association, 98 to 104.
Solow, R. M. (1957). Technical change and the aggregate production function. Review of Economics and Statistics, 39(3), 312 to 320.
The Moscow Times. (2026). Real wage growth in Russia slowed to 3.4% in June; investment fell for a second quarter. September 2026.
Trading Economics. (2026). Russia unemployment rate, August 2026.
Xinhua / The Star. (2026). Russia’s GDP grows 1.3 pct in Q2. 3 October 2026.
