
Can Services Durably Drive the British Economy? Evidence from the Monthly GDP Data of August 2026


Can Services Durably Drive the British Economy? Evidence from the Monthly GDP Data of August 2026
Driss EFFINA, PhD Independent Researcher, Global Strategy Files Reading time: about 25 minutes
Key takeaways
- UK GDP grew 0.7 percent in the three months to August 2026 and 2.1 percent on a year earlier, the fastest annual rate since August 2022.
- Services grew 0.9 percent over three months, while production fell 0.2 percent and construction 1.0 percent.
- Five knowledge-intensive industries contributed 0.93 points of the 2.1 percent annual growth, about 44 percent of the total.
- Consumer-facing services grew only 0.4 percent over three months and fell in July and August.
Abstract
According to the monthly GDP estimate published by the Office for National Statistics (ONS) on 15 October 2026, the UK economy grew by 0.7 percent in the three months to August 2026, its eighth consecutive three-month expansion, and by 2.1 percent compared with August 2025, the fastest annual rate since August 2022. The whole of this growth came from services, which expanded by 0.9 percent over three months, while production fell by 0.2 percent and construction by 1.0 percent. This article examines whether services can durably carry the British economy and pull other sectors along with them. Using the ONS sectoral data, the author estimates the contributions of each sector to growth, analyses the composition of services growth, measures the concentration of growth in a small group of knowledge-intensive industries, compares business-facing and consumer-facing services, and builds three sectoral scenarios for 2027. The results show that services accounted for slightly more than the total growth of the economy in the three months to August, and that five industries alone, led by computer programming, legal activities and scientific research and development, contributed 0.93 percentage points to the 2.1 percent annual growth of GDP, or about 44 percent of the total. Consumer-facing services, by contrast, grew by only 0.4 percent over three months and fell in July and August. The author concludes that the current expansion is real but narrow: it rests on business investment in digital, professional and research services, partly linked to artificial intelligence, while households remain cautious and goods-producing sectors stagnate. Services can sustain growth of around 1 to 1.5 percent a year on their own, but a return to growth of 2 percent or more would require a recovery of household spending and a stabilisation of construction and industry.
Keywords: United Kingdom, services sector, GDP, structural change, knowledge-intensive services, consumer-facing services, artificial intelligence, productivity, economic growth
JEL codes: E23, E32, L80, O14, O47, O52
1. Introduction
The United Kingdom has one of the most service-intensive economies in the world. Services account for about four fifths of its economic output and an even larger share of employment. Financial services, professional services, information technology, creative industries, higher education and health are among the country’s main strengths, and the UK is one of the world’s largest exporters of services. In this sense, asking whether services can drive the British economy may seem unnecessary: they already are the British economy.
The question is more subtle. It concerns three issues. First, whether the services sector can generate sustained growth on its own, without a contribution from manufacturing, energy, construction and other goods-producing activities. Second, whether the growth of services is broad-based or concentrated in a few industries. Third, whether services growth spreads to the rest of the economy, through demand for goods, investment and employment, or remains confined to its own sphere.
These questions are particularly relevant in 2026. The monthly GDP data published on 15 October show that growth in the three months to August was entirely driven by services, with production and construction declining. At the same time, the economy faces an energy price shock, rising interest rate expectations and a Budget that may raise taxes. Understanding the nature of services growth is therefore important for assessing the outlook.
This article uses the ONS release “GDP monthly estimate, UK: August 2026” as its main source. Section 2 sets out the context. Section 3 reviews the literature on services and growth. Section 4 describes the data and methods. Section 5 presents the results. Section 6 discusses them. Section 7 presents scenarios for 2027. Section 8 concludes.
2. Context
2.1 A service economy
The shift of the British economy towards services has been under way for more than half a century. Manufacturing, which accounted for about a quarter to a third of output in the 1970s, now represents less than a tenth. The decline of heavy industry, the growth of the City of London after financial deregulation in the 1980s, the expansion of public services and the rise of digital industries have all contributed.
This structure has advantages. Services are less exposed than manufacturing to the volatility of global goods trade and commodity prices. Many services, especially professional and digital services, have high value added and are exported to the rest of the world. The UK has a comparative advantage in several of them, linked to the English language, its legal system, its universities and its financial centre.
It also has disadvantages. Some services, especially those provided to consumers and by the public sector, have low measured productivity growth. The concentration of high-value services in London and the South East has contributed to large regional inequalities. And an economy dominated by services may be more sensitive to household confidence and to the regulatory environment for finance and technology.
2.2 The recent path of growth
The UK economy grew slowly after the pandemic. The OBR’s March 2026 forecast expected growth of 1.1 percent in 2026 and 1.6 percent in 2027, and the average of independent forecasts compiled by HM Treasury in September 2026 was 1.2 percent for both years. GDP grew by 0.6 percent in the first quarter of 2026 and 0.5 percent in the second quarter, better than most forecasters expected.
The August data confirmed this resilience. Monthly GDP grew by 0.1 percent in August, after 0.4 percent in both June and July. Analysts had expected a small contraction. Over the three months to August, growth was 0.7 percent, after upward revisions of the three months to June and July to 0.5 percent each.
2.3 The external environment
This resilience is remarkable given the environment. As discussed in the first article on the United Kingdom in this series, an energy price shock linked to the conflict in the Middle East has pushed inflation back to 3.1 percent in August, wholesale electricity and gas prices are more than double their level of a year earlier, and the Bank of England has held its rate at 3.75 percent with three members voting for an increase. The ONS reported that in late September, 72 percent of businesses were concerned about energy prices, and 91 percent in accommodation and food services. Business surveys also pointed to weaker consumer demand, housing activity and labour market conditions in September.
2.4 How services output is measured
Measuring the output of services is more difficult than measuring the output of goods. For a car factory, the number of cars produced and their prices give a reasonably clear picture of real output. For a law firm, a software company or a hospital, the “quantity” of output is harder to define. The ONS relies mainly on the turnover of businesses, collected through its Monthly Business Survey and deflated by price indices, and for some public services on indicators of activity such as the number of patients treated or pupils taught.
These methods have limitations that matter for the interpretation of the data. Turnover can rise because of higher prices rather than higher volumes if the price indices used to deflate it do not fully capture changes in quality or in the mix of services. In fast-changing industries such as software and digital services, quality improvements are particularly difficult to measure. Conversely, some free or low-cost digital services may be under-recorded. The growth rates of individual service industries should therefore be interpreted as indicative of trends rather than as precise measures, especially at the monthly frequency.
3. Literature review
The relationship between services and economic growth has been studied for a long time, and the literature provides several useful frameworks.
The first is Baumol’s “cost disease”. Baumol (1967) argued that many services, such as live performances, education or health care, have limited scope for productivity growth because they rely on human labour that cannot easily be replaced. As the economy develops, the share of these services in output and employment rises, and aggregate productivity growth tends to slow. This hypothesis has been used to explain the slowdown of productivity in advanced economies, but it applies much less to digital and professional services, where productivity growth can be high.
The second concerns the role of manufacturing as an “engine of growth”. Kaldor (1966), studying the slow growth of the UK economy in the 1960s, argued that manufacturing was the main source of productivity growth because of increasing returns to scale. Rodrik (2016) documented “premature deindustrialisation” in developing economies and warned that service-led growth may be less dynamic. More recent research, however, shows that some services, especially those that can be traded and that use information technology intensively, can generate productivity growth similar to or higher than manufacturing.
The third strand concerns structural change in advanced economies. Jorgenson and Timmer (2011) showed that in Europe, Japan and the United States, the bulk of employment and output growth in recent decades has taken place in services, and that the most dynamic services are business services, finance and information. They also showed that the distinction between goods and services is becoming less relevant, as manufacturing firms increasingly sell services and services firms use advanced technology.
The fourth strand concerns intangible capital. Haskel and Westlake (2018) showed that modern economies invest increasingly in intangible assets, such as software, data, research and development, design and organisational capital, rather than in machinery and buildings. Much of this investment is produced by service industries, such as computer programming, research and professional services. This helps explain why business services can grow rapidly even when traditional investment in equipment and construction is weak.
The fifth concerns general purpose technologies. Brynjolfsson, Rock and Syverson (2021) described a “productivity J-curve”: when a new technology such as artificial intelligence is introduced, firms first invest in complementary intangible assets, such as software, data and training, which raises measured output in the industries that produce these assets but may initially reduce measured productivity in the adopting firms. The growth of computer programming and related services in the UK in 2026 may reflect such an investment phase.
4. Data and methodology
4.1 Data
The main source is the ONS statistical bulletin “GDP monthly estimate, UK: August 2026”, published on 15 October 2026. It provides monthly and three-month growth rates for GDP and its main components (services, production, construction), detailed growth rates for service industries and sub-industries, contributions of selected industries to annual growth, and information on revisions and survey response rates. Additional information comes from the House of Commons Library briefing on GDP indicators, which reports the OBR and HM Treasury survey forecasts.
4.2 Contributions to growth
The contribution of a sector to GDP growth is approximately its growth rate multiplied by its weight in total output. The ONS does not report three-month contributions for the main sectors in the bulletin text. The author therefore uses approximate output weights: about 80 percent for services, 13.5 percent for production and 6 percent for construction, with the remainder for agriculture. These weights are close to the shares used in the UK output approach to GDP, but should be treated as approximations. The difference between the sum of contributions and actual GDP growth reflects agriculture, rounding and the approximation of weights.
4.3 Concentration of growth
The ONS reports the contributions of the five industries that contributed most to annual GDP growth in August 2026. The author sums these contributions and expresses them as a share of the annual growth rate of GDP.
4.4 Business and consumer services
The ONS publishes a series for consumer-facing services, which includes retail, food and beverage services, accommodation, travel, recreation and personal services. The author compares this series with total services, to distinguish the contribution of household spending from that of business spending. As an illustration, if consumer-facing services represent roughly 30 percent of services output, the growth of other services can be inferred from the total.
4.5 Scenarios
Scenarios for 2027 combine assumed growth rates for services, production and construction with the approximate output weights to obtain implied GDP growth.
4.6 Limitations
Monthly GDP data are volatile and subject to revision. The ONS noted that response rates to its business surveys for August were 88.7 percent for services, 90.4 percent for production and 85.4 percent for construction, and that it expects these to rise; estimates may therefore be revised. The weights are approximate. The scenarios are illustrative.
5. Results
5.1 Services alone are expanding
Figure 1 shows three-month growth for GDP and its main components in the three latest periods.
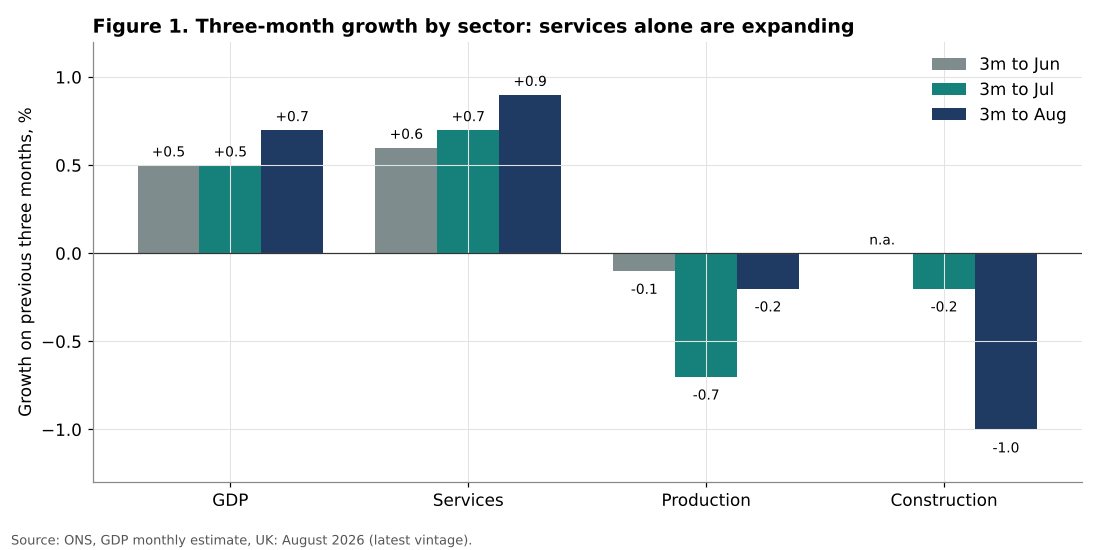
In each of the three latest three-month periods, services have grown and production has fallen or been flat. In the three months to August, services grew by 0.9 percent, their strongest rate in the period, while production fell by 0.2 percent and construction by 1.0 percent. The pattern is consistent: the expansion of the economy is a services expansion.
| Sector | 3 months to June | 3 months to July | 3 months to August |
|---|---|---|---|
| GDP | +0.5 | +0.5 | +0.7 |
| Services | +0.6 | +0.7 | +0.9 |
| Production | -0.1 | -0.7 | -0.2 |
| Construction | n.a. | -0.2 | -1.0 |
Table 1. Three-month growth on previous three months, percent. Source: ONS, August 2026 release (latest vintage).
On an annual basis, services grew by 2.2 percent in the three months to August compared with a year earlier, against 1.8 percent for GDP as a whole. Production grew by 0.8 percent over the year to August, and construction fell by 1.6 percent.
5.2 Contributions to growth
Figure 2 shows the estimated contributions of each sector to GDP growth in the three months to August.
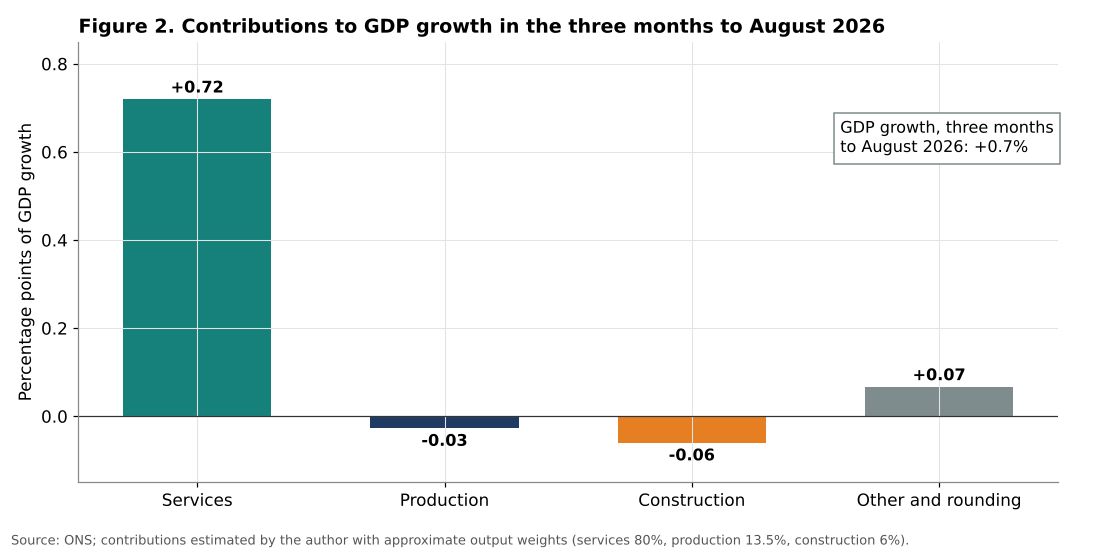
With an approximate weight of 80 percent and growth of 0.9 percent, services contributed about 0.72 percentage points to GDP growth. Production subtracted about 0.03 points, and construction about 0.06 points. The remaining difference with actual GDP growth of 0.7 percent (about 0.07 points) reflects agriculture, rounding and the approximation of weights.
In other words, services accounted for slightly more than 100 percent of the growth of the economy over the period. Without services, the UK economy would have contracted. This is not unusual for an economy in which services represent four fifths of output, but the fact that both production and construction declined simultaneously means that the economy is currently running on a single engine.
5.3 A two-speed services sector
Figure 3 shows the growth of the main service industries and sub-industries in the three months to August.
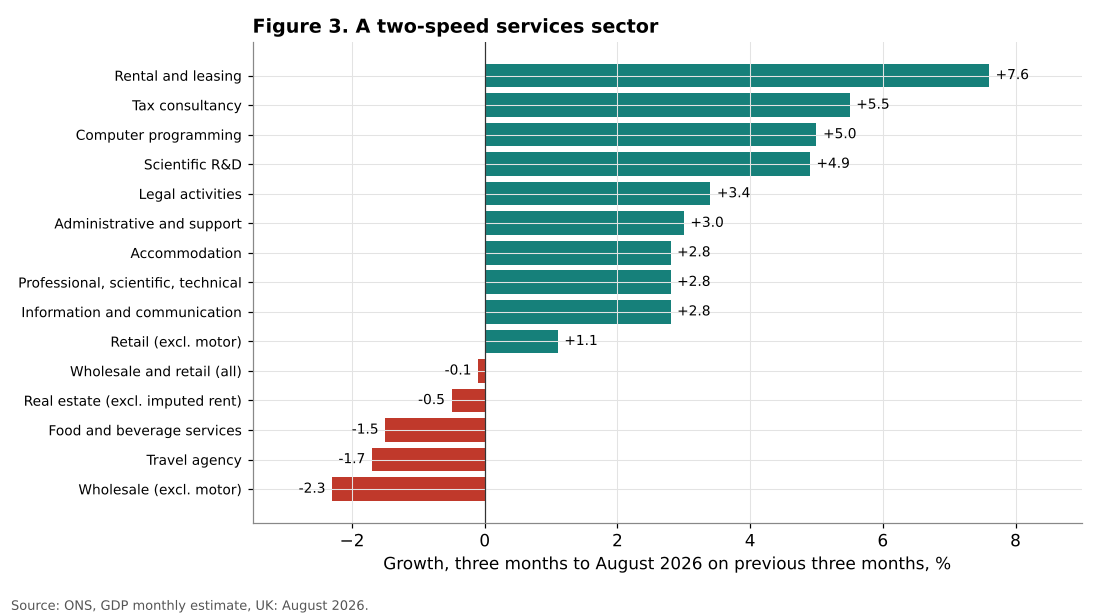
The services sector itself is far from homogeneous. Output rose in 10 of the 14 service sectors, but the strongest growth was concentrated in business services. Administrative and support services grew by 3.0 percent, with rental and leasing up 7.6 percent and building services up 5.9 percent. Professional, scientific and technical activities grew by 2.8 percent, led by tax consultancy (5.5 percent), scientific research and development (4.9 percent) and legal activities (3.4 percent). Information and communication grew by 2.8 percent, with computer programming, consultancy and related activities up 5.0 percent. Accommodation also grew by 2.8 percent.
At the other end, several consumer and trade-related services declined. Food and beverage services fell by 1.5 percent, travel agency services by 1.7 percent, and real estate excluding imputed rent by 0.5 percent. Wholesale trade excluding motor vehicles fell by 2.3 percent over the three months, although it rebounded by 3.8 percent in August after five consecutive monthly falls, and remained 1.6 percent below its level of February 2026.
This divergence is the central feature of the current expansion. Industries that sell to businesses, especially in digital, professional and research activities, are growing rapidly. Industries that sell to households, especially discretionary spending on eating out, travel and leisure, are stagnating or falling.
5.4 The concentration of growth
Figure 4 shows the contributions of five industries to annual GDP growth in August 2026.
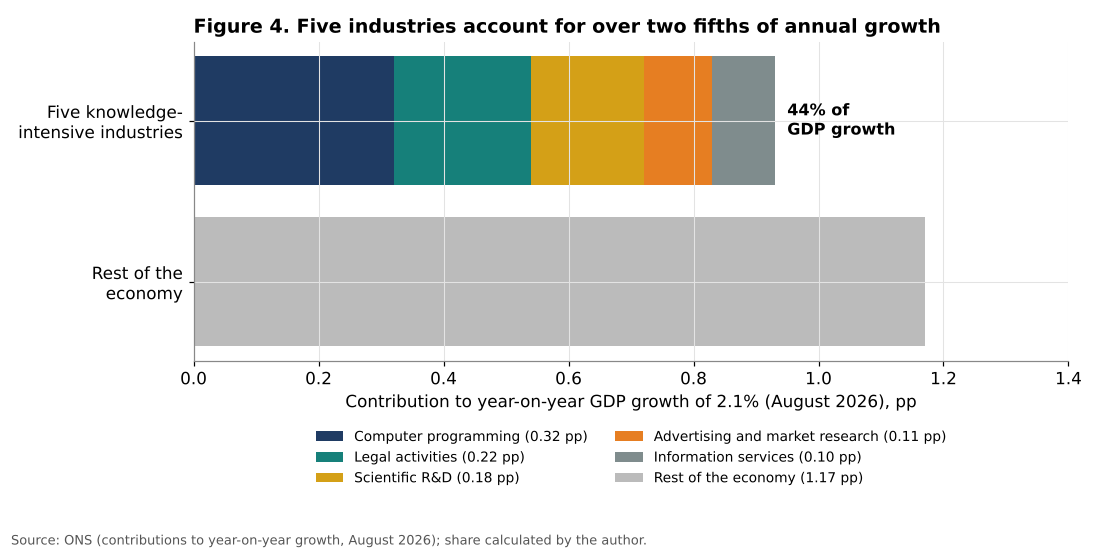
The ONS identified five industries as the main contributors to annual growth: computer programming (0.32 percentage points), legal activities (0.22 points), scientific research and development (0.18 points), advertising and market research (0.11 points) and information services (0.10 points). Together, they contributed 0.93 percentage points to the 2.1 percent annual growth of GDP, and 1.15 points to the annual growth of services.
According to the author’s calculation, these five industries account for about 44 percent of the annual growth of the whole economy. Their combined weight in total output is much smaller than this share, probably in the order of a few percent, which means that their growth rates are several times higher than the average. Computer programming has been the largest single contributor to growth for six consecutive months, according to the ONS.
This concentration has two implications. On the positive side, these are high value added, often exportable activities, whose growth reflects the UK’s comparative advantages and may raise productivity. On the negative side, growth that depends on a small number of industries is fragile. A reversal of business spending on digital services, for example if the investment cycle linked to artificial intelligence slows, would have a large effect on aggregate growth.
5.5 Businesses spend, households hesitate
Figure 5 compares total services with consumer-facing services.
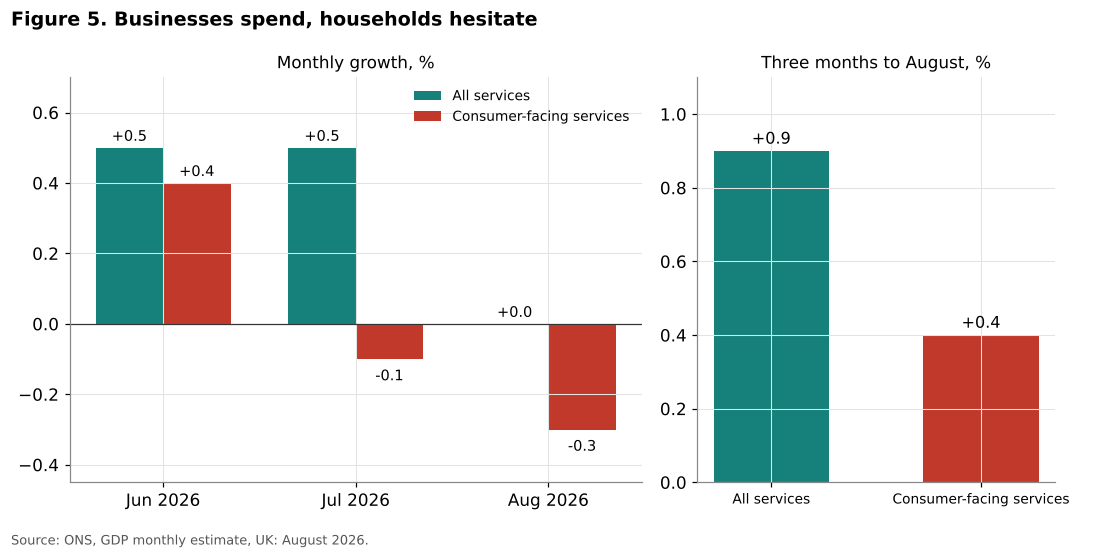
Consumer-facing services grew by 0.4 percent in the three months to August, less than half the growth of total services (0.9 percent). On a monthly basis, they grew by 0.4 percent in June, then fell by 0.1 percent in July and 0.3 percent in August. In August, sports, amusement and recreation activities fell by 7.1 percent and food and beverage services by 2.7 percent, while retail and wholesale trade rose.
If consumer-facing services represent roughly 30 percent of total services output, as an illustrative assumption, the growth of the remaining services would be about 1.1 percent over the three months to August, nearly three times faster than consumer-facing services. Whatever the exact weight, the gap between business-oriented and household-oriented services is large.
This pattern is consistent with other evidence on the behaviour of households. The household saving ratio was 8.9 percent in the first quarter of 2026, above its pre-pandemic average. Real wages in the private sector are falling slightly as inflation has risen above wage growth. Households face higher energy bills and rising mortgage rates. A Capital Economics economist described the economy as showing a split between business strength and cautious households, a description that matches the data.
5.6 Spillovers to other sectors
The question of whether services can pull the rest of the economy along depends on their links with other sectors. The August data give some indications.
In production, manufacturing grew by only 0.1 percent over three months, but some industries linked to digital investment performed well: computer, electronic and optical products grew by 3.5 percent, and machinery and equipment by 1.8 percent. In August alone, manufacturing rose by 1.2 percent, led by basic pharmaceuticals (5.1 percent). Energy-intensive industries, by contrast, declined: basic metals fell by 2.7 percent and rubber, plastics and non-metallic minerals by 2.5 percent over three months, reflecting the pressure of energy costs.
In construction, output fell by 1.0 percent over three months, with new private housing down 3.2 percent. The strong growth of business services has not translated into demand for new commercial buildings or housing. The decline of construction is examined in detail in the next article in this series.
These observations suggest that services growth has some spillovers to technology-related manufacturing, but that it is not strong enough to offset the effect of energy costs on heavy industry or of interest rates on construction. The services engine is pulling only a part of the train.
5.7 Revisions and data quality
The interpretation of monthly data must take into account revisions. In the August release, the ONS revised up the growth of services for several months, by 0.1 to 0.2 percentage points. Construction revisions were larger, including a revision of July from growth of 0.1 percent to a fall of 0.5 percent. Response rates to business surveys were below normal levels. These factors mean that the picture could change, but the general pattern of strong business services, weak consumer services and declining construction has been consistent over several months and several releases.
5.8 Services, employment and productivity
The services expansion also has implications for employment and productivity, although the monthly GDP release does not provide employment data. Business services such as programming, legal and research activities have high output per worker. Growth concentrated in these industries tends to raise average productivity, through a composition effect, even if productivity within each industry does not change. Consumer-facing services such as hospitality and leisure, by contrast, employ many workers with relatively low output per worker. When these industries stagnate while high-productivity services grow, aggregate measured productivity improves, but the gains in employment are smaller than the gains in output.
This composition effect is one reason why the UK can record relatively solid GDP growth while the labour market loosens. The Bank of England reported that unemployment had risen to 4.9 percent in the three months to July 2026, while GDP growth was accelerating. Growth driven by capital-intensive and skill-intensive services creates fewer jobs per unit of output than growth driven by hospitality, retail or construction. For workers in the latter sectors, the current expansion may therefore feel much weaker than the headline figures suggest.
There is also a question of wages. High-productivity services pay high wages, which supports income tax receipts, as noted in the previous article in this series on public finances, where income-related taxes were growing by 6.6 percent in the first five months of 2026-27. The concentration of growth in these industries helps explain the strength of tax receipts despite modest overall growth.
6. Discussion
6.1 A real but narrow expansion
The results show that the UK expansion of 2026 is real: GDP has grown for eight consecutive three-month periods, and annual growth reached 2.1 percent in August, the highest since 2022. But it is narrow, resting on a limited number of service industries that sell mainly to businesses.
This pattern is not necessarily negative. The industries that are growing are among the most productive and most internationally competitive in the UK economy. Their growth reflects business investment in intangible assets, such as software, research and professional advice, which is precisely the type of investment that modern economies need to raise productivity. In this sense, the composition of growth is healthier than in periods driven mainly by household consumption financed by credit.
6.2 The role of artificial intelligence
It is tempting to attribute the growth of computer programming and related services to the boom in artificial intelligence. Several economists have made this connection, and it is plausible: businesses are investing in AI applications, data infrastructure and the adaptation of their processes, which requires programming, consulting and legal services. However, the ONS data do not identify AI-related activity separately, and no official source quantifies the share of growth linked to AI. The author therefore treats this explanation as a hypothesis consistent with the data rather than as an established fact.
If the hypothesis is correct, the framework of Brynjolfsson, Rock and Syverson (2021) suggests that the UK may be in the investment phase of a productivity J-curve, in which output of the producers of intangible assets rises first, and productivity gains in the adopting firms come later. This would be favourable for medium-term growth, but it also means that the current growth depends on the continuation of an investment cycle that could slow.
6.3 Can services carry growth alone?
The arithmetic of the sectoral weights gives a clear answer to the question in the title. With services accounting for about 80 percent of output, services growth of 1.5 percent a year generates about 1.2 percentage points of GDP growth on its own. Services growth of 2.2 percent, as observed over the past year, generates about 1.8 points. Production and construction, which together account for about a fifth of output, can add or subtract a few tenths of a point.
Services can therefore sustain moderate growth on their own, roughly in line with the UK’s estimated potential growth rate. But they cannot easily generate strong growth if other sectors are declining and if household-oriented services, which represent a large part of the services total, are stagnant. A sustained expansion at 2 percent or more requires the participation of households and a stabilisation of construction and industry.
6.4 Policy implications
Three policy implications follow from the analysis.
First, the growth of knowledge-intensive services depends on factors that public policy can influence: the supply of skilled workers, including through immigration and education; the regulatory environment for technology and professional services; access to international markets for services exports; and the availability of energy and digital infrastructure. Policies that weaken any of these factors would affect the main source of current growth.
Second, the weakness of consumer-facing services reflects pressure on household incomes. Fiscal decisions in the Budget, especially on taxes affecting households, will influence this segment. Measures that further reduce disposable income could deepen the divergence between business and consumer services.
Third, the decline of energy-intensive industries and construction suggests that the energy shock and interest rates are the main constraints on the rest of the economy. The Bank of England’s decisions and the evolution of energy prices will therefore determine whether the expansion broadens or remains narrow.
6.5 Regional dimension
Knowledge-intensive services are concentrated in London, the South East and a few other cities. Their growth therefore tends to widen regional disparities, while consumer-facing services, construction and manufacturing are more evenly distributed across the country. A services-led expansion of the type observed in 2026 may coexist with stagnation in many regions. This is an important consideration for policies aimed at reducing regional inequalities.
6.6 Services trade and the external balance
A distinctive feature of the UK’s services sector is its international orientation. The UK runs a large surplus on trade in services, which partly offsets its deficit on trade in goods. Many of the industries that are growing fastest, including programming, legal services, research and development and advertising, sell a substantial part of their output to foreign clients. Their growth therefore depends not only on domestic demand, but on global demand for professional and digital services, which has been supported by investment in artificial intelligence around the world.
This international dimension has two consequences. First, it makes UK services growth less dependent on the domestic business cycle, which helps explain why business services are growing while UK households are cautious. Second, it exposes the UK to changes in global conditions, such as a slowdown in technology investment in the United States, regulatory changes affecting cross-border data flows, or restrictions on the mobility of skilled workers. The resilience of services exports has been one of the main reasons why the UK economy has been able to adjust to the loss of some goods trade with the European Union since 2021, but services trade also faces barriers that have increased since that time.
6.7 Lessons from earlier services-led expansions
The UK has experienced services-led expansions before. In the decade before the financial crisis of 2008, growth was driven largely by financial services and by household consumption financed by rising house prices and credit. That expansion proved fragile: when the financial crisis hit, the sectors that had driven growth contracted sharply, and the economy suffered one of the deepest recessions among advanced economies. The lesson commonly drawn from that episode is that the composition of growth matters as much as its rate.
The current expansion differs in several respects. It is driven by business investment in intangible assets rather than by household credit. Household saving is relatively high rather than low. And the leading industries are diversified across programming, legal, research and advertising activities rather than concentrated in a single sector such as finance. These differences suggest that the current expansion is less exposed to a financial shock of the type seen in 2008. However, it shares one feature with that earlier period: a heavy dependence on a narrow set of high-value activities concentrated in a few regions, with limited spillovers to the rest of the economy. Policymakers who wish to make the expansion more durable will therefore need to pay attention not only to its pace, but to its breadth.
7. Scenarios for 2027
7.1 Three sectoral paths
Figure 6 presents three illustrative scenarios for GDP growth in 2027, based on assumed growth rates for services, production and construction.
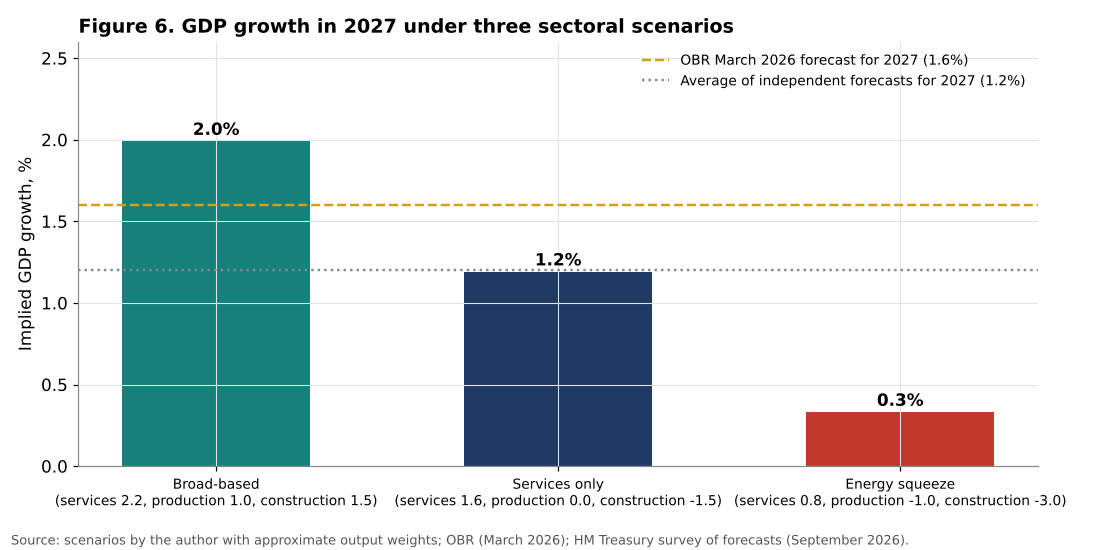
Scenario 1: Broad-based expansion. Services continue to grow at 2.2 percent, the rate of the past year, while production recovers to 1.0 percent and construction to 1.5 percent, as energy prices fall and interest rates stabilise. Implied GDP growth is about 2.0 percent, above the OBR’s March forecast of 1.6 percent.
Scenario 2: Services only. Services slow to 1.6 percent as consumer spending remains weak, while production is flat and construction continues to decline by 1.5 percent. Implied GDP growth is about 1.2 percent, in line with the average of independent forecasts compiled by HM Treasury.
Scenario 3: Energy squeeze. A prolonged energy shock and tighter monetary policy reduce services growth to 0.8 percent, with production falling by 1.0 percent and construction by 3.0 percent. Implied GDP growth is only about 0.3 percent.
7.2 Assessment
The author considers scenario 2 the most likely in the short term. The divergence between business and consumer services is likely to persist as long as real household incomes are under pressure, and construction and energy-intensive industry are unlikely to recover quickly in an environment of high energy prices and rising interest rates. Scenario 1 would require a rapid easing of the energy shock and an improvement in household confidence. Scenario 3 would materialise if the conflict in the Middle East intensified further and the Bank of England had to raise rates significantly.
7.3 Indicators to watch
The following indicators will help determine which scenario is unfolding:
1. The monthly growth of consumer-facing services and retail sales. 2. The contribution of computer programming and professional services to growth. 3. Output of energy-intensive manufacturing industries. 4. Construction output, especially new private housing. 5. Business surveys on investment intentions and energy concerns.
8. Conclusion
The data published on 15 October 2026 show that the British economy is growing more strongly than expected, but that its growth rests almost entirely on services, and within services on a small group of business-oriented industries.
The main findings of this article are:
1. Services grew by 0.9 percent in the three months to August 2026, while production fell by 0.2 percent and construction by 1.0 percent. Services contributed slightly more than the total growth of GDP. 2. Five knowledge-intensive industries, led by computer programming, legal activities and scientific research, contributed 0.93 percentage points to annual GDP growth of 2.1 percent, about 44 percent of the total. 3. Consumer-facing services grew by only 0.4 percent over three months and fell in July and August, reflecting cautious households. 4. Spillovers from services to the rest of the economy are limited to technology-related manufacturing; energy-intensive industry and construction are declining. 5. With a weight of about 80 percent, services can sustain GDP growth of around 1 to 1.5 percent a year on their own, but not much more.
Services can therefore durably support the British economy, but they cannot carry it alone to strong growth. The quality of the current expansion, based on investment in intangible assets and high value added activities, is encouraging for the long term. Its narrowness is a source of vulnerability in the short term. Broadening the expansion to households, construction and industry is the main challenge for economic policy in the coming year.
Need this analysis for your organisation?
We prepare confidential briefings, executive talks and studies on countries, markets and policies, built on the same method as this article.
Request a briefingSupport independent analysis
Our studies are free to read and carry no advertising. If this one was useful, a small contribution helps us publish the next.
Support our workGo further: books by Global Strategy Files


Frequently asked questions
How fast is the UK economy growing in 2026?
UK GDP grew by 0.7 percent in the three months to August 2026, its eighth consecutive three-month expansion, and by 2.1 percent compared with August 2025, the fastest annual rate since August 2022, according to the ONS.
Which sectors drive UK growth in 2026?
Services drive all of it. Services expanded 0.9 percent over three months while production fell 0.2 percent and construction 1.0 percent. Five industries, led by computer programming, legal activities and scientific research, contributed about 44 percent of annual GDP growth.
Are UK consumers spending more in 2026?
Not much. Consumer-facing services grew by only 0.4 percent in the three months to August 2026 and fell in both July and August, which shows that households remain cautious while business-facing digital and professional services expand.
Can services alone sustain UK growth?
Services can sustain growth of around 1 to 1.5 percent a year on their own. A return to growth of 2 percent or more would require a recovery of household spending and a stabilisation of construction and industry.
Methodological note
All calculations in this article were carried out by the author using the ONS statistical bulletin “GDP monthly estimate, UK: August 2026” (15 October 2026). Contributions to three-month growth are estimated with approximate output weights (services 80 percent, production 13.5 percent, construction 6 percent). The share of five industries in annual GDP growth uses the ONS-reported contributions. The illustration of non-consumer services growth assumes a 30 percent share of consumer-facing services in total services. Scenarios for 2027 apply the approximate weights to assumed sectoral growth rates. Monthly data are subject to revision. The scenarios are illustrative and do not constitute forecasts.
References
Baumol, W. J. (1967). Macroeconomics of Unbalanced Growth: The Anatomy of Urban Crisis. American Economic Review, 57(3), 415 to 426.
Brynjolfsson, E., Rock, D. and Syverson, C. (2021). The Productivity J-Curve: How Intangibles Complement General Purpose Technologies. American Economic Journal: Macroeconomics, 13(1), 333 to 372.
Haskel, J. and Westlake, S. (2018). Capitalism without Capital: The Rise of the Intangible Economy. Princeton University Press.
House of Commons Library (2026). Gross domestic product (GDP): Economic indicators. Research Briefing SN02783. London.
Jorgenson, D. W. and Timmer, M. P. (2011). Structural Change in Advanced Nations: A New Set of Stylised Facts. Scandinavian Journal of Economics, 113(1), 1 to 29.
Kaldor, N. (1966). Causes of the Slow Rate of Economic Growth of the United Kingdom: An Inaugural Lecture. Cambridge University Press.
Office for Budget Responsibility (2026). Economic and fiscal outlook, March 2026. London.
Office for National Statistics (2026). GDP monthly estimate, UK: August 2026. Statistical bulletin, 15 October 2026. Newport.
Rodrik, D. (2016). Premature Deindustrialization. Journal of Economic Growth, 21(1), 1 to 33.
