
Does the Decline of Construction Threaten the UK Recovery? Housing Supply, Employment and Investment in 2026

Does the Decline of Construction Threaten the UK Recovery? Housing Supply, Employment and Investment in 2026
Driss EFFINA, PhD Independent Researcher, Global Strategy Files Reading time: about 25 minutes
Key takeaways
- UK construction output fell 1.0 percent in the three months to August 2026 and 1.6 percent on a year earlier.
- New private housing output fell 3.2 percent over three months, an annualised decline of about 12 percent.
- The direct drag of construction on UK GDP was small, about 0.06 percentage points over three months.
- The decline moves housing supply further from the 300,000 homes a year needed to deliver 1.5 million homes in five years.
Abstract
While the UK economy grew by 0.7 percent in the three months to August 2026, construction output fell by 1.0 percent, its second consecutive three-month decline, and by 1.6 percent compared with a year earlier. Monthly output decreased for the fourth month in a row in August. New work fell by 1.4 percent over three months and new private housing by 3.2 percent, while repair and maintenance was almost stable. This article examines whether the decline of construction threatens the broader recovery and the government’s objectives for housing supply. Using the data of the Office for National Statistics (ONS) published on 15 October 2026, the author decomposes the decline by type of work, quantifies its contribution to GDP, assesses the reliability of the construction data through the size of recent revisions, calculates the effect of higher mortgage rates on a typical loan, examines the output of the industries that supply construction materials, and builds illustrative paths for housing supply and three scenarios for construction output to the end of 2027. The results show that the direct drag of construction on GDP is small, about 0.06 percentage points over three months, but that the decline is concentrated in new private housing, whose output is falling at an annualised rate of about 12 percent. If this trend continued, the supply of new homes would move further away from the rate of about 300,000 a year needed to deliver 1.5 million homes over five years. The author concludes that the decline of construction does not threaten the recovery in the short term, but it does threaten its quality and durability, because it weakens housing supply, a key condition for productivity, labour mobility and affordability.
Keywords: United Kingdom, construction, housing supply, new housing, interest rates, mortgages, energy costs, building materials, investment, economic recovery
JEL codes: E22, E32, L74, R21, R31
1. Introduction
Construction is a small sector in terms of its share of output, around 6 percent of the UK economy, but it plays a disproportionate role in economic life. It builds the homes in which people live, the offices, factories and warehouses in which they work, and the roads, railways, power lines and water networks on which the economy depends. It employs around two million people, many of them self-employed and many outside the large cities. And it is highly sensitive to interest rates, credit conditions and confidence, which makes it one of the first sectors to react to changes in the economic cycle.
For these reasons, construction is often seen as a leading indicator. A decline in construction output can signal a broader slowdown, as investors and households postpone spending. It can also weaken the supply side of the economy over time, by reducing the stock of housing and infrastructure.
In 2026, construction is moving in the opposite direction to the rest of the economy. As shown in the previous article in this series, the UK economy is growing thanks to services, especially business services linked to digital technology and professional activities. Construction, by contrast, has declined for four consecutive months. This article asks whether this divergence matters, and if so, how.
The analysis addresses four questions. Where is the decline concentrated? How large is its effect on GDP? What are its causes? And what are its consequences for housing supply, employment and investment?
Section 2 sets out the context. Section 3 reviews the literature on construction, housing supply and the economic cycle. Section 4 describes the data and methods. Section 5 presents the results. Section 6 discusses them. Section 7 presents scenarios. Section 8 concludes.
2. Context
2.1 Construction in the UK economy
The UK construction sector covers three broad types of activity: new housing (private and public), other new work (infrastructure, industrial and commercial buildings, and public buildings such as schools and hospitals), and repair and maintenance of existing buildings and structures. New work accounts for the larger part of output, with repair and maintenance representing a substantial share, which tends to be more stable over the cycle.
The sector is characterised by a large number of small firms and self-employed workers, a high reliance on subcontracting and a strong sensitivity to the cost of materials and labour. It also depends heavily on the planning system, which determines where and how much can be built.
2.2 The housing objective
Housing supply has been a central political issue in the United Kingdom for many years. House prices and rents have risen much faster than incomes over several decades, making housing less affordable, particularly for younger people. Successive governments have set targets for new housing. The current government has committed to delivering 1.5 million new homes in England over the course of the Parliament, which implies an average of about 300,000 homes a year. It has also introduced reforms to the planning system aimed at making it easier to build.
Recent rates of net additions to the housing stock in England have been well below this level, at a little over 200,000 a year in recent years according to official estimates. Achieving the target therefore requires a substantial and rapid increase in housebuilding.
2.3 The economic environment
Construction faces several headwinds in 2026. First, interest rates: the Bank of England has held Bank Rate at 3.75 percent, but market expectations of future rates have risen sharply since the escalation of the conflict in the Middle East, and the Bank reported that the two-year fixed mortgage rate was about 95 basis points higher in September than before the conflict. Second, energy: wholesale electricity and gas prices are more than double their level of a year earlier, according to the ONS, which raises the cost of energy-intensive building materials such as cement, bricks, glass and steel. Third, confidence: business surveys point to weaker housing activity in September 2026.
2.4 The data release of 15 October 2026
The ONS published its construction output data for August 2026 together with the monthly GDP estimate on 15 October. The release showed a fall of 0.2 percent in August, the fourth consecutive monthly decrease, and a fall of 1.0 percent over the three months to August. July was revised from growth of 0.1 percent to a fall of 0.5 percent, and June from a fall of 0.1 percent to a fall of 0.3 percent. The base year for the construction statistics was updated to 2024, and a data error affecting public new housing since January 2022 was corrected.
3. Literature review
The literature provides three relevant perspectives on the role of construction and housing in the economy.
The first concerns the link between housing and the business cycle. Leamer (2007), in a paper presented at the Federal Reserve Bank of Kansas City’s Jackson Hole symposium, argued that “housing is the business cycle” in the United States: residential investment tends to decline well before recessions and contributes a large share of the weakness in output during downturns. Although the UK economy differs in many respects, the cyclical sensitivity of housebuilding is a common feature of advanced economies.
The second concerns the determinants of housing supply. Glaeser and Gyourko (2018) showed that in many areas of the United States, house prices are far above construction costs because of regulatory constraints on supply. In England, Hilber and Vermeulen (2016) found that regulatory constraints, especially the planning system, have had a large effect on house prices, more than physical constraints such as the availability of land. The Barker Review of Housing Supply (2004), commissioned by the UK Treasury, concluded that a substantial increase in housebuilding was needed to improve affordability and recommended reforms to the planning system. These findings suggest that housing supply in the UK is constrained by structural factors as well as by the economic cycle.
The third concerns the macroeconomic effects of housing supply. A lack of housing in the most productive areas limits the ability of workers to move to where jobs are, which reduces productivity. Higher housing costs also reduce disposable income and can increase inequality between homeowners and renters. Conversely, construction investment can have significant multiplier effects through supply chains and employment.
This article contributes to the literature by analysing the 2026 decline of UK construction in real time, with particular attention to the composition of the decline, the reliability of the data and the implications for housing supply objectives.
4. Data and methodology
4.1 Data
The main sources are the ONS releases “Construction output in Great Britain: August 2026” and “GDP monthly estimate, UK: August 2026”, both published on 15 October 2026. They provide monthly and three-month growth rates for construction output, by type of work, together with information on revisions and survey response rates. Additional information comes from the Bank of England’s Monetary Policy Summary of September 2026 on mortgage rates, and from the ONS GDP release on manufacturing industries that produce construction materials.
4.2 Decomposition by type of work
The contribution of each type of work to the change in total construction output is approximately its growth rate multiplied by its share in total output. The author uses approximate shares of 63 percent for new work and 37 percent for repair and maintenance. With these shares, the contributions of the two components sum to a decline of 0.99 percent, consistent with the published total of 1.0 percent, which supports the approximation. To estimate the contribution of new private housing, the author assumes an illustrative share of 35 percent of new work.
4.3 Contribution to GDP
The contribution of construction to GDP growth is estimated with an approximate weight of 6 percent of total output.
4.4 Data reliability
The ONS publishes a table of revisions to monthly growth rates for GDP and its main sectors between the previous release and the current one, for January to July 2026. The author calculates the mean absolute revision for each sector as a simple measure of data uncertainty.
4.5 Mortgage repayments
The effect of higher mortgage rates is illustrated by the monthly repayment of a £250,000 repayment mortgage over 25 years at rates of 4.50 percent, 5.45 percent (an increase of 95 basis points, corresponding to the increase in two-year fixed rates reported by the Bank of England) and 6.00 percent. The baseline rate of 4.50 percent is illustrative.
4.6 Housing supply paths
The author constructs illustrative paths for net additions to the housing stock, starting from an approximate level of 210,000 a year, under three assumptions: a continuation of the current decline of new private housing output (about -12 percent a year, the annualised rate of the three-month fall), stabilisation, and a recovery of 10 percent a year. These paths are compared with the rate of 300,000 a year implied by the target of 1.5 million homes over five years. This is a simplification: output and completions are not the same, and there are lags between them.
4.7 Limitations
The approximate shares and weights are not official. The housing paths are illustrative. Construction data are subject to large revisions, as shown below. The ONS noted that response rates to its construction survey were lower than usual in recent months, and that it expects them to rise.
5. Results
5.1 A sector moving against the cycle
Figure 1 shows monthly growth of construction and GDP from June to August 2026, and the three-month and annual changes in construction output.
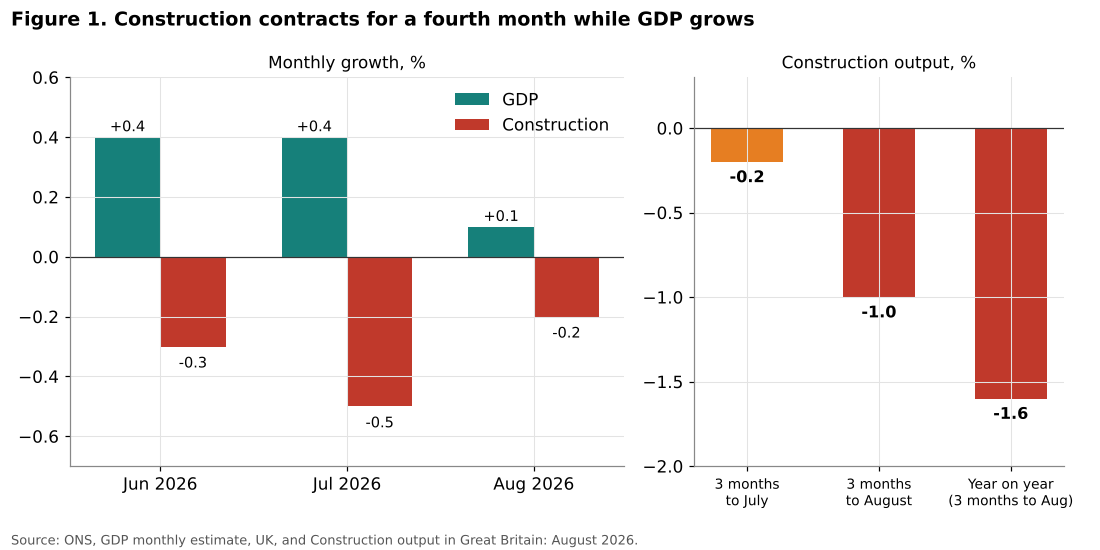
In each of the three months from June to August, GDP grew while construction fell: by 0.3 percent in June, 0.5 percent in July and 0.2 percent in August. The cumulative fall over these three months is about 1.0 percent. Over the three months to August, construction fell by 1.0 percent compared with the previous three months, and by 1.6 percent compared with the same period of 2025.
| Period | Construction | GDP |
|---|---|---|
| June 2026 (monthly) | -0.3 | +0.4 |
| July 2026 (monthly) | -0.5 | +0.4 |
| August 2026 (monthly) | -0.2 | +0.1 |
| Three months to August | -1.0 | +0.7 |
| Year on year (three months to August) | -1.6 | +1.8 |
Table 1. Growth rates, percent. Source: ONS, August 2026 releases.
This divergence is notable. Construction usually moves with the economic cycle, often amplifying it. Its decline during a period of overall growth suggests that it is affected by specific factors, such as interest rates and energy costs, rather than by a general weakness of demand.
5.2 Where the decline is concentrated
Figure 2 decomposes the decline by type of work.
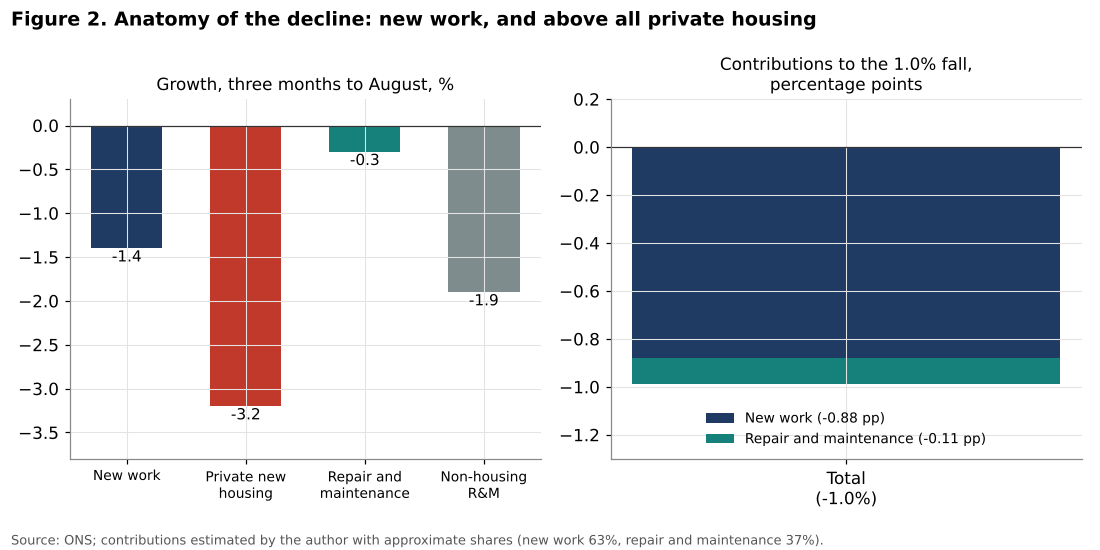
The decline is concentrated in new work, which fell by 1.4 percent over three months, while repair and maintenance fell by only 0.3 percent. Within new work, new private housing fell by 3.2 percent over three months, and by 1.9 percent in August alone. Within repair and maintenance, non-housing repair fell by 1.9 percent, while housing repair was more resilient. Five of the nine construction sectors recorded a decrease over the period.
Using approximate shares, the author estimates that new work accounted for about 0.88 percentage points of the 1.0 percent fall in total construction, and repair and maintenance for about 0.11 points. If new private housing represents about 35 percent of new work, it alone would account for about 0.7 points of the total decline, or about 70 percent. The remaining new work, including infrastructure and commercial building, would have fallen by about 0.4 percent.
The decline of new private housing is particularly significant. A fall of 3.2 percent over three months corresponds to an annualised rate of about 12 percent. New private housing is the component most directly linked to the government’s housing objective and the most sensitive to mortgage rates and buyer confidence.
5.3 The direct effect on GDP
With an approximate weight of 6 percent of total output, a 1.0 percent fall in construction over three months subtracts about 0.06 percentage points from GDP growth. In the three months to August, GDP grew by 0.7 percent despite this drag. The direct effect of the construction decline on GDP is therefore small.
This conclusion must be qualified in two ways. First, construction has indirect effects through its supply chain, including the manufacture of materials, transport and professional services such as architecture and engineering. Second, the decline of construction reduces future capacity: fewer homes, offices and infrastructure today mean less output and productivity tomorrow. These effects are not captured by the direct contribution to GDP.
5.4 How reliable are the data?
Figure 3 shows the mean absolute revision to monthly growth rates between the previous release and the August 2026 release, for January to July 2026, together with the response rate to the construction survey.
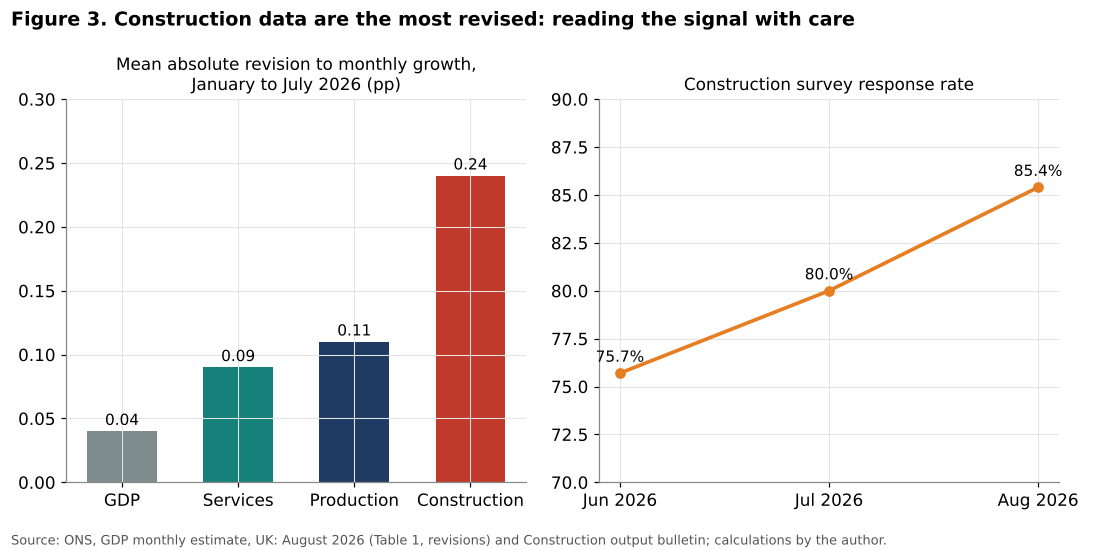
Construction data are the most revised of the main sectors. The mean absolute revision to monthly construction growth for January to July 2026 was about 0.24 percentage points, compared with 0.09 points for services, 0.11 points for production and 0.04 points for GDP as a whole. The largest single revision was for July, from growth of 0.1 percent to a fall of 0.5 percent. Response rates to the construction survey were 75.7 percent for June, 80.0 percent for July and 85.4 percent for August, lower than for other sectors.
This means that the most recent construction figures should be interpreted with caution. They may be revised again, possibly significantly. However, the direction of the revisions in the August release was mostly downward for recent months, and the decline has now been recorded in four consecutive months and two consecutive three-month periods. The signal of weakness is therefore likely to be genuine, even if its exact size is uncertain.
5.5 The housing gap
Figure 4 shows illustrative paths for net additions to the housing stock compared with the rate needed to meet the target of 1.5 million homes over five years.
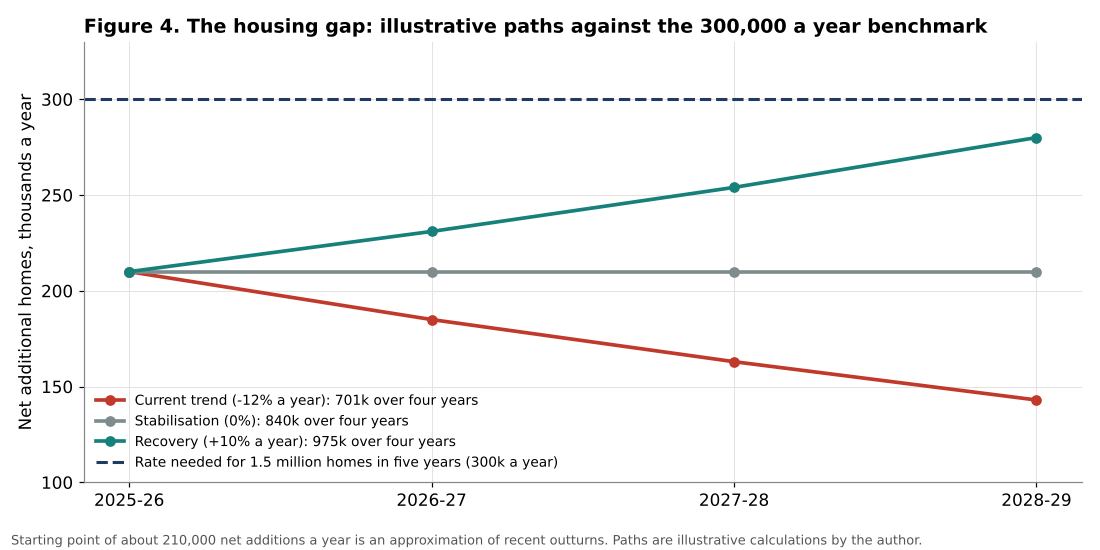
Starting from an approximate level of 210,000 net additions a year, the target rate of 300,000 a year requires an increase of about 43 percent. The three illustrative paths give very different outcomes over four years:
| Path | Annual change | Homes over four years (thousands) |
|---|---|---|
| Current trend | -12% | about 700 |
| Stabilisation | 0% | about 840 |
| Recovery | +10% | about 975 |
| Target-consistent rate | 300,000 a year | 1,200 |
Table 2. Illustrative housing supply paths. Source: calculations by the author.
Even the recovery path, with an increase of 10 percent a year, would deliver only about 975,000 homes over four years, well below the 1.2 million implied by the target rate. A continuation of the current decline would deliver about 700,000, leaving a gap of about 500,000 homes. These calculations are simplified, since output and completions differ, and since part of the target period has already passed. But they show that the current trend in new private housing is moving in the wrong direction for the housing objective.
5.6 The causes: borrowing costs and materials
Figure 5 illustrates two of the main pressures on construction.
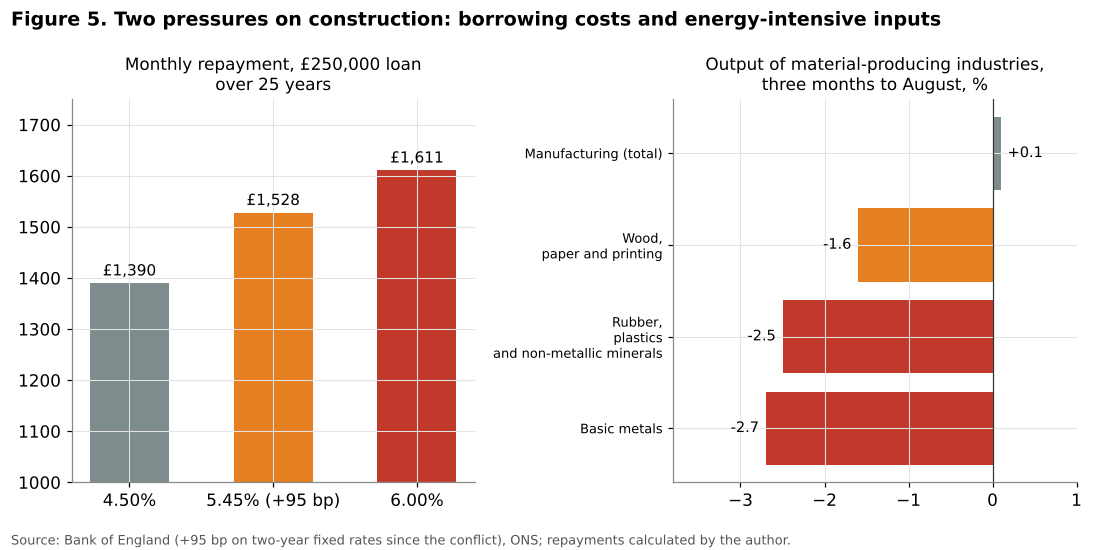
The first is the cost of borrowing. The Bank of England reported that the two-year fixed mortgage rate was about 95 basis points higher in September 2026 than before the escalation of the conflict. For a £250,000 repayment mortgage over 25 years, an increase from 4.50 to 5.45 percent raises the monthly repayment from about £1,390 to about £1,528, an increase of about £138, or about 10 percent. At 6.00 percent, the repayment would be about £1,611. Higher mortgage costs reduce the number of buyers who can afford new homes, which leads housebuilders to slow the pace of construction and the launch of new projects. Developers’ own financing costs also rise.
The second is the cost of materials. Many construction materials are energy-intensive: cement, bricks, glass, steel and ceramics all require large amounts of heat. With wholesale electricity and gas prices more than double their level of a year earlier, the industries that produce these materials are under pressure. In the three months to August 2026, output of basic metals fell by 2.7 percent, and output of rubber, plastics and non-metallic minerals, which includes cement, bricks and glass, fell by 2.5 percent. Wood, paper and printing fell by 1.6 percent. These declines contrast with the slight growth of manufacturing as a whole (0.1 percent). They suggest that the energy shock is affecting the supply chain of construction, both by raising costs and potentially by reducing the availability of domestically produced materials.
A third factor, more difficult to quantify, is uncertainty. Business surveys in September pointed to weaker housing activity and growing concern about energy prices. The ONS reported that in late September, 72 percent of businesses were concerned about energy prices. In an uncertain environment, developers tend to delay starting new projects until the outlook becomes clearer.
5.7 Employment and investment
The monthly GDP release does not provide employment data for construction, but the sector’s labour market characteristics suggest that a prolonged decline would have significant effects. Construction employs around two million people in the United Kingdom, a large share of whom are self-employed, and it is an important source of jobs outside the major cities and for workers without university degrees. A decline in output tends to affect self-employed workers and subcontractors first, as main contractors reduce their use of external labour.
For investment, the decline of construction has two dimensions. Construction is itself a form of investment: housing investment by households and developers, and investment in buildings and structures by businesses and the public sector. A fall in construction output therefore directly reduces measured investment in the economy. And the decline of non-housing repair and maintenance, down 1.9 percent over three months, suggests that businesses may be postponing spending on their existing buildings, a common reaction to uncertainty and rising costs.
5.8 Construction in the sequence of the cycle
The timing of the construction decline also deserves attention. In most economic cycles, construction reacts early to changes in financial conditions. Housebuilders adjust the pace of construction to the rate at which they can sell homes, and the rate of sales responds quickly to mortgage rates. Commercial construction depends on investment decisions that are often made a year or more in advance, so it tends to lag. Repair and maintenance is the most stable component, because it responds to the needs of the existing stock rather than to new demand.
The 2026 data fit this sequence closely. New private housing, the most interest-sensitive component, is falling fastest. Non-housing repair and maintenance, which reflects discretionary spending by businesses on their premises, is also falling. Other new work, including infrastructure, is declining only modestly, supported by long-term public programmes. This pattern is consistent with a response to the rise in market interest rates and to uncertainty since the escalation of the energy shock, rather than with a structural collapse of the sector.
If this interpretation is correct, construction is likely to continue to weaken for several months, as the effect of higher mortgage rates on sales feeds through to the volume of new projects, before stabilising once interest rate expectations stop rising. The experience of previous cycles suggests that housebuilding can recover relatively quickly when financial conditions ease, but that the loss of capacity during a downturn, especially the departure of skilled workers and the closure of small firms, can slow the recovery.
6. Discussion
6.1 Not a threat to the recovery, but to its durability
The analysis suggests a nuanced answer to the question in the title. In the short term, the decline of construction does not threaten the recovery: its direct effect on GDP is small, about 0.06 percentage points over three months, and it has been more than offset by the growth of services. The UK economy can continue to grow even if construction declines further.
In the medium term, however, the decline threatens the quality and durability of the recovery. Housing supply is a key determinant of productivity, labour mobility and living standards. A shortage of housing in the most productive areas limits the growth of the very industries, such as business services, that are currently driving the economy, because they need to attract workers to cities where housing is expensive. A recovery driven by services but accompanied by declining housebuilding may eventually be constrained by the lack of housing.
6.2 The role of monetary policy
Construction is the sector most sensitive to interest rates. If the Bank of England raises Bank Rate in response to the energy shock, as some members of the Monetary Policy Committee advocate, construction is likely to decline further. This is one of the costs of monetary tightening that the Bank must take into account. Conversely, if the energy shock fades and interest rate expectations fall, construction could recover relatively quickly, as it did after previous periods of high rates.
The interaction between monetary policy and housing supply is a source of tension. Monetary policy works partly by reducing demand for housing and construction. But housing supply is a structural objective of the government. A prolonged period of high interest rates could make the housing target unreachable, regardless of planning reforms.
6.3 The role of energy prices
The decline in the output of energy-intensive materials is a warning sign. If domestic production of cement, bricks and steel falls, construction firms may have to rely more on imports, which can be more expensive and subject to supply disruptions. Policies to support energy-intensive industries, such as reductions in network charges or levies, have been discussed, but they involve fiscal costs that the government must weigh against other priorities, as discussed in the article on public finances in this series.
6.4 Planning reform and the structural constraint
The planning system has long been identified as the main structural constraint on housing supply in England. The government has introduced reforms to make it easier to obtain planning permission and to build infrastructure. These reforms may increase the potential for housebuilding over time, but they cannot overcome the cyclical constraints of high interest rates and costs. In the current environment, the binding constraint on new housing appears to be demand and financing rather than planning permissions.
This distinction is important for policy. If the binding constraint is cyclical, measures that support demand for new homes, such as help for first-time buyers or public investment in affordable housing, may be more effective in the short term than further planning reform. If the constraint is structural, planning reform is essential. In practice, both types of constraint operate, and a combination of policies is likely to be needed.
6.5 Public investment
The government has emphasised public investment as a driver of growth, and public sector net investment has been rising. Public investment in infrastructure, social and affordable housing, schools and hospitals can partly offset the decline of private construction. However, the article on public finances in this series showed that fiscal headroom is limited, and that the investment rule constrains the expansion of borrowing for investment. The extent to which public investment can support construction in 2027 will depend on the choices made in the Budget of 28 October 2026.
6.6 Skills and capacity
A recurring constraint on UK construction is the availability of skilled labour. The sector relies on trades such as bricklaying, carpentry, electrical work and plumbing, which require years of training, and it has historically depended on workers from other European countries. A cyclical decline in output can lead experienced workers to leave the sector, retire or move abroad, and reduce the incentive for firms to train apprentices. When demand recovers, the sector may then lack the capacity to respond, which raises costs and delays projects.
This dynamic is relevant for the housing target. Even if financial conditions improve in 2027, a rapid increase in housebuilding to 300,000 homes a year would require a significant expansion of the workforce. A prolonged downturn in 2026 and 2027 would make this expansion more difficult. Policies that maintain training and retain skilled workers during the downturn could therefore have a high long-term return, by preserving the capacity that the economy will need when conditions improve.
6.7 Regional and social dimensions
The effects of the construction decline are unevenly distributed. Housebuilding activity is spread across the country, including in regions where other sources of growth, such as business services, are weaker. A downturn in construction therefore tends to hit regions and workers that benefit least from the current services-led expansion. In this sense, the divergence between services and construction described in this article and the previous one also has a geographical dimension: growth concentrated in a few cities, and weakness spread more widely.
The social dimension is also important. A slowdown in the supply of new homes, at a time when mortgage rates are rising, affects first-time buyers and renters most. Higher rents and reduced access to home ownership for younger households are among the most visible consequences of the housing shortage in the United Kingdom. A prolonged decline of housebuilding would prolong these difficulties, with effects on household formation, labour mobility and the distribution of wealth between generations.
7. Scenarios to the end of 2027
7.1 Three paths
Figure 6 presents three scenarios for construction output from the third quarter of 2026 to the end of 2027, with the implied effect on GDP growth in 2027.
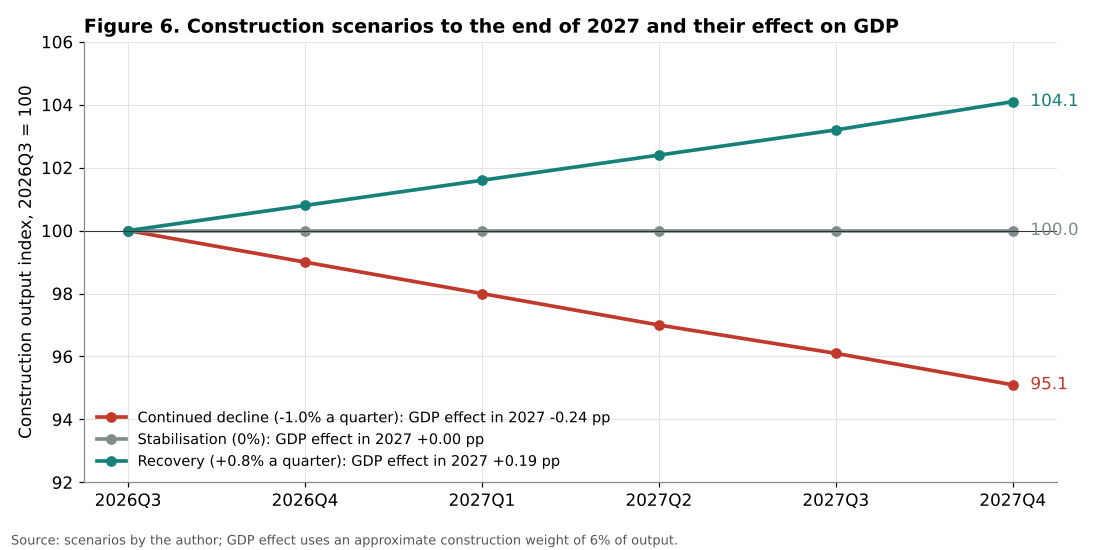
Scenario 1: Continued decline. Energy prices remain high, the Bank of England raises rates, and mortgage costs increase further. Construction output falls by 1.0 percent a quarter, a cumulative decline of about 5 percent by the end of 2027. The direct effect on GDP growth in 2027 is about -0.24 percentage points.
Scenario 2: Stabilisation. Energy prices stabilise and interest rates remain broadly unchanged. Construction output stops falling and remains at its current level. The effect on GDP growth is neutral.
Scenario 3: Recovery. The energy shock fades, interest rate expectations fall, and public investment supports infrastructure and housing. Construction output grows by 0.8 percent a quarter, a cumulative increase of about 4 percent by the end of 2027. The direct contribution to GDP growth in 2027 is about +0.19 percentage points.
7.2 Assessment
The difference between the scenarios in terms of GDP is modest, about 0.4 percentage points in 2027 between the best and worst cases. But the difference for housing supply is large. In the continued decline scenario, the gap with the housing target would widen significantly; in the recovery scenario, it would narrow but not close.
The author considers scenario 1 the most likely for the next two quarters, given the momentum of the decline, the rise in market interest rates and the persistence of high energy prices. A transition towards scenario 2 or 3 in 2027 would depend on the evolution of the conflict in the Middle East, the decisions of the Bank of England and the content of the Budget.
7.3 Indicators to watch
The author suggests monitoring:
1. Monthly construction output, especially new private housing. 2. Mortgage approvals and quoted mortgage rates published by the Bank of England. 3. Output and prices of construction materials. 4. Housing starts and completions, and planning permissions granted. 5. Public sector net investment and the investment plans announced in the Budget.
8. Conclusion
The decline of construction in 2026 is a sector-specific phenomenon, driven by higher borrowing costs, energy-intensive inputs and uncertainty, in an economy that is otherwise growing thanks to services. The main findings of this article are:
1. Construction output fell by 1.0 percent in the three months to August 2026 and by 1.6 percent over the year, with four consecutive monthly declines. 2. The decline is concentrated in new work (-1.4 percent) and especially new private housing (-3.2 percent, about -12 percent annualised). New private housing may account for around 70 percent of the total decline. 3. The direct drag on GDP is small, about 0.06 percentage points over three months. 4. Construction data are the most revised of the main sectors, with a mean absolute revision of about 0.24 percentage points for recent months, but the signal of weakness has been consistent. 5. The two-year fixed mortgage rate has risen by about 95 basis points since the conflict, which adds about £138 a month to the repayment of a £250,000 loan, and the output of energy-intensive material industries has fallen by 2.5 to 2.7 percent over three months. 6. On current trends, housing supply is moving further away from the rate of about 300,000 homes a year implied by the government’s target.
The decline of construction does not threaten the recovery in the short term, but it threatens its durability. Housing and infrastructure are the foundations of long-term growth, and a recovery that does not build them is likely to run into constraints. The response requires action on several fronts at once: stabilising energy costs for material producers, avoiding an excessive tightening of financial conditions, supporting public and affordable housing investment within the fiscal rules, and continuing reforms to the planning system.
Need this analysis for your organisation?
We prepare confidential briefings, executive talks and studies on countries, markets and policies, built on the same method as this article.
Request a briefingSupport independent analysis
Our studies are free to read and carry no advertising. If this one was useful, a small contribution helps us publish the next.
Support our workGo further: books by Global Strategy Files


Frequently asked questions
Is UK construction output falling in 2026?
Yes. Construction output fell 1.0 percent in the three months to August 2026, its second consecutive three-month decline, and 1.6 percent on a year earlier. Monthly output decreased for the fourth month in a row in August.
Is UK housebuilding slowing down?
Yes. New private housing output fell 3.2 percent in the three months to August 2026, an annualised rate of decline of about 12 percent, while repair and maintenance work was almost stable. New work as a whole fell by 1.4 percent over the same period.
Does the construction slump threaten UK growth?
Not in the short term. The direct drag on GDP was only about 0.06 percentage points over three months, but the decline threatens the quality and durability of the recovery by weakening housing supply, productivity and labour mobility.
Can the UK build 1.5 million homes in five years?
Current trends make it harder. Delivering 1.5 million homes over five years requires about 300,000 a year, and with new private housing output falling at about 12 percent a year, supply is moving further away from that target.
Methodological note
All calculations in this article were carried out by the author using the ONS releases “Construction output in Great Britain: August 2026” and “GDP monthly estimate, UK: August 2026” (15 October 2026) and the Bank of England’s Monetary Policy Summary of September 2026. The decomposition by type of work uses approximate shares of 63 percent for new work and 37 percent for repair and maintenance, and an illustrative share of 35 percent for new private housing within new work. The contribution to GDP uses an approximate weight of 6 percent. The mean absolute revisions are calculated from the ONS revisions table for January to July 2026. Mortgage repayments use the standard annuity formula with illustrative rates. Housing paths start from an approximate level of 210,000 net additions a year and are illustrative. The scenarios do not constitute forecasts.
References
Barker, K. (2004). Review of Housing Supply: Delivering Stability: Securing our Future Housing Needs. Final Report. HM Treasury, London.
Bank of England (2026). Monetary Policy Summary and minutes of the Monetary Policy Committee meeting ending on 16 September 2026. London.
Glaeser, E. and Gyourko, J. (2018). The Economic Implications of Housing Supply. Journal of Economic Perspectives, 32(1), 3 to 30.
Hilber, C. A. L. and Vermeulen, W. (2016). The Impact of Supply Constraints on House Prices in England. Economic Journal, 126(591), 358 to 405.
Leamer, E. E. (2007). Housing Is the Business Cycle. In Housing, Housing Finance, and Monetary Policy, Federal Reserve Bank of Kansas City Economic Policy Symposium, Jackson Hole, 149 to 233.
Office for National Statistics (2026). Construction output in Great Britain: August 2026. Statistical bulletin, 15 October 2026. Newport.
Office for National Statistics (2026). GDP monthly estimate, UK: August 2026. Statistical bulletin, 15 October 2026. Newport.
