
The Seven-Year Car: 84-Month Loans and the Negative-Equity Treadmill


Driss EFFINA, PhD Independent Researcher, Global Strategy Files. Decoded, 11 November 2026. Reading time: about 9 minutes.
Key takeaways
- A record 25.5% of new-vehicle loans ran 84 months or longer in the third quarter of 2026, against 18.5% two years earlier. The average loan now finances $44,664 over 70.5 months at 7.0%, for a payment of $787 a month.
- Since 2019, new-vehicle prices have risen 22% in the CPI and bank loan rates for a 60-month new car loan from 5.3% to about 7.4%. Together they raise the payment on an equivalent loan by about 30%; the interest rate explains only a fifth of that.
- Stretching from 72 to 84 months cuts the payment by 11.5% but adds about $1,800 of interest and keeps the average buyer’s equity thin for three years.
- Our model shows that a buyer who puts nothing down and takes an 84-month loan is underwater for 52 months and still owes about $1,700 more than the car is worth when trading in after four years.
- Repeated three times, the cycle raises the amount financed from $52,500 to $55,500 and the payment from $792 to $868, close to what Edmunds observes for buyers rolling over negative equity ($57,235 and $952).
- The new deduction for interest on US-assembled cars is worth $216 to $396 a year to a typical claimant, less than the extra first-year interest caused by the rise in rates since 2019 on an average loan (about $430).
Fifty thousand dollars
In September 2026, the average price paid for a new vehicle in the United States reached $50,562 according to Kelley Blue Book, just $52 below the record set in December 2025. A decade ago, a typical new car cost well under $35,000. The increase reflects a richer mix of trucks and SUVs, electric vehicles, technology content and, since 2025, tariffs on vehicles and parts. But the most important change in the market is not the sticker price. It is the way Americans pay it.
Lenders and buyers have adjusted to higher prices by lengthening loans. The seven-year loan, once a marginal product, is now the choice of one new-car buyer in four. This article asks what that adjustment means for household balance sheets. We decompose the rise in monthly payments, model the equity path of a typical loan, simulate repeated trade-ins, and assess the new federal deduction for car loan interest.
The financing records of 2026
Edmunds’ quarterly data describe a market that keeps setting records (Table 1). The average amount financed for a new vehicle reached $44,664 in the third quarter of 2026, up from $42,744 a year earlier. The average term was 70.5 months and the average payment $787. More than one financed buyer in five, 21.2%, committed to a payment of $1,000 or more a month. Down payments fell to $5,554 from $6,021 a year earlier, a sign that buyers are short of cash rather than of credit. The average APR was unchanged at 7.0%, which means that the rise in payments came entirely from larger balances and longer terms.
Table 1. New-vehicle financing, quarterly averages
| Indicator | Q3 2025 | Q2 2026 | Q3 2026 |
|---|---|---|---|
| Amount financed ($) | 42,744 | 44,156 | 44,664 |
| Term (months) | 70.0 | 70.4 | 70.5 |
| Monthly payment ($) | 756 | 777 | 787 |
| APR (%) | 7.0 | 7.0 | 7.0 |
| Down payment ($) | 6,021 | 5,815 | 5,554 |
| Loans of 84 months or more (% of financed) | 21.8 | 23.9 | 25.5 |
| Trade-ins with negative equity (%) | 28.1 | n/a | 29.1 |

Where the payment increase comes from
Two forces raised the cost of a new car between 2019 and 2026. The consumer price index for new vehicles rose 22%, almost all of it in 2021 and 2022, when chip shortages cut supply. Since 2023 the index has been essentially flat. Interest rates did the rest: the average rate on a 60-month new car loan at commercial banks rose from 5.3% in 2019 to 8.2% in 2024, before easing to about 7.4% in 2026 (Figure 2).
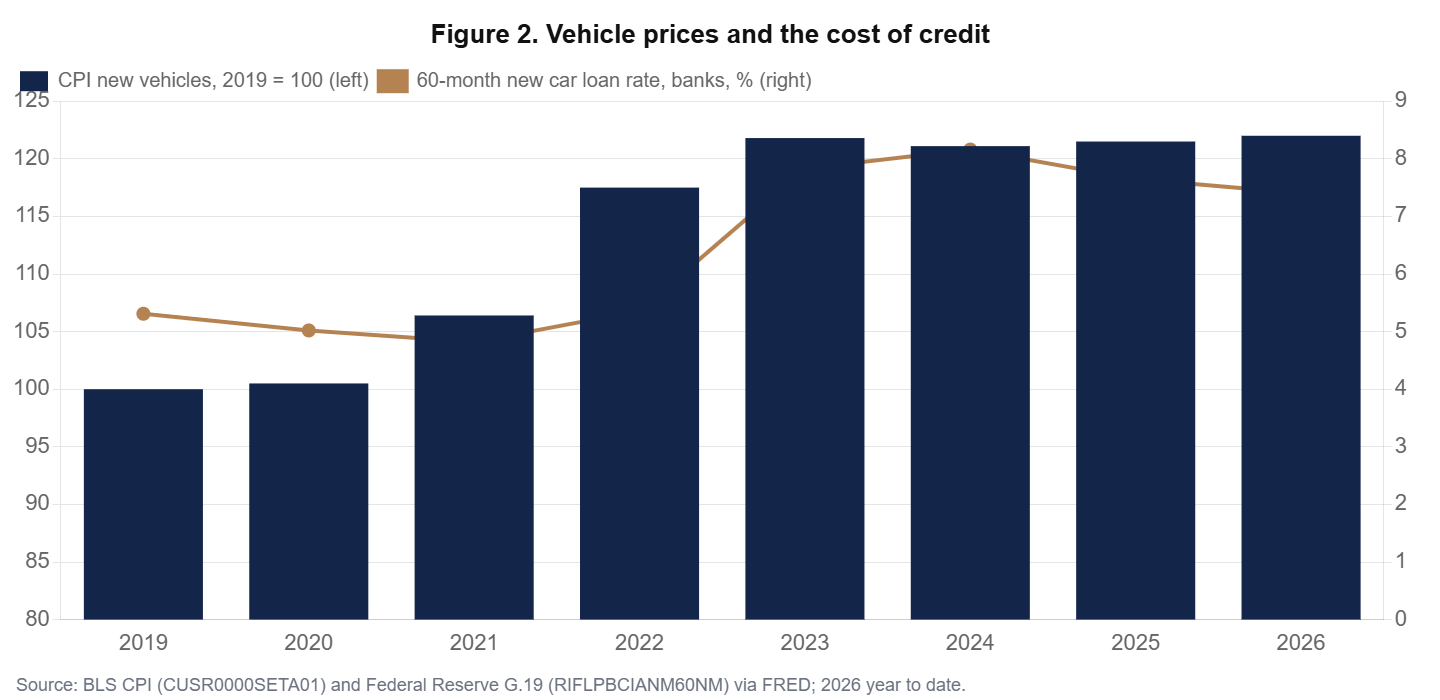
Holding the term at 72 months, a 22% increase in price raises the payment by 22%. The rise in the interest rate from 5.31% to 7.40% adds a further 6.1%. Combined, the payment on an equivalent vehicle is about 30% higher than in 2019. Over the same period, average hourly earnings rose 34%, so the cost of a car in working time has broadly kept pace with wages. The affordability problem is therefore more concentrated than the headlines suggest: it hurts households whose wages lagged, buyers with weaker credit who pay far more than the average APR, and above all those who arrive at the dealer still owing money on their previous car.
The arithmetic of longer loans
Stretching a loan is the most effective tool for reducing a payment. On the average loan of $44,664 at 7%, the payment is $884 over 60 months, $761 over 72 months and $674 over 84 months. Moving from 72 to 84 months reduces the payment by 11.5%. The price is interest: total interest rises from $8,400 on a 60-month loan to $10,162 on a 72-month loan and $11,960 on an 84-month loan. But the less visible cost is equity.
A new car loses value fastest in its first years. We assume, in line with typical industry depreciation curves, that a vehicle is worth 90% of its price once it leaves the lot, 78% after one year, 48% after four years and 30% after seven. Figure 3 shows the resulting equity, the difference between the car’s value and the loan balance, for the average buyer who puts $5,554 down.

With a 60- or 72-month loan, the average buyer is never underwater, though equity is thin in the first year. With an 84-month loan, the same buyer is underwater for three years, with a maximum shortfall of about $1,000 after two years. The situation of a buyer who puts nothing down is very different (Table 2).
Table 2. Loan outcomes for a $50,000 vehicle at 7%
| Buyer and term | Monthly payment | Total interest | Months underwater | Worst equity | Equity after 48 months |
|---|---|---|---|---|---|
| Average buyer, 60 months | $884 | $8,400 | 0 | +$460 | +$13,779 |
| Average buyer, 72 months | $761 | $10,162 | 0 | +$337 | +$6,992 |
| Average buyer, 84 months | $674 | $11,960 | 36 | -$1,043 | +$2,168 |
| Zero down, 60 months | $1,040 | $9,874 | 25 | -$7,267 | +$11,986 |
| Zero down, 72 months | $895 | $11,945 | 38 | -$7,411 | +$4,008 |
| Zero down, 84 months | $792 | $14,059 | 52 | -$7,541 | -$1,662 |
The negative-equity treadmill
The share of trade-ins carrying negative equity reached 29.1% in the third quarter of 2026, with an average shortfall of $7,107. Buyers who roll that debt into a new loan financed an average of $57,235 and paid $952 a month, at an average APR of 8.1%. According to Edmunds, 91.2% of them take loans of 72 months or more, which recreates the problem for the next purchase.
We simulate this dynamic. A buyer finances $52,500 over 84 months, trades the car in after four years, rolls any shortfall into the next 84-month loan at 8.1%, and repeats the cycle three times. The amount financed rises from $52,500 to $54,162 and then $55,486, and the payment from $792 to $847 and then $868 (Figure 4). The shortfall at each trade grows from $1,662 to $2,986 and $3,645. The buyer is not reckless; he simply follows the path of lowest monthly payment. But each cycle adds debt that finances a car he no longer owns. Our model’s third cycle lands close to the averages Edmunds observes for rollover buyers, which suggests that a significant minority of American drivers are already on this treadmill.

We call the share of auto debt that finances vehicles already sold the treadmill share. For a rollover buyer in the third cycle of our model, it is about 5% of the loan. Applied to the 29% of trade-ins that carry negative equity, the treadmill is small relative to the $1.66 trillion auto loan stock, but it is concentrated among younger and lower-income borrowers, the same group in which serious auto delinquencies are highest according to the New York Fed.
Policy: tariffs, rates and the interest deduction
The One Big Beautiful Bill Act created a deduction for interest paid on loans for new vehicles assembled in the United States, up to $10,000 a year. In the 2026 filing season, more than one million filers used it, with an average deduction of over $1,800, according to the Treasury. At a marginal tax rate of 12% to 22%, that deduction is worth $216 to $396 a year. For comparison, the rise in rates since 2019 adds about $430 of interest in the first year of an average 72-month loan. The deduction therefore offsets one half to nine tenths of the rate effect for those who claim it, and nothing of the price effect. Its reach is also limited by the eligibility rules on final assembly, and it does nothing for buyers of imported or used vehicles.
Tariffs push in the opposite direction. Industry analysts attribute part of the 2025 and 2026 price increases to duties on imported vehicles and components. Lower rates would help more: each percentage point off the auto loan rate reduces the payment on an average 72-month loan by about $21 a month. For now, the Federal Reserve is moving the other way.
Who carries the risk
Averages conceal the real fault line in the auto market, which runs through credit quality. Edmunds reports that 71.6% of new-car loans carried an APR of 5% or more and 13.8% an APR of 10% or more in a recent quarter. For used cars the average APR is above 10%, and for subprime borrowers it is far higher. A borrower paying 12% on an 84-month loan of $40,000 pays about $705 a month and more than $19,000 of interest, against $11,960 for the average 7% borrower on a larger loan. The same vehicle can cost a subprime buyer thousands of dollars more over the life of the loan.
These borrowers are also those most likely to arrive with negative equity and the least able to absorb a shock. The New York Fed’s household credit data show that serious delinquency on auto loans has been highest among borrowers aged 18 to 29 and in lower-income areas, and that the share of auto debt transitioning into serious delinquency has hovered near 3% a year. In a downturn, the combination of long terms, negative equity and high rates would turn job losses into repossessions faster than in previous cycles, because borrowers who are underwater cannot sell the car to repay the loan.
Table 3. The same car, different borrowers: 84-month loan on $40,000
| Borrower profile | APR | Monthly payment | Total interest | Total paid |
|---|---|---|---|---|
| Prime | 5.0% | $565 | $7,490 | $47,490 |
| Average new-car buyer | 7.0% | $604 | $10,711 | $50,711 |
| Near prime | 10.0% | $664 | $15,780 | $55,780 |
| Subprime | 14.0% | $750 | $22,966 | $62,966 |
The macroeconomic stakes
The auto market matters for the wider economy in three ways. First, through demand: new-vehicle sales ran at an annual rate of about 16.4 million units in 2026, below the 17 to 17.9 million of 2015 to 2019. Affordability is one reason the market has not returned to its pre-pandemic peak despite population and income growth. Second, through consumer credit: auto loans total about $1.66 trillion, the second-largest category of household debt after mortgages, and their performance is a sensitive indicator of stress among lower-income households. Third, through the used-car market, where higher new-car prices and longer ownership cycles keep used prices high; the used-vehicle CPI remains about 29% above its 2019 level.
Longer loans also change the transmission of monetary policy. When the Federal Reserve raises rates, the effect on new auto payments is smaller than it would be with short loans, because lenders and buyers lengthen terms to keep payments affordable. The adjustment comes later and in a less visible form: lower equity, more negative equity at trade-in, and higher delinquencies a few years down the road. A rate cycle that looks mild in the monthly payment can therefore be harsher in the balance sheet.
What would break the treadmill
- Shorter terms by default: lenders and dealers could present 60- and 72-month options first and disclose the expected equity path at signing, as some consumer advocates propose.
- Equity disclosure at trade-in: making the amount of negative equity rolled into a new loan a separate, prominent line on the contract would make the treadmill visible.
- Cheaper vehicles: the market’s shift toward compact SUVs and small pickups in 2026 suggests that demand for affordable models is strong where supply exists.
- Lower rates over time: a cut of one point in auto loan rates saves about $21 a month on an average 72-month loan, but only if prices do not absorb the gain.
The true cost of a seven-year car
The monthly payment is the number buyers focus on, but it is a poor guide to the cost of a car. Figure 5 shows, for the average loan of $44,664 at 7%, how the payment and total interest change with the term. Going from 48 to 84 months cuts the payment from $1,070 to $674, a reduction of 37%. Total interest more than doubles, from about $6,700 to $12,000. A 96-month loan, now offered by some lenders, would bring the payment down to about $609 but push interest above $13,700, more than a quarter of the amount borrowed.

Longer terms also change the economics of ownership in ways that do not appear in the loan contract. A car financed over seven years is likely to need significant repairs, tyres and possibly brakes and batteries before the last payment, so the buyer pays for maintenance and debt at the same time. Insurance costs, which have risen sharply since 2022 as repair costs climbed, add to the monthly burden. AAA’s annual estimate of the full cost of owning a new vehicle, including depreciation, fuel, insurance, maintenance and financing, is close to $1,000 a month, well above the loan payment alone.
The decision to stretch a loan is not irrational. For a household with a tight monthly budget and a stable job, a lower payment can be the only way to obtain a reliable vehicle for commuting, and in most of the United States a car is a condition of employment. The risk arises when the buyer cannot keep the car for the full term, because of a job change, a family event or a breakdown, and has to trade it in while still underwater. That risk is highest for younger and lower-income buyers, who are also the most likely to take the longest loans. Policy that improves the transparency of the equity path at signing would help them make that trade-off with full information.
Conclusion
The American car market has adapted to $50,000 vehicles by turning a durable good into a seven-year payment plan. For buyers with savings and good credit, the cost of a car relative to wages is not much worse than before the pandemic. For a large minority, it is: those who put little down, borrow at subprime rates and trade in early are caught in a treadmill in which each car carries the unpaid cost of the previous one. The lengthening of loans has hidden the affordability problem in monthly payments; it has not solved it. A cooling of prices, lower rates and better-informed buyers would do more than any tax deduction to stop the treadmill.
Robustness and limits
The equity and treadmill results depend on the depreciation path, which varies widely across models. Trucks and some popular SUVs hold their value better than our assumption; many electric vehicles and luxury sedans lose value faster. With a slower path, for example 80% of the price after one year and 55% after four, the zero-down 84-month buyer would still be underwater for about three years but would reach positive equity before the four-year trade. With a faster path, the treadmill would accelerate. The point of the model is not the exact figures but the mechanism: the longer the loan relative to the ownership period, the more likely a buyer is to carry debt into the next car.
The payment decomposition uses the CPI for new vehicles, which adjusts for quality changes, and the bank rate on 60-month loans. Transaction prices, which do not adjust for quality and reflect a richer mix, rose more than the CPI, and the rates actually paid by many buyers, especially through captive finance companies offering promotional rates, differ from the bank average. Using transaction prices instead of the CPI would raise the price effect and therefore the total payment increase since 2019.
Table A1. Data appendix: auto market indicators, annual averages
| Year | CPI new vehicles | CPI used vehicles | 60-month new car loan rate (%) | Light vehicle sales (million, annual rate) |
|---|---|---|---|---|
| 2015 | 147.1 | 147.3 | 4.20 | 17.86 |
| 2017 | 147.0 | 137.9 | 4.33 | 17.56 |
| 2019 | 146.8 | 139.8 | 5.31 | 17.49 |
| 2020 | 147.6 | 144.3 | 5.02 | 14.88 |
| 2021 | 156.2 | 182.5 | 4.82 | 15.41 |
| 2022 | 172.5 | 205.9 | 5.36 | 14.23 |
| 2023 | 178.9 | 191.2 | 7.83 | 16.01 |
| 2024 | 177.9 | 179.9 | 8.16 | 16.33 |
| 2025 | 178.5 | 185.0 | 7.65 | 16.68 |
| 2026 (year to date) | 179.2 | 180.5 | 7.40 | 16.44 |
Methodological note
Loan payments use standard annuity formulas. The depreciation path (90%, 78%, 66%, 56%, 48%, 41%, 35%, 30% of price at drive-off and at the end of years one to seven) is a stylized assumption consistent with industry averages and is applied with linear interpolation between year-ends. The treadmill simulation assumes the same vehicle price in each cycle and an 8.1% APR on rollover loans. The payment decomposition holds the term at 72 months. CPI and loan rate data are annual averages, 2026 year to date.
GO DEEPER
The 2026 US Economy Trilogy (3 books, PDF)
Growth from the AI investment boom, the Federal Reserve and the credit economy, and what inflation leaves in the household budget: the forces behind this article, analysed in three research books by Dr. Driss Effina. About 900 pages in English PDF.
$59 instead of $90
Sources
- Edmunds, New-Car Financing Records Pile Up in Q3, October 2026, and negative equity reports for Q3 2025, Q1 2026 and Q3 2026; Kelley Blue Book and Cox Automotive transaction price reports, October 2026; US Treasury, filing season statistics, April 2026.
- BLS CPI for new vehicles (CUSR0000SETA01); Federal Reserve G.19 finance rate on 60-month new car loans (RIFLPBCIANM60NM); BLS average hourly earnings; all via FRED. Federal Reserve Bank of New York, Household Debt and Credit Report.
- Driss EFFINA, PhD | Independent Researcher, Global Strategy Files | globalstrategyfiles.com
Driss EFFINA, PhD
The opening pages of our four country reports: United States, United Kingdom, Japan and China. A free PDF, sent to your inbox.
You will also receive occasional analysis from Global Strategy Files. Unsubscribe in one click, at any time.