America’s 3.4 Percent Quarter: What the Q3 2026 GDP Report Says About Growth, Prices and Paychecks

Driss EFFINA, PhD Independent Researcher, Global Strategy Files. Decoded, 19 November 2026. Reading time: about 9 minutes.
Key takeaways
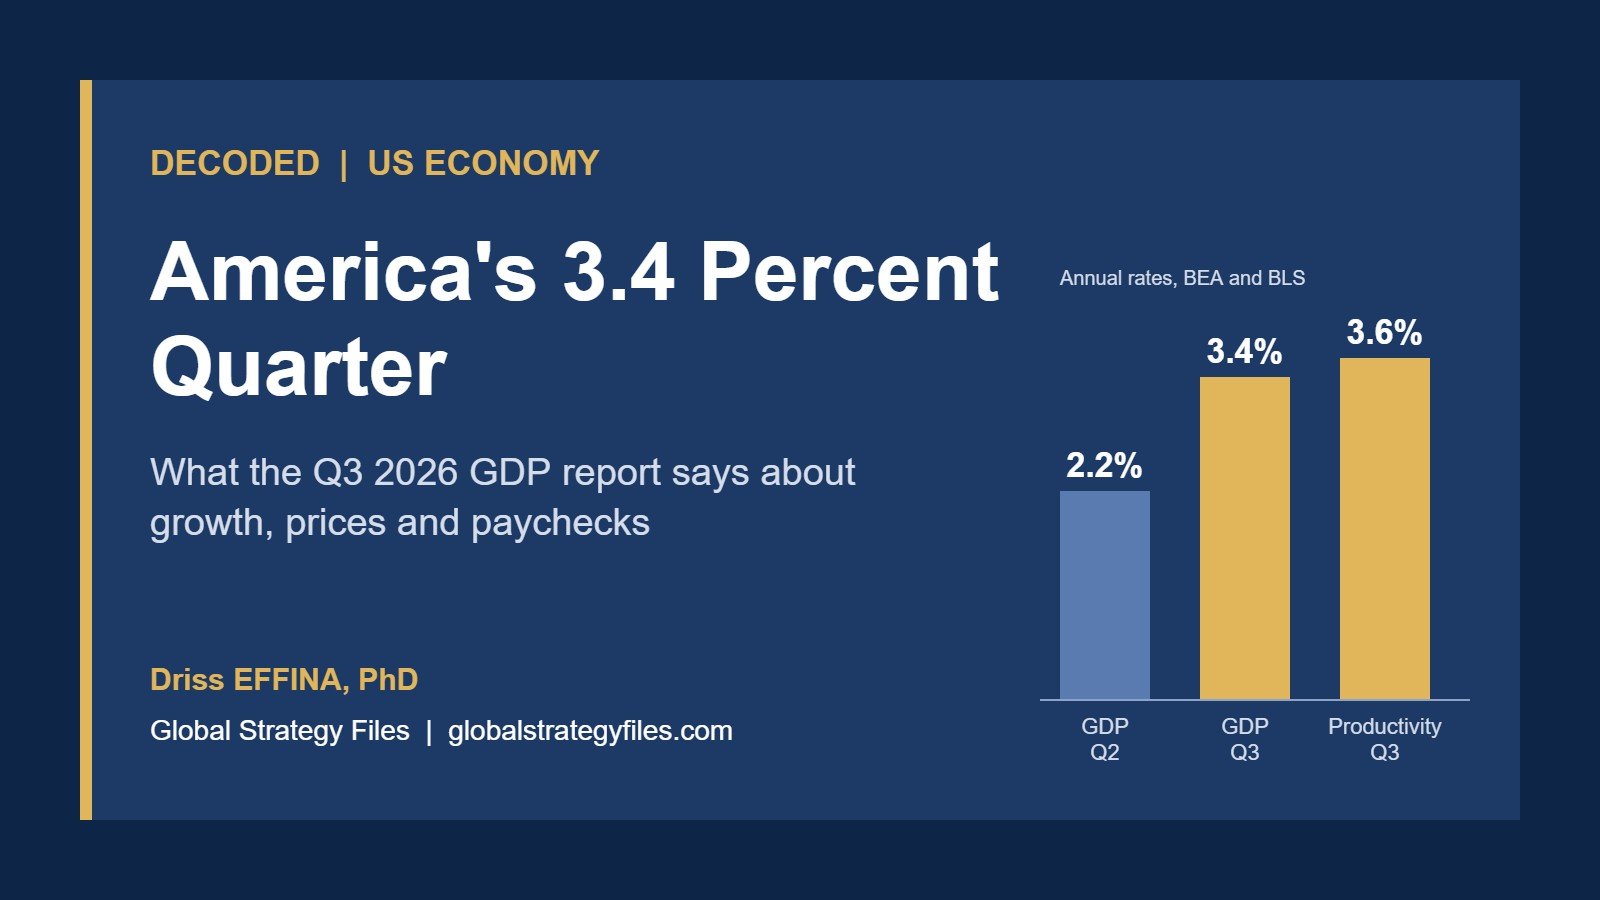
- US real GDP grew at an annual rate of 3.4 percent in the third quarter of 2026, up from 2.2 percent in the second quarter, according to the BEA advance estimate published on 29 October.
- Private domestic demand is the engine: real final sales to private domestic purchasers rose 4.9 percent, led by equipment and inventory investment and by spending on services.
- The quarter hides a squeeze at the end. In September, real disposable income fell 0.3 percent, the saving rate stood at 3.8 percent, and consumer prices were up 3.7 percent on a year earlier while hourly pay was up 3.0 percent.
- October data since the release soften the picture without changing it: payrolls rose 165,000, unemployment slipped to 4.1 percent, productivity grew 3.6 percent in the third quarter, and real hourly pay was flat as prices and wages both rose 0.4 percent.
- The Federal Reserve held its target range at 3.75 to 4 percent on 28 October, with two members dissenting in favour of a hike. Strong growth makes the next move a question of inflation, not of recession. The BEA second estimate is due on 25 November.
A headline that beat the gloom
For much of 2026 the American economy has been described through its shocks: an energy price surge, tariffs, a Federal Reserve that turned back toward tightening. The third quarter national accounts tell a different first story. Real GDP rose 0.8 percent on the quarter, or 3.4 percent at an annual rate, according to the Bureau of Economic Analysis. That is a clear acceleration from 2.2 percent in the spring quarter, and it came while energy prices were still weighing on household budgets.
Current-dollar GDP grew even faster, at 5.6 percent. The gap between the nominal and real figures is a reminder that inflation remains part of the arithmetic of growth: a little more than two points of the nominal expansion reflect higher prices rather than more output.
What drove the quarter
The BEA attributes the increase to three sources: investment, consumer spending and government spending. Investment was led by private inventories and by equipment. Inventory building was concentrated in wholesale trade and manufacturing, which suggests firms were stocking up ahead of further price and tariff uncertainty rather than responding to a collapse in sales.
Consumer spending rose in both services and goods. On the services side, health care and food services and accommodations led the way. On the goods side, the largest contribution came from other nondurable goods, mainly prescription drugs. Government spending rose too, chiefly because federal nondefense consumption benefited from smaller sales from the Strategic Petroleum Reserve than in the second quarter.
Trade pulled in the opposite direction. Exports fell, led by petroleum and related products, while imports rose, with capital goods other than automotive as the largest contributor. That import detail matters: firms are buying machines and equipment from abroad, a pattern consistent with the investment cycle linked to data centres, automation and artificial intelligence that the Federal Reserve itself now describes as “robust capital investment”.
The best gauge of underlying demand
Economists often look past inventories and trade, which swing from quarter to quarter, to a narrower measure: real final sales to private domestic purchasers. It combines consumer spending and private fixed investment. In the third quarter it rose 4.9 percent, after 4.6 percent in the second. On that reading, the American private sector is not slowing at all. It is accelerating.
The numbers side by side
| Indicator | Q2 2026 | Q3 2026 | Source |
|---|---|---|---|
| Real GDP, annual rate | 2.2% | 3.4% | BEA |
| Current-dollar GDP, annual rate | n/a | 5.6% | BEA |
| Real final sales to private domestic purchasers | 4.6% | 4.9% | BEA |
| Gross domestic purchases price index | 5.6% | 3.0% | BEA |
| PCE price index, annual rate | 5.0% | 2.1% | BEA |
| Core PCE price index, annual rate | 3.3% | 2.5% | BEA |
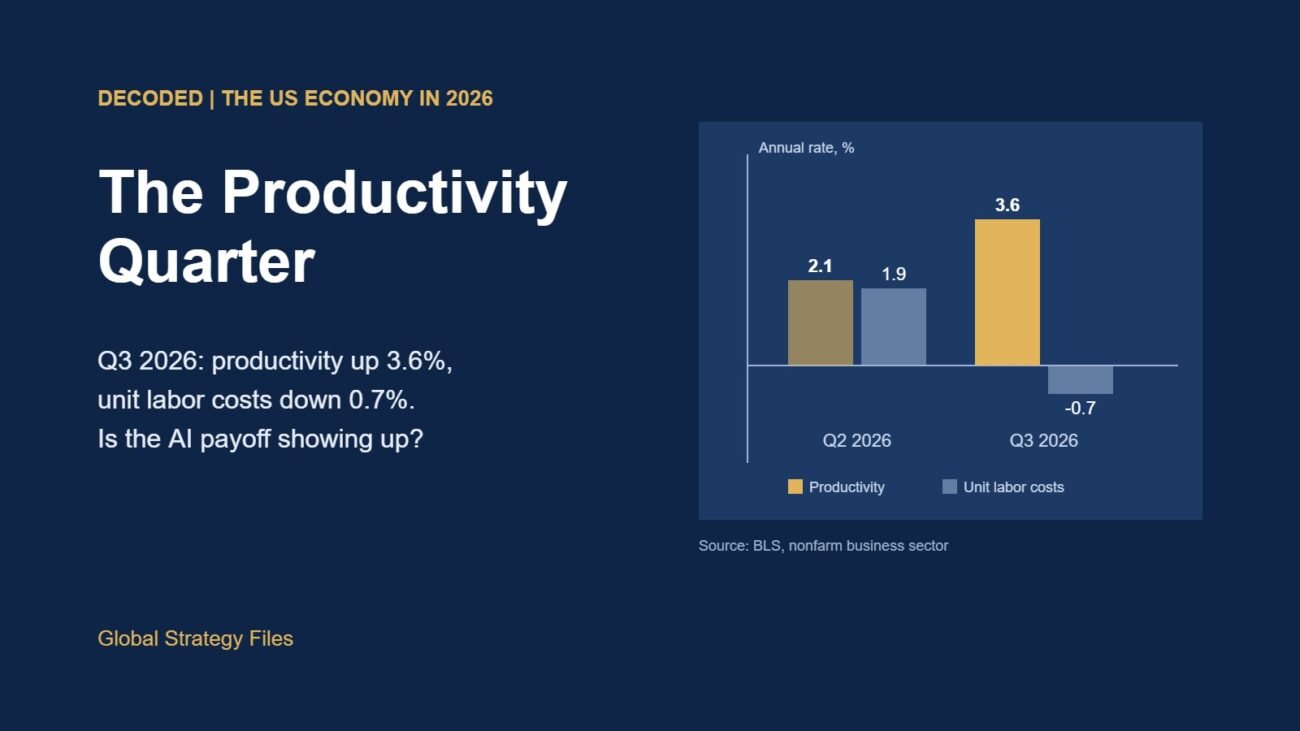
| Nonfarm business productivity, annual rate | 2.1% | 3.6% | BLS |
Quarterly growth rates are seasonally adjusted and expressed at annual rates. GDP figures are the advance estimate, subject to revision; productivity figures are the BLS preliminary estimate of 5 November.
Prices: a calmer quarter, a hotter September
Read quickly, the price lines in the GDP report look reassuring. The PCE price index rose at an annual rate of just 2.1 percent in the third quarter, down from 5.0 percent in the second, and the core measure slowed from 3.3 to 2.5 percent. The spring energy spike, in other words, did not repeat itself across the whole summer.
Monthly data give a less comfortable picture of how the quarter ended. In September, the PCE price index rose 0.5 percent in a single month and stood 3.6 percent above its level a year earlier. Core PCE was up 3.1 percent on the year. The consumer price index from the Bureau of Labor Statistics told the same story: prices rose 0.6 percent in September and 3.7 percent over twelve months. Energy prices were 20.4 percent higher than a year earlier and gasoline 34.2 percent higher. Core CPI inflation was more moderate, at 2.6 percent.
The lesson is that inflation in late 2026 is mostly an energy story, but energy is the part of the budget households cannot postpone. Shelter costs, up 3.2 percent on the year, add a steady second layer.
Paychecks: where the growth does not reach
This is where a strong GDP print and the daily experience of many American families part ways. The September personal income report shows disposable income rising 0.2 percent in current dollars but falling 0.3 percent after adjusting for prices. Real consumer spending was flat on the month. Households kept spending by saving less: the personal saving rate stood at 3.8 percent.
The labour market was not providing much of a cushion as the quarter closed. The first estimate for September showed nonfarm payrolls up only 29,000, an unemployment rate of 4.2 percent and average hourly earnings 3.0 percent higher than a year earlier. With consumer prices up 3.7 percent, the typical hourly wage had lost roughly 0.7 percentage points of purchasing power over the year.
| Household indicator, September 2026 | Value | Source |
|---|---|---|
| Real disposable personal income, monthly change | -0.3% | BEA |
| Personal saving rate | 3.8% | BEA |
| CPI, 12-month change | 3.7% | BLS |
| Average hourly earnings, 12-month change | 3.0% | BLS |
| Nonfarm payroll change (first estimate) | +29,000 | BLS |
| Unemployment rate | 4.2% | BLS |
Put together, the picture is of an economy whose growth is carried by investment, by firms building inventories and by households who still spend on health care, restaurants and travel, but whose wage earners are running harder to stay in place. That is the two-speed pattern this site has followed throughout 2026, now confirmed by the national accounts.
Since the advance estimate: what October adds
Three weeks of new data have arrived since the GDP release, and they mostly confirm the two-speed reading while removing the fear of a sudden labour market break.
Jobs recovered. The Employment Situation report published on 6 November showed nonfarm payrolls up 165,000 in October, with August and September revised up by a combined 84,000. The unemployment rate edged down to 4.1 percent and the participation rate rose to 61.9 percent. Hiring was led by professional and business services, health care, and transportation and warehousing. The weak September print now looks more like a pause than a turning point.
Productivity did the heavy lifting. The Bureau of Labor Statistics estimated on 5 November that nonfarm business productivity rose at an annual rate of 3.6 percent in the third quarter, with output up 3.7 percent and hours almost unchanged. Unit labour costs fell 0.7 percent. In other words, the 3.4 percent GDP quarter was produced with roughly the same amount of work, which is exactly what an investment-led, technology-heavy expansion should look like. I examined that report in detail in The Productivity Quarter: Is the AI Payoff Finally Showing Up in US Data?
Paychecks only treaded water. The October consumer price index, published on 10 November, rose 0.4 percent on the month, with core prices up 0.3 percent. Average hourly earnings also rose 0.4 percent, so real hourly pay was flat after a 0.4 percent fall in September. Over the past twelve months, average hourly earnings are up 3.1 percent. A complication: the BLS could not publish 12-month CPI changes for October, because October 2025 prices were never collected during the 2025 lapse in federal appropriations. My full reading of that report is in The Paycheck Gap: US Wages Trail Inflation as October CPI Loses Its 12-Month Number.
| Indicator | September 2026 | October 2026 | Source |
|---|---|---|---|
| Nonfarm payroll change | +29,000 (first estimate, since revised up) | +165,000 | BLS |
| Unemployment rate | 4.2% | 4.1% | BLS |
| CPI, monthly change | +0.6% | +0.4% | BLS |
| Core CPI, monthly change | +0.3% | +0.3% | BLS |
| Real average hourly earnings, monthly change | -0.4% | 0.0% | BLS |
Seasonally adjusted. September and October earnings data are preliminary.
What it means for the Federal Reserve
The Federal Open Market Committee met on 27 and 28 October, the day before the GDP release, and kept the federal funds target range at 3.75 to 4 percent. Its statement described growth as strong, citing resilient domestic spending, strong productivity growth and robust capital investment, and said inflation “remains elevated”. The vote was 10 to 2. Lisa D. Cook and Beth M. Hammack dissented, both preferring a quarter-point increase.
Two dissents in favour of tighter policy are a signal in themselves. The third quarter report removes any argument that the economy needs rate relief to avoid a downturn, and the October jobs report removes the argument that the labour market is cracking. The productivity numbers cut the other way: falling unit labour costs mean wages are not, for now, pushing prices up, which gives the committee a reason to wait rather than hike. The debate at the 8 and 9 December meeting will therefore be between holding and hiking, not about cutting. For borrowers, that means mortgage, auto and credit card rates are unlikely to ease soon, and the credit channel will keep transmitting the cost of the energy shock to households with the thinnest savings.
Three questions for the months ahead
- Is the investment boom durable? Equipment spending, imports of capital goods and a 3.6 percent productivity quarter all point to a real capital deepening cycle. Whether it keeps raising output per hour enough to offset higher rates is the central question for 2027.
- Will energy inflation spread? Core measures are still moderate, at 0.3 percent a month. A second-round effect through wages and services prices would change the Federal Reserve’s calculus quickly.
- How long can saving fall? A 3.8 percent saving rate leaves little room. If real incomes keep stalling, consumer spending will eventually follow, and the growth story will shift from households to firms alone.
The BEA will publish its second estimate of third quarter GDP, together with corporate profits and October personal income and spending, on 25 November, and a third estimate on 23 December. Revisions could move the headline by a few tenths. But the message of the quarter is already clear, and the October data reinforce it: America is growing fast, firms are getting more from each hour worked, and the gains are still not reaching paychecks evenly.
GO DEEPER
The 2026 US Economy Trilogy (3 books, PDF)
Growth from the AI investment boom, the Federal Reserve and the credit economy, and what inflation leaves in the household budget: the three forces behind this quarter’s numbers, analysed in Dr. Driss Effina’s three new research books. About 900 pages in English PDF.
$59 instead of $90, or $41.30 with the code YEAREND30 until 1 December 2026.
Read the free excerpts first:
Artificial Intelligence and Durable American Growth,
Federal Reserve Decisions and the American Credit Economy and
Inflation and Household Purchasing Power in the United States.
Sources
- U.S. Bureau of Economic Analysis, GDP (Advance Estimate), 3rd Quarter 2026, 29 October 2026.
- U.S. Bureau of Economic Analysis, GDP advance estimate, Q3 2026, full release (PDF).
- U.S. Bureau of Economic Analysis, Personal Income and Outlays, September 2026, 29 October 2026.
- U.S. Bureau of Economic Analysis, Release schedule (second estimate 25 November, third estimate 23 December 2026).
- U.S. Bureau of Labor Statistics, Consumer Price Index, September 2026, 14 October 2026.
- U.S. Bureau of Labor Statistics, Consumer Price Index, October 2026, 10 November 2026.
- U.S. Bureau of Labor Statistics, Real Earnings, October 2026, 10 November 2026.
- U.S. Bureau of Labor Statistics, The Employment Situation, October 2026, 6 November 2026 (includes revisions to September).
- U.S. Bureau of Labor Statistics, Productivity and Costs, Third Quarter 2026, Preliminary, 5 November 2026.
- Board of Governors of the Federal Reserve System, Federal Reserve issues FOMC statement, 28 October 2026.
Driss EFFINA, PhD
The opening pages of our four country reports: United States, United Kingdom, Japan and China. A free PDF, sent to your inbox.
You will also receive occasional analysis from Global Strategy Files. Unsubscribe in one click, at any time.