
The Quiet Farm Recession: Record Aid, Shrinking Market Income and Rising Bankruptcies

Driss EFFINA, PhD Independent Researcher, Global Strategy Files. Decoded, 11 November 2026. Reading time: about 9 minutes.
Key takeaways
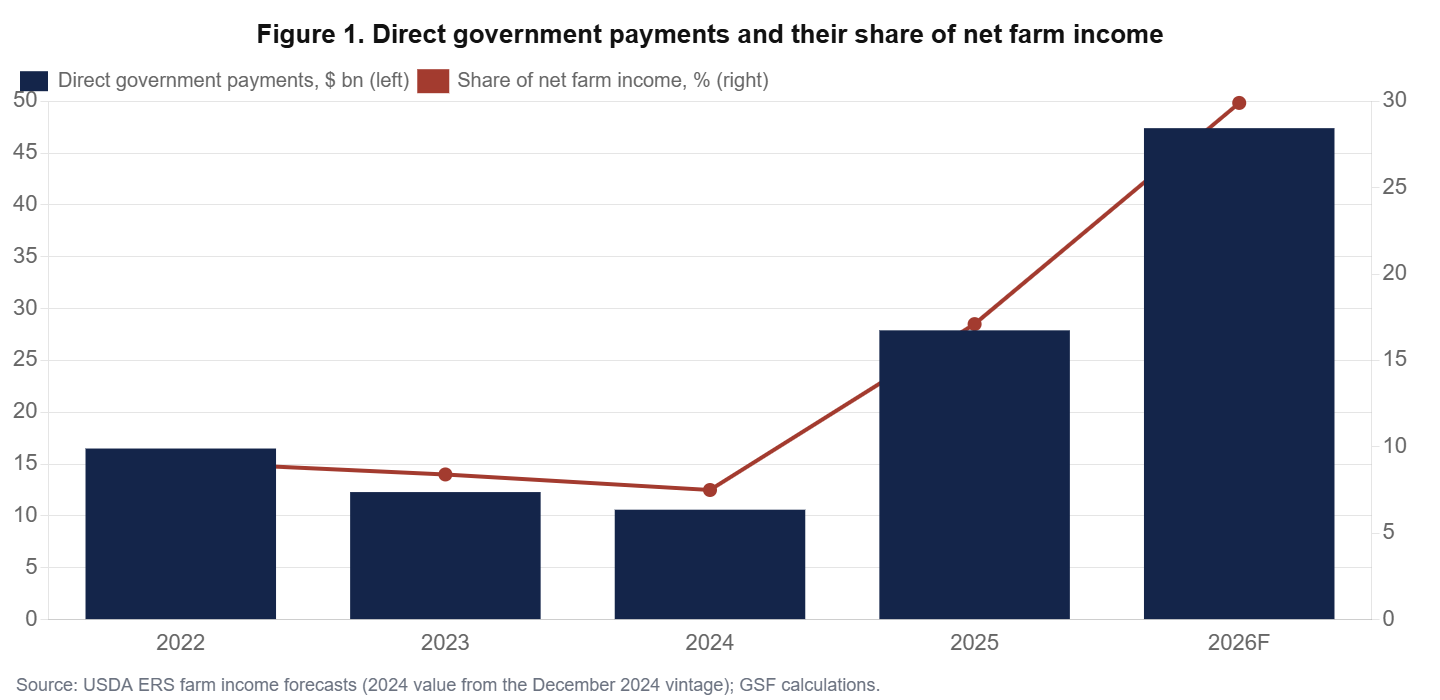
- USDA forecasts net farm income of $158.4 billion in 2026, down 5.5% in real terms, despite record direct government payments of $47.4 billion, up 70% in a year.
- Excluding direct payments, market-derived farm income falls to about $111 billion in 2026, its lowest level in our 2022 to 2026 window and 33% below 2022.
- Government payments now equal about 30% of net farm income, against 7% to 9% in 2022 to 2024. American row-crop agriculture has become a partly publicly financed sector.
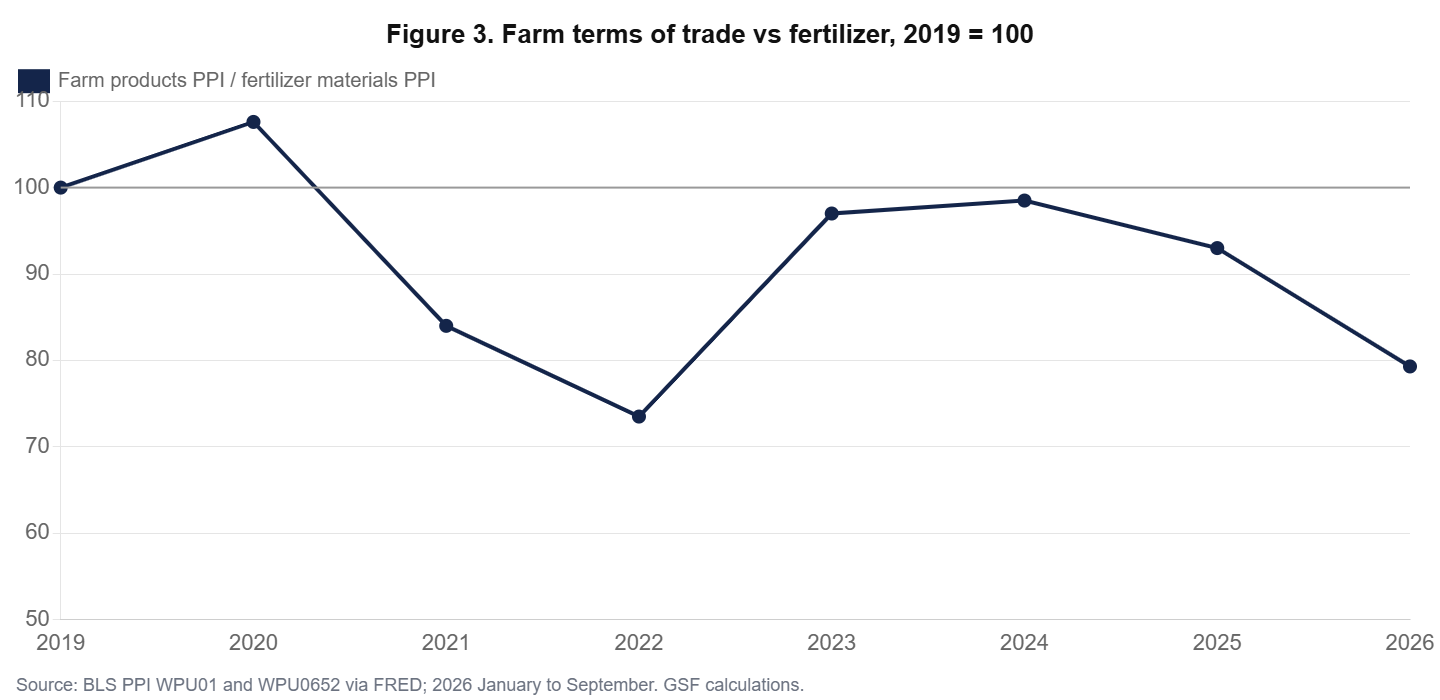
- Farm product prices relative to fertilizer prices, our measure of the farm terms of trade, fell to 79 (2019 = 100) in 2026, close to the low of the 2022 fertilizer shock.
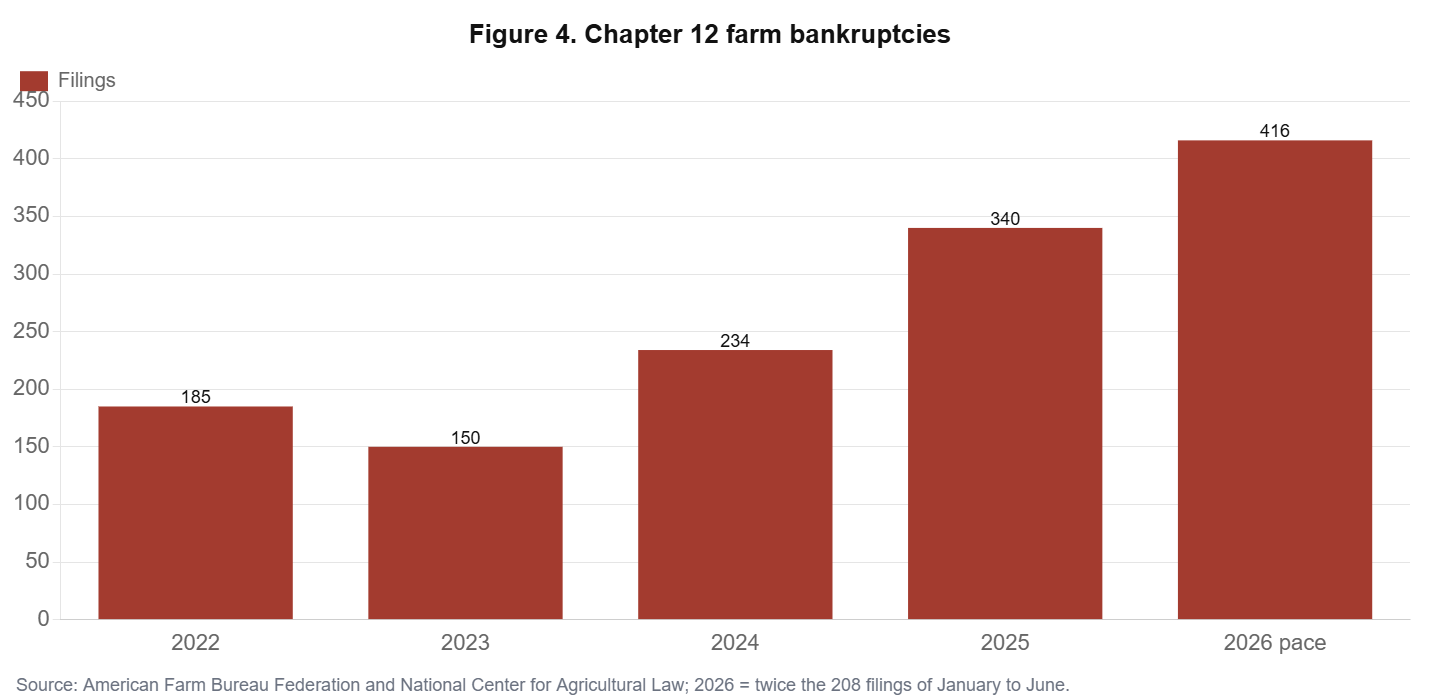
- Chapter 12 bankruptcies rose from 150 in 2023 to 340 in 2025 and are on pace for more than 400 in 2026, more than double the 2023 level.
- With farm debt near $625 billion, each percentage point of interest costs the sector about $6 billion a year, roughly one eighth of all direct payments.
Record harvests, failing farms
American agriculture presents a strange picture in 2026. Harvests are large, cattle prices are near records and land values are high. Yet farm bankruptcies are rising for a third consecutive year, implement dealers report unsold tractors, and Congress and the administration have poured unprecedented sums into the sector. In April 2026, the number of Chapter 12 bankruptcies reached its highest monthly level in six years, and the first half of the year ended with 208 filings.
This article argues that the United States is going through a quiet farm recession in the grain and oilseed economy, masked in the aggregate statistics by two forces: the boom in cattle, analysed in the first article of this series, and an extraordinary increase in government payments. We separate market income from public support, measure the terms of trade facing crop farmers, and assess the financial vulnerability of the sector.
The headline and what lies beneath
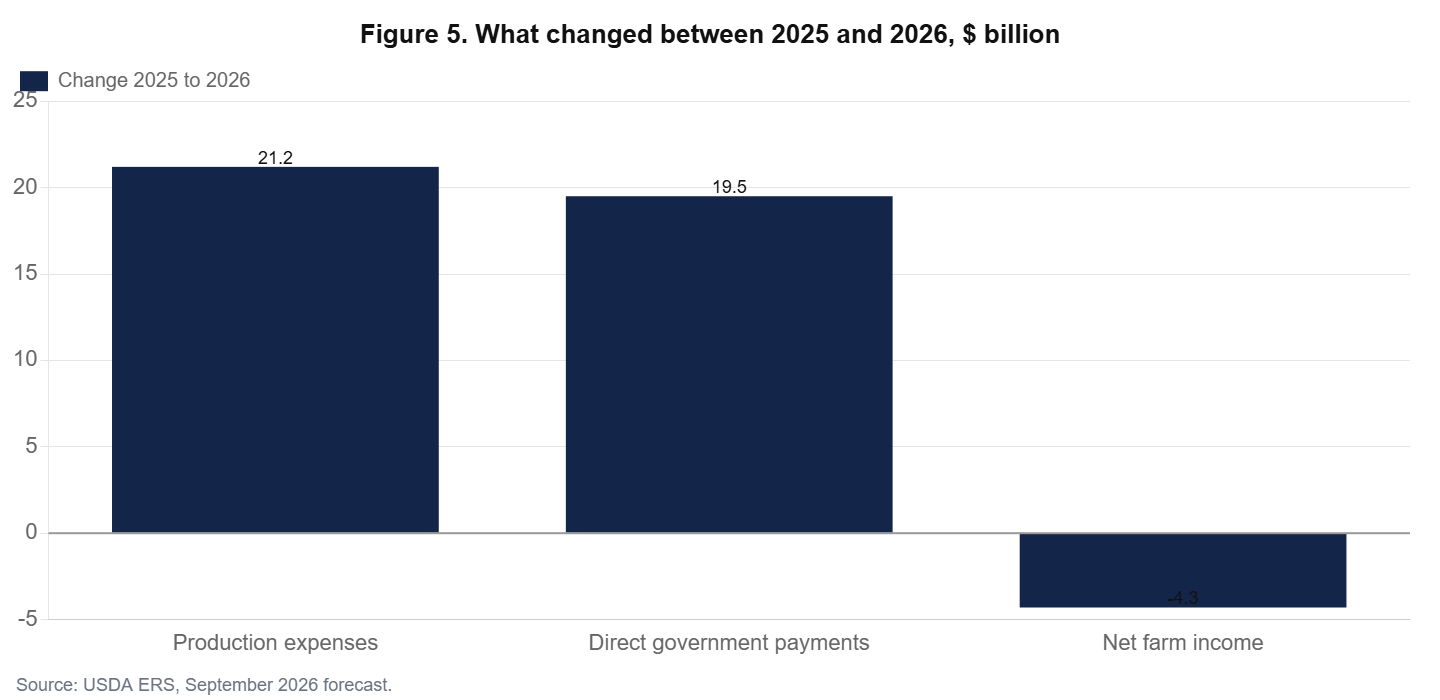
In its September 2026 forecast, the Department of Agriculture put net farm income at $158.4 billion in 2026, down 2.6% in nominal terms and 5.5% after inflation from a revised $162.7 billion in 2025. That decline looks modest. But it includes direct government payments forecast at $47.4 billion, up $19.5 billion or 69.8% from 2025, a record in nominal terms, above even the pandemic payments of 2020. The increase in payments equals 92% of the $21.2 billion increase in farm production expenses, which reached $492.8 billion.
Subtracting direct payments from net farm income gives a simple measure of market-derived income (Figure 2 and Table 1). It was $165 billion in the record year 2022, fell to about $130 to $135 billion in 2023 to 2025, and drops to $111 billion in 2026. In other words, the income that farms earn from selling their products, net of costs, has fallen by a third in four years. The share of net farm income coming from direct government payments has risen from 9% in 2022 to about 30% in 2026.
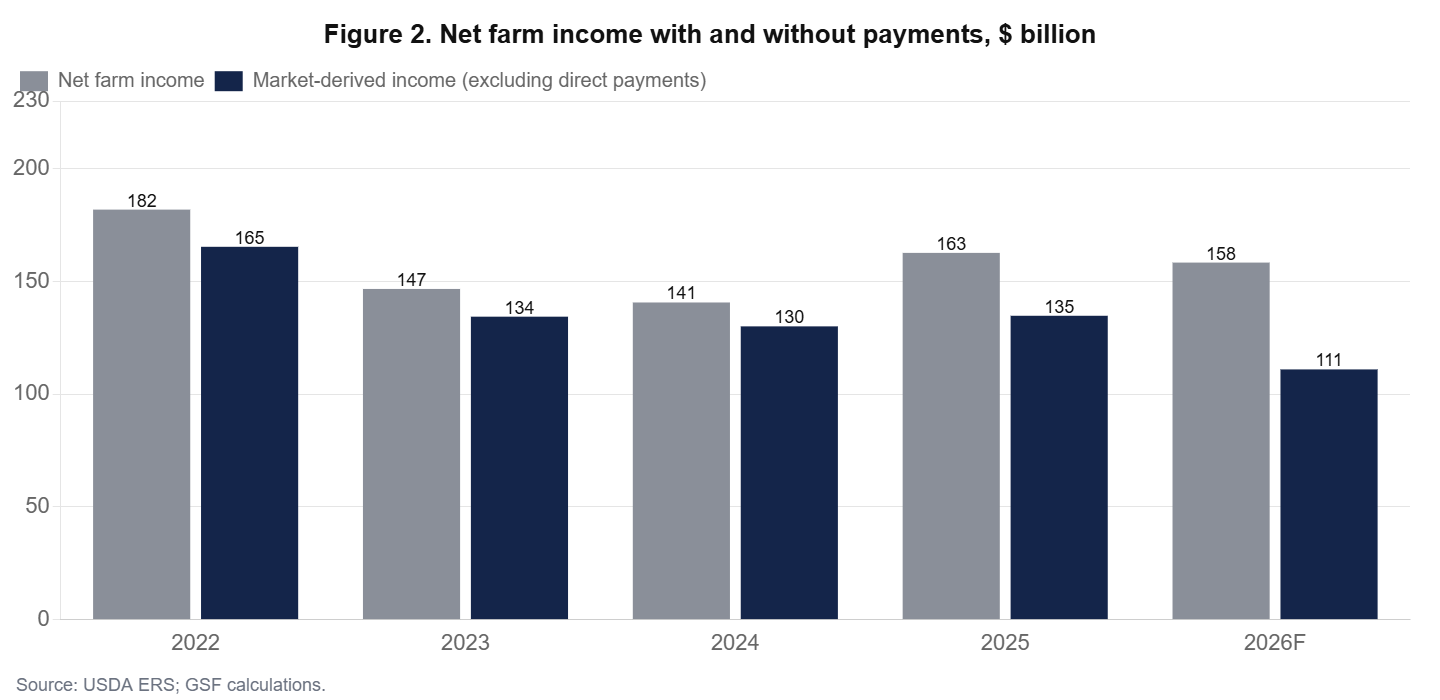
Table 1. Net farm income, government payments and market-derived income ($ billion)
| Year | Net farm income | Direct government payments | Market-derived income | Payments as % of income |
|---|---|---|---|---|
| 2022 | 181.9 | 16.5 | 165.4 | 9.1 |
| 2023 | 146.7 | 12.3 | 134.4 | 8.4 |
| 2024 | 140.7 | 10.6 | 130.1 | 7.5 |
| 2025 | 162.7 | 27.9 | 134.8 | 17.1 |
| 2026 (forecast) | 158.4 | 47.4 | 111.0 | 29.9 |
A terms-of-trade squeeze
Why has market income fallen so much? The answer lies in relative prices. Grain and oilseed prices fell from their 2022 peaks as global supplies recovered and as China, the largest buyer of US soybeans, shifted purchases to Brazil during the trade conflict. Input costs did not follow. Fertilizer prices, which had more than doubled in 2021 and 2022, eased in 2023 and 2024 and then rose again in 2025 and 2026, driven by natural gas prices and the energy shock linked to the Strait of Hormuz. USDA expects fertilizer expenses to rise 15.3% in 2026 and fuel and oil expenses to reach $21.6 billion, up $4.8 billion.
We measure the farm terms of trade as the producer price index for farm products divided by the producer price index for fertilizer materials, set at 100 in 2019 (Figure 3). The ratio fell to 73.5 in 2022, recovered to about 97 to 98 in 2023 and 2024, and has fallen back to 79.3 in 2026. Farmers are again selling their output at prices that buy a fifth less fertilizer than before the pandemic. Because fertilizer is bought months before harvest, the 2026 squeeze will weigh on 2027 cash flows as well.
Two agricultures
The national figures conceal a sharp divergence. Cattle ranchers are enjoying record prices because the herd is at its smallest since 1951. Cash receipts for cattle rose 39% between 2020 and the 2026 forecast according to the American Farm Bureau Federation. Grain and oilseed farmers, concentrated in the Midwest, the Plains and the Mississippi Delta, face low prices and high costs. The geography of bankruptcies reflects this split: Arkansas led the country in 2025 with 33 filings, Minnesota in the first quarter of 2026, and California, Indiana and Texas also figure prominently in 2026.
The divergence matters for policy. Ad hoc payments allocated in proportion to crop acreage go mostly to the larger grain operations, which are not necessarily the most fragile. Smaller farms with high debt, recent land purchases or exposure to specialty crops may receive relatively little. The aggregate safety net therefore looks generous while individual distress rises.
Bankruptcies and the balance sheet
Chapter 12 bankruptcies, a procedure designed for family farmers, rose from 150 in 2023 to 234 in 2024 and 340 in 2025. With 208 filings in the first half of 2026, the pace implies more than 400 for the full year (Figure 4). The absolute numbers remain small compared with the roughly two million farms in the country, but they are a leading indicator: bankruptcy is a last resort, preceded by asset sales, loan restructurings and exits that do not appear in court records.
The sector’s debt is forecast near a record $625 billion. Higher interest rates have raised its cost. As a rule of thumb, each percentage point on the average rate costs the sector about $6.25 billion a year; at an average rate of 6%, interest costs would be about $37.5 billion, equivalent to about 24% of net farm income and close to 80% of all direct payments (Table 2). The Federal Reserve’s tightening cycle therefore transfers to lenders a large part of what Washington transfers to farmers.
Table 2. Interest burden on farm debt under alternative average rates
| Average interest rate on farm debt | 5% | 6% | 7% |
|---|---|---|---|
| Annual interest cost ($ billion) | 31.3 | 37.5 | 43.8 |
| As % of 2026 net farm income | 19.7 | 23.7 | 27.6 |
| As % of 2026 direct payments | 66 | 79 | 92 |
Land values provide a cushion. Because farmland represents the bulk of farm assets, the sector’s debt-to-asset ratio remains far below the levels of the early 1980s farm crisis. That is why we do not expect a systemic crisis. But equity cushions are unevenly distributed. Farmers who bought land at the 2022 peak with variable-rate credit, and rural banks with high concentrations of operating loans to grain producers, are the most exposed. A 10% decline in land values, combined with another year of negative market margins, would turn a quiet recession into a visible one in parts of the Corn Belt and the Delta.
Lessons from the 1980s, and why this time is different
Any discussion of farm distress in the United States is shadowed by the farm crisis of the 1980s, when high interest rates, falling land values and collapsing exports drove tens of thousands of farms out of business and hundreds of rural banks into failure. Some ingredients are present today: high rates, weak export demand for grains and a squeeze between output prices and input costs. Others are absent. Farm balance sheets are far stronger, with debt representing a much smaller share of assets than in 1980 to 1985. Land values have not collapsed. And the government has shown that it will provide large-scale support quickly, through emergency payments in 2018 to 2020 and again in 2025 and 2026.
The difference changes the form that distress takes. Instead of a wave of foreclosures, the current recession works through slow erosion: smaller margins, deferred investment, consolidation of operations, exits by older farmers without successors, and pockets of acute stress among those who borrowed heavily at the top of the cycle. That is why bankruptcy counts, which capture only the most severe cases, rise even as the aggregate income figures look tolerable.
Table 3. Then and now: indicators of farm stress
| Indicator | Early 1980s crisis | 2026 |
|---|---|---|
| Interest rates | Prime rate near 20% at the peak | Fed tightening; farm loan rates well above 2021 levels |
| Land values | Fell by roughly a quarter or more nationally | Near record levels |
| Exports | Collapsed after the grain embargo and strong dollar | Soybean share of China lost to Brazil |
| Government support | Large but slow | Record $47.4 bn of direct payments |
| Bankruptcies | Thousands of farms | Over 400 Chapter 12 filings on pace |
The cattle exception and the cost of rebuilding
Cattle are the bright spot of American agriculture in 2026. With the national herd at its smallest since 1951, prices for calves and feeder cattle reached records, and cow-calf operators enjoyed their best returns in decades. As the first article of this series showed, those prices are a scarcity signal that should encourage herd rebuilding. But rebuilding requires ranchers to hold back heifers and forgo current sales, and to finance more animals at high interest rates. Grain farmers who also run cattle, a common combination in the Plains, are using cattle income to offset crop losses, which slows rebuilding further. The two sides of the farm economy are therefore linked: the grain squeeze delays the beef recovery.
Scenarios for 2027
We consider three paths for 2027. In a stabilisation scenario, export deals with China and other buyers lift soybean and corn prices by 10%, fertilizer prices ease with energy prices, and market-derived income recovers toward $130 billion, allowing payments to fall back. In a muddle-through scenario, prices stay near 2026 levels, costs rise modestly, and Congress again provides large ad hoc payments to keep net income near $150 billion; bankruptcies remain elevated. In a stress scenario, a stronger dollar and a good South American harvest push grain prices lower while rates stay high; market-derived income falls below $100 billion, land values start to decline and bankruptcies climb toward the levels of the 2010s peak.
Table 4. Scenario matrix for the farm economy in 2027
| Scenario | Grain prices | Fertilizer and fuel | Market-derived income | Likely policy response |
|---|---|---|---|---|
| Stabilisation | +10% | Easing | about $130 bn | Payments decline |
| Muddle-through | Flat | Modest increase | about $110 bn | New ad hoc aid |
| Stress | -10% | High | below $100 bn | Emergency aid, credit support |
What to watch
- USDA’s December and February farm income forecasts, which will show whether 2027 payments are assumed to fall.
- Federal Reserve district surveys of agricultural credit (Kansas City, Chicago, Minneapolis), especially loan repayment rates and land values.
- Chinese purchases of US soybeans in the 2026 to 2027 marketing year.
- Fertilizer prices ahead of spring 2027 planting, closely tied to natural gas and the Gulf.
- Quarterly Chapter 12 filings, as a leading indicator of acute distress.
The policy question: aid or markets?
Farmers themselves often say that they want markets more than aid. The data support that view. Payments have stabilised income in 2025 and 2026, but they do not restore the terms of trade, rebuild export demand or reduce input costs. The renewal of the farm bill, the trade negotiations with China and other buyers, the year-round sale of E15 ethanol and fertilizer tariff exemptions are more durable levers. So are measures that address the cost side, such as competition in fertilizer supply.
There is also a fiscal question. Direct payments of $47.4 billion are close to the annual cost of major federal programs. If they become a recurring feature, they will need to be budgeted as such, rather than voted as emergencies. A safety net that pays 30% of net income every year is no longer a safety net; it is an income policy.
The cost side: why payments chase expenses
The 2026 forecast contains a striking symmetry. Production expenses rise by $21.2 billion, direct government payments by $19.5 billion, and net farm income falls by $4.3 billion (Figure 5). In effect, almost all of the new federal money is absorbed by higher costs for fertilizer, fuel, interest, labour and rent. Fertilizer expenses alone are expected to rise 15.3%, and fuel and oil expenses by $4.8 billion, reflecting the energy shock of 2026.
This pattern has an uncomfortable implication. Payments that support farm income when costs rise also support the prices of inputs, because suppliers know that farmers can pay. Economists have long debated how much of farm support is capitalised into land values and rents; in a year like 2026, a share of it is also passed on to fertilizer manufacturers, fuel distributors and lenders. A policy that lowered input costs directly, for example by easing tariffs on fertilizer imports, as the administration did for most fertilizers, or by increasing competition among suppliers, could achieve the same income effect at a lower fiscal cost.
Labour costs are another pressure. Agriculture relies heavily on immigrant labour, and tighter immigration enforcement since 2025 has raised wages and reduced the availability of seasonal workers in fruit, vegetable, dairy and meat processing. Those effects are concentrated in specialty crops and livestock rather than in grain, but they contribute to the rise in production expenses and to the bankruptcies recorded in California, which led the country in the first half of 2026 with 25 filings.
Conclusion
The American farm economy is not in crisis in the aggregate, but its grain and oilseed core is in a quiet recession. Market-derived income has fallen by a third since 2022, the terms of trade against fertilizer are near their worst level in years, and bankruptcies are on pace to exceed 400. Record government payments have prevented a sharp fall in reported farm income, at the cost of making nearly a third of that income dependent on Washington. The next two years will test whether exports and input costs improve before public support reaches its political limits.
Robustness and limits
Our measure of market-derived income subtracts direct government payments but leaves crop insurance indemnities in place. Crop insurance is partly subsidised by the government, so the true market income is lower than our figure; on the other hand, farmers pay premiums for that insurance. Including the public share of insurance would raise the dependency ratio above 30%. The 2024 figure comes from an earlier USDA vintage and has since been revised; the trend we describe does not depend on it.
The terms-of-trade index compares broad price indices. Fertilizer is only one input; seed, chemicals, fuel, labour, rent and interest matter too. But fertilizer is the most volatile large input for grain farmers and the one most exposed to the energy shock of 2026, which is why we use it. A broader index of input costs would show a smaller swing but the same direction: production expenses rose 4.5% in 2026 while crop prices fell or stagnated for much of the year.
Table A1. Data appendix: farm prices and input costs, annual averages
| Year | PPI farm products | PPI fertilizer materials | Terms of trade (2019 = 100) | Soybeans ($/t, world) | Maize ($/t, world) |
|---|---|---|---|---|---|
| 2019 | 161.5 | 219.7 | 100.0 | 327 | 170 |
| 2020 | 157.9 | 199.6 | 107.6 | 350 | 166 |
| 2021 | 198.0 | 320.6 | 84.0 | 505 | 259 |
| 2022 | 250.7 | 464.2 | 73.5 | 570 | 318 |
| 2023 | 229.5 | 321.7 | 97.0 | 520 | 251 |
| 2024 | 222.8 | 307.6 | 98.5 | 405 | 190 |
| 2025 | 237.7 | 347.7 | 93.0 | 381 | 203 |
| 2026 (Jan to Sep) | 239.1 | 409.9 | 79.3 | 430 | 214 |
Methodological note
Market-derived income is net farm income minus direct government payments; it still includes crop insurance indemnities. Values are nominal and come from successive USDA ERS forecast vintages (2024 from December 2024; 2025 and 2026 from September 2026). The terms-of-trade index divides the PPI for farm products (WPU01) by the PPI for fertilizer materials (WPU0652), annual averages, 2026 January to September. The bankruptcy pace for 2026 doubles the first-half count. Interest scenarios are illustrative.
GO DEEPER
The 2026 US Economy Trilogy (3 books, PDF)
Growth from the AI investment boom, the Federal Reserve and the credit economy, and what inflation leaves in the household budget: the forces behind this article, analysed in three research books by Dr. Driss Effina. About 900 pages in English PDF.
$59 instead of $90
Sources
- USDA Economic Research Service, Farm Income and Financial Forecasts, September 2026 update (webinar transcript, 3 September 2026) and February 2026; American Farm Bureau Federation, Market Intel; National Center for Agricultural Law, farm bankruptcy counts; Farm Bureau, USDA Revises Farm Income Higher but Costs Still Bite, September 2026.
- BLS producer price indexes via FRED; Purdue University, How might the past four years of economic shocks inform the next Farm Bill agenda; Choices Magazine, Federal Government Payments to American Farmers and Ranchers; Reuters and Minnesota Reformer reporting on farm distress, 2026.
- Driss EFFINA, PhD | Independent Researcher, Global Strategy Files | globalstrategyfiles.com
Driss EFFINA, PhD
The opening pages of our four country reports: United States, United Kingdom, Japan and China. A free PDF, sent to your inbox.
You will also receive occasional analysis from Global Strategy Files. Unsubscribe in one click, at any time.