
The Federal Retreat: What the SNAP and Medicaid Cost Shift Will Cost Each State

Driss EFFINA, PhD Independent Researcher, Global Strategy Files. Decoded, 11 November 2026. Reading time: about 8 minutes.
Key takeaways
- Using FY2025 payment error rates, 41 states would owe a share of SNAP benefit costs from fiscal 2028. The benefit share alone totals about $10.8 billion a year; with the higher administrative share already in force since October 2026, the new cost to states reaches about $13.5 billion.
- Relative to the size of their economies, the most exposed states are New Mexico (11.1 basis points of GDP), Hawaii (10.1), Oregon (9.3) and Oklahoma (9.2). In dollars, California ($2.5 billion), New York ($1.3 billion) and Florida ($1.0 billion) lead.
- 70% of the benefit cost falls in the top bracket: states with error rates of 10% or more, which pay 15% of benefits.
- The schedule creates cliffs. Michigan and North Dakota (9.89%) sit 0.11 point below the 10% threshold; crossing it would cost Michigan an extra $153 million a year. Once sampling error is taken into account, Michigan’s expected cost is about $371 million rather than $306 million.
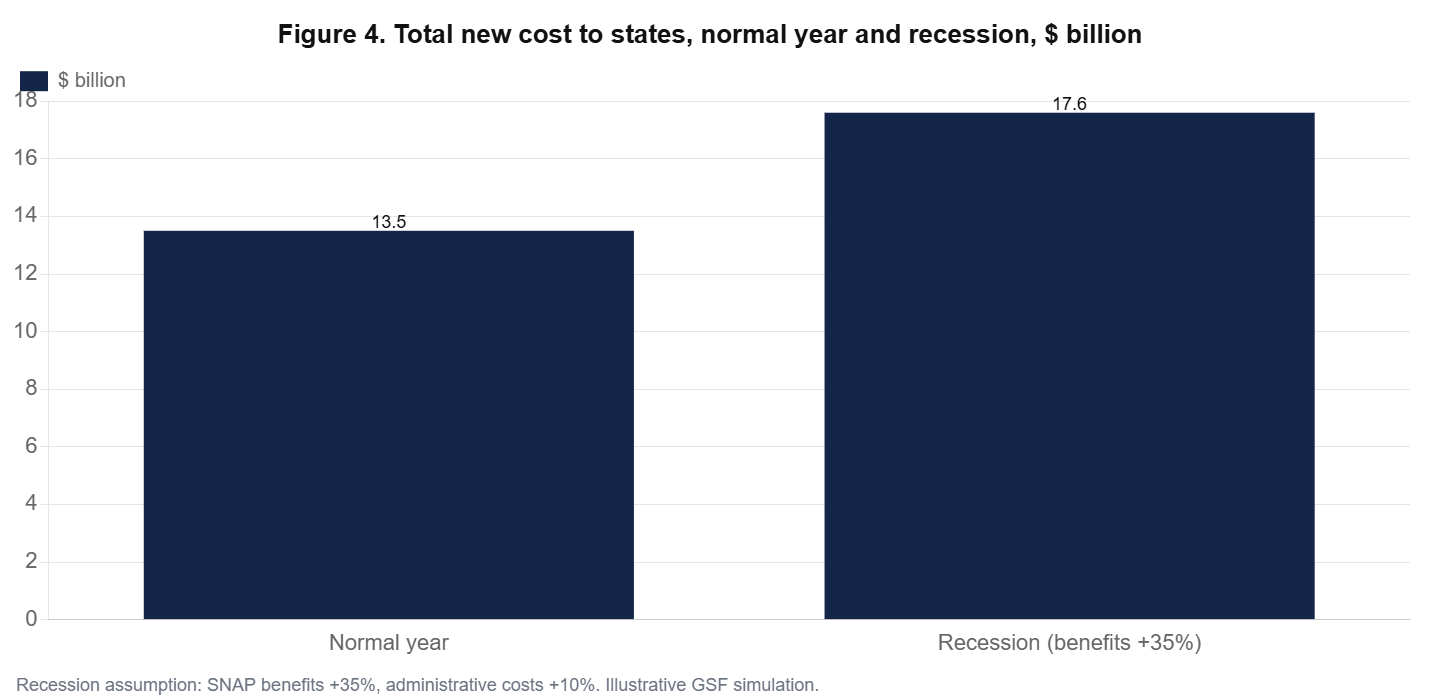
- In a recession that lifts SNAP benefits by 35%, the annual cost to states would rise from about $13.5 billion to $17.6 billion, at the moment their revenues fall. Federal policy has added a new source of pro-cyclical pressure to state finances.
A new kind of federalism
For more than half a century, the federal government has paid the entire cost of food assistance benefits under SNAP, and states have shared the administrative costs equally. That arrangement made SNAP one of the most powerful automatic stabilisers in the American economy: when unemployment rises, benefits expand without any state having to find the money. The One Big Beautiful Bill Act, signed in July 2025, changes this in three steps. Since 1 October 2026, states pay 75% of SNAP administrative costs instead of 50%. From fiscal year 2028, they will pay a share of benefits that depends on their payment error rate. And Medicaid work and community engagement requirements must be implemented by January 2027, with new administrative costs.
This article quantifies the exposure of each state, identifies the threshold effects built into the law, and simulates what the new rules would mean in a downturn. The purpose of the reform, to give states a stake in program integrity, has a legitimate rationale. The question here is what it does to state budgets.
How the cost share works
The benefit cost share depends on each state’s payment error rate, the share of benefits paid in the wrong amount, too much or too little. Below 6%, the state pays nothing. Between 6% and 8% it pays 5% of benefits, between 8% and 10% it pays 10%, and at 10% or above it pays 15%. For fiscal 2028, states may use their FY2025 or FY2026 error rate; afterwards, the rate from three years earlier applies. States with very high error rates, above 13.34%, receive a temporary exemption of up to two years, a provision critics say rewards the worst performers.
The Department of Agriculture published FY2025 error rates in late June 2026. The national rate was 10.62%, almost twice the 6% threshold. Only nine states were below 6%; South Dakota had the lowest rate, 2.47%, and Alaska the highest, 23.15%.
The size of the bill
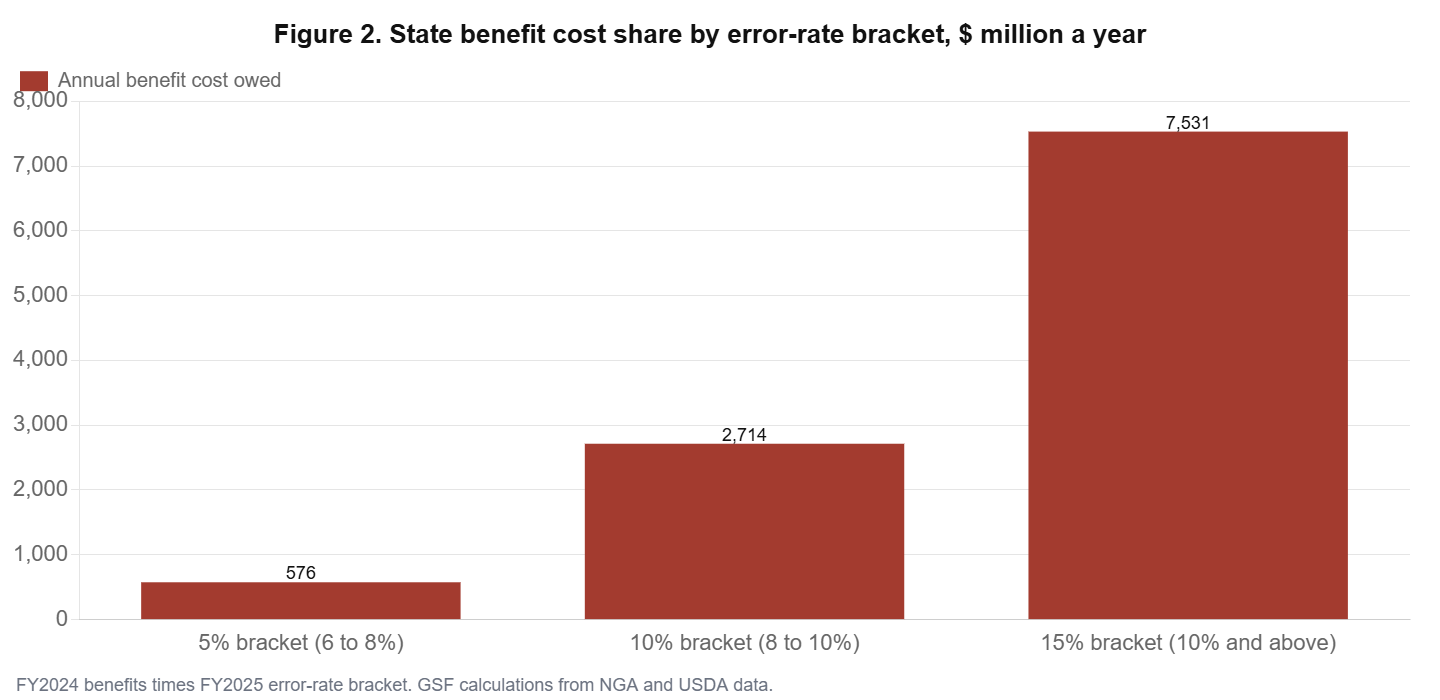
Combining FY2024 benefit levels with FY2025 error rates, as compiled by the National Grocers Association, the benefit share would cost states about $10.8 billion a year. Adding the increase in the administrative share brings the new annual cost to about $13.5 billion. Figure 2 shows that 70% of the benefit cost, $7.5 billion, comes from states in the 15% bracket.
In absolute terms the largest bills fall on the largest states: California would face a new annual cost of about $2.5 billion, New York $1.3 billion, Florida $1.0 billion, Texas $806 million and Illinois $754 million. But a dollar of new cost weighs differently in a large and a small economy. We therefore divide each state’s new cost by its 2025 GDP (Figure 1). For the country as a whole, the new cost equals 4.4 basis points of GDP. New Mexico, where the error rate is 16.8% and SNAP is large relative to the economy, faces 11.1 basis points, followed by Hawaii, Oregon and Oklahoma.
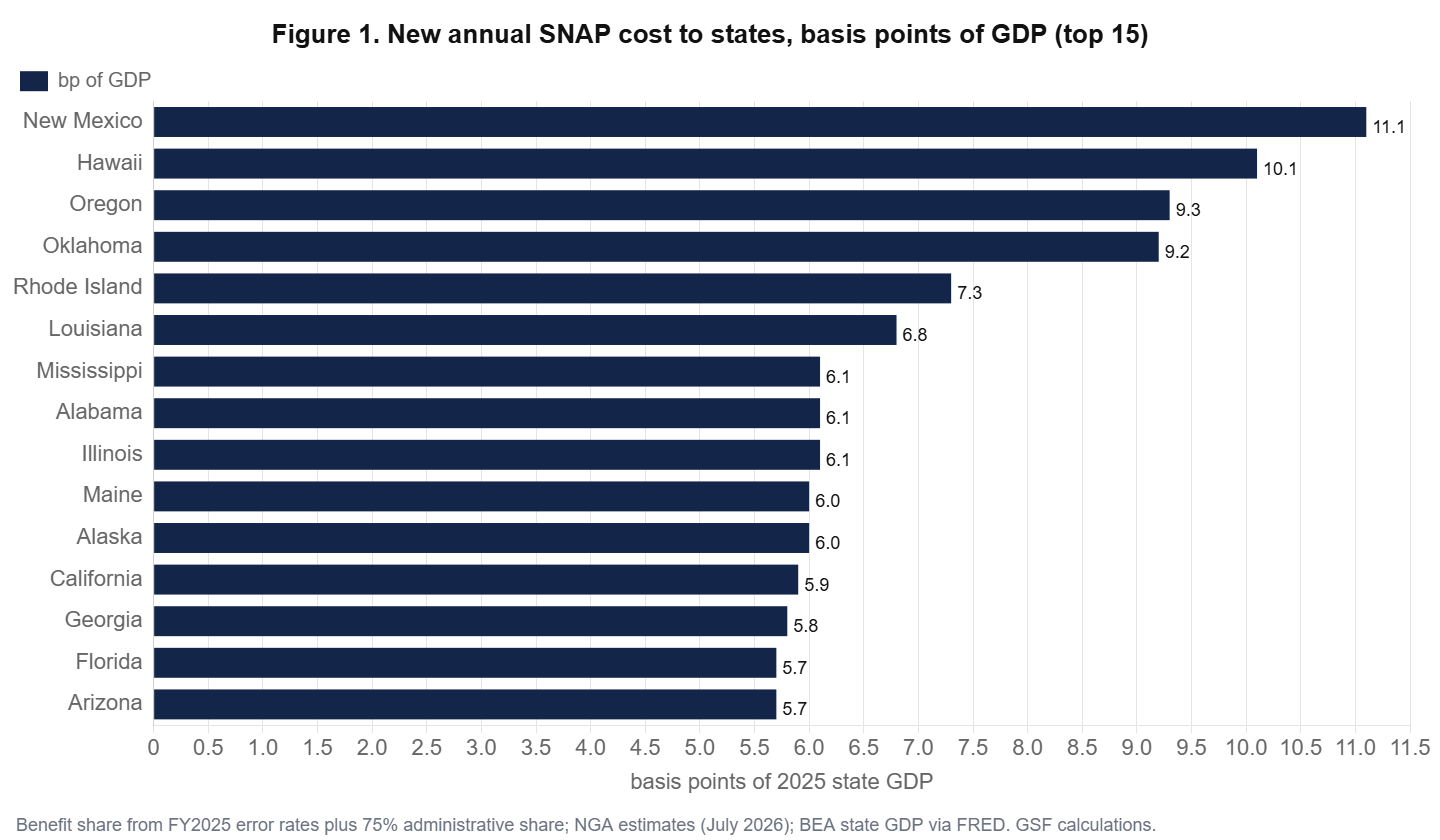
Table 1. The ten states with the highest new SNAP costs relative to GDP
| State | FY2025 error rate | Benefit share | New annual cost ($M) | Basis points of GDP |
|---|---|---|---|---|
| New Mexico | 16.81% | 15% | 169 | 11.1 |
| Hawaii | 10.92% | 15% | 125 | 10.1 |
| Oregon | 14.14% | 15% | 320 | 9.3 |
| Oklahoma | 11.04% | 15% | 253 | 9.2 |
| Rhode Island | 12.42% | 15% | 64 | 7.3 |
| Louisiana | 8.14% | 10% | 232 | 6.8 |
| Mississippi | 9.51% | 10% | 99 | 6.1 |
| Alabama | 9.52% | 10% | 206 | 6.1 |
| Illinois | 14.67% | 15% | 754 | 6.1 |
| Maine | 10.81% | 15% | 61 | 6.0 |
The ranking does not follow party lines. It includes states governed by both parties, and states with very different SNAP policies. What the most exposed states have in common is a combination of high error rates and large caseloads relative to their economies.
The cliffs in the formula
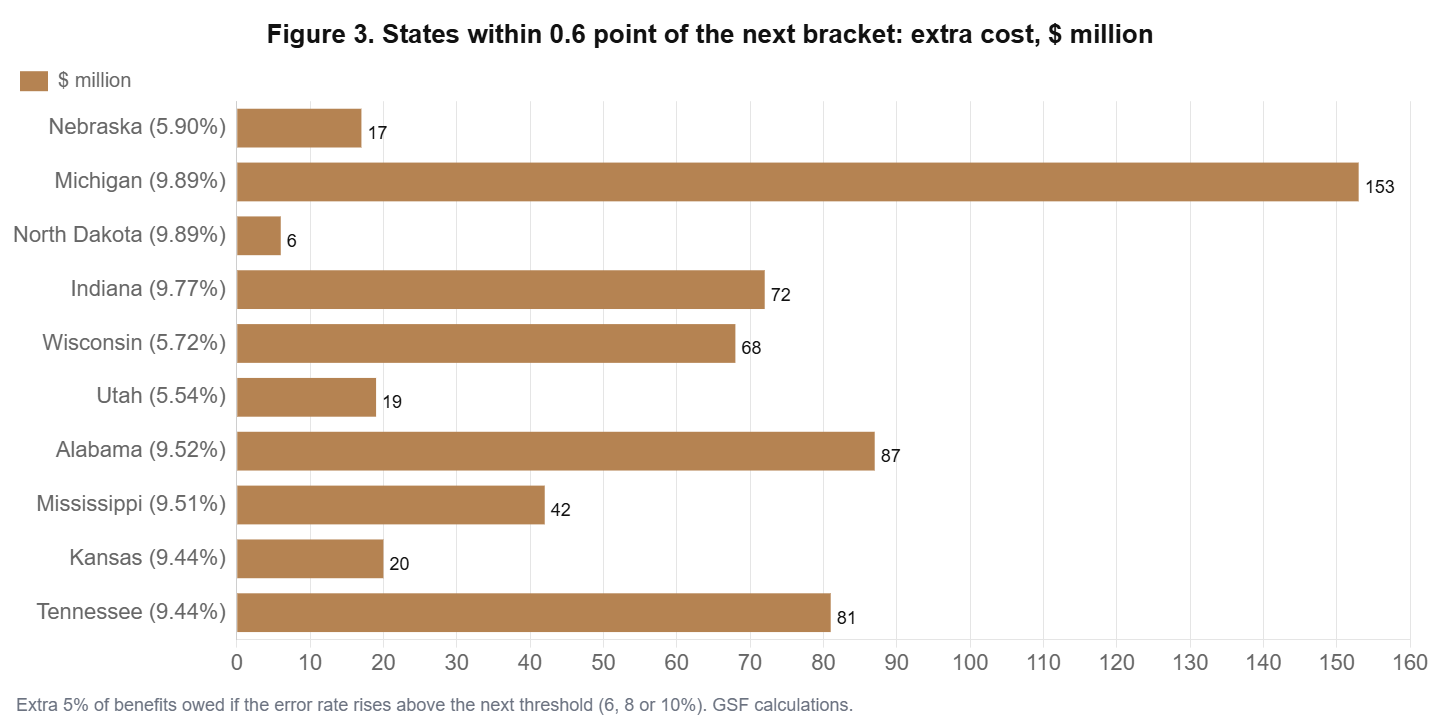
A schedule with discrete brackets creates sharp incentives at each threshold. A state just below 10% pays 10% of benefits; a state just above pays 15%. Figure 3 lists the states within 0.6 percentage point of the next threshold and the extra annual cost of crossing it. Michigan and North Dakota, both at 9.89%, are 0.11 point below the top bracket; for Michigan, crossing would cost an additional $153 million a year. Nebraska, at 5.90%, is 0.10 point below the first threshold.
The problem is that error rates are estimated from samples of cases and carry statistical uncertainty. Researchers at the Hamilton Project have shown that the sampling error is large relative to the width of the brackets. We model this explicitly by assuming a standard error of one percentage point around each state’s measured rate and computing the expected cost share. For states far from a threshold, nothing changes. For states near one, the difference is material (Table 2). Michigan’s expected cost rises from $306 million to $371 million; Wisconsin and Nebraska, which owe nothing on their point estimates, face expected costs of $27 million and $8 million.
Table 2. Deterministic versus expected benefit cost for states near a threshold ($ million a year)
| State | Error rate | Cost on point estimate | Expected cost with sampling error | Difference |
|---|---|---|---|---|
| Michigan | 9.89% | 306 | 371 | +65 |
| Indiana | 9.77% | 143 | 170 | +27 |
| Alabama | 9.52% | 173 | 195 | +22 |
| Tennessee | 9.44% | 162 | 180 | +18 |
| Mississippi | 9.51% | 84 | 95 | +11 |
| Wisconsin | 5.72% | 0 | 27 | +27 |
| Nebraska | 5.90% | 0 | 8 | +8 |
For a state budget office, this uncertainty is costly in itself: it must reserve for the worst bracket or risk a mid-year shortfall. The randomness also weakens the incentive the law intends to create, since a state can improve its administration and still be pushed into a higher bracket by sampling noise.
The pro-cyclical trap
The deepest consequence of the reform is macroeconomic. SNAP caseloads rise in recessions; in the Great Recession, benefits roughly doubled in three years. Under the old rules, that increase was entirely federal. Under the new rules, states pay up to 15% of the increase, at the moment their tax revenues fall and their balanced-budget rules force them to cut spending or raise taxes.
We simulate a moderate recession in which benefits rise 35% and administrative costs 10%. The annual new cost to states rises from about $13.5 billion to $17.6 billion, an increase of $4 billion concentrated in the states with the highest error rates (Figure 4). A recession that also lowers state revenues by 5% to 6% would compound the squeeze. In practice, states would face three choices: cut other spending, tighten SNAP eligibility and administration, or raise taxes. A survey of 39 states by the American Public Human Services Association and the Urban Institute found that 29% saw the cost shift potentially leading to reduced SNAP eligibility.
Medicaid: the second front
Medicaid work requirements for adults in the expansion population take effect by January 2027, along with eligibility checks every six months. These requirements carry immediate administrative costs. Missouri requested about $33 million for technology to implement them; Arizona’s health agency asked for about 300 new staff; New Mexico estimated recurring costs from federal Medicaid and SNAP changes of about $620 million in fiscal 2027, rising to over $1 billion by 2029. The Congressional Budget Office expects the Medicaid provisions of the law to reduce federal spending by $911 billion through 2034 and to increase the number of uninsured by about 10 million. Part of that federal saving will become state cost, through uncompensated care and state-funded programs.
What states are doing
States have begun to respond, along three lines. The first is investment in accuracy. California allocated $84 million to reduce SNAP errors and help counties implement new requirements; Florida, whose error rate fell from 15.1% to 12.97%, budgeted $4 million for an AI-based error detection system; other states are hiring caseworkers and upgrading eligibility systems. The second is budgeting for the cost: Wisconsin’s Legislative Fiscal Bureau estimated about $50 million a year of additional administrative costs, and Colorado about $10.7 million in fiscal 2027 for SNAP administration alone. The third is political: a coalition representing governors, legislatures, counties and cities asked Congress in January 2026 to postpone both the benefit cost share and the higher administrative share until fiscal 2030.
The investment response is the one the law intends to encourage. Our cliff analysis suggests where it pays most. For a state like Michigan, spending even tens of millions of dollars to bring its error rate safely below 10% would be justified by the $153 million a year at stake. For a state with an error rate above 13%, the temporary exemption reduces the immediate incentive, but the cost when the exemption ends is large, which argues for investing early.
Table 3. Return on accuracy: what a one-point reduction in the error rate is worth
| State | Error rate | Bracket after a one-point reduction | Annual saving ($ million) |
|---|---|---|---|
| Michigan | 9.89% | 10% (unchanged) | 0, but removes the cliff risk |
| California | 10.93% | 10% instead of 15% | 619 |
| Texas | 9.34% | 10% (unchanged) | 0 |
| Pennsylvania | 9.21% | 10% (unchanged) | 0 |
| Arizona | 10.80% | 10% instead of 15% | 101 |
| Hawaii | 10.92% | 10% instead of 15% | 37 |
| Nevada | 6.22% | 0% instead of 5% | 50 |
The table illustrates a design problem: the return on improving accuracy is zero for most states unless the improvement crosses a threshold, and very large if it does. A continuous schedule, in which the cost share rises gradually with the error rate, would reward every improvement and remove the lottery created by sampling error.
Three reforms that would keep the incentive and reduce the risk
- A continuous schedule: replace the 0, 5, 10 and 15% brackets with a linear share between 6% and 12% error rates. The average cost would be similar, but cliffs and sampling lotteries would disappear.
- A three-year average error rate: averaging would cut the sampling noise substantially and make costs more predictable for state budgets.
- A recession clause: suspend or cap the benefit cost share when the state or national unemployment rate rises by more than a set amount, preserving SNAP’s role as an automatic stabiliser.
None of these changes would weaken the principle that states should bear part of the cost of their own errors, which is defensible. They would make the policy better at achieving its own goal.
What to watch
- FY2026 error rates, due in mid-2027, which states may choose for their fiscal 2028 cost share.
- State budgets for fiscal 2028, which will have to provision for the first benefit cost share.
- Medicaid work requirement implementation from January 2027 and its effect on enrollment and state administrative costs.
- The farm bill, which could delay or modify the cost share, as several states and members of Congress have requested.
How many states, and which brackets
Figure 5 summarises the distribution of the 50 states across the four brackets on the basis of their FY2025 error rates. Only nine states would pay no benefit share: Idaho, Iowa, Kentucky, Nebraska, South Dakota, Utah, Vermont, Wisconsin and Wyoming. Six would pay 5%, sixteen 10% and nineteen 15%. The concentration in the top two brackets explains why the total bill is large: 35 states would pay at least 10% of their benefits.
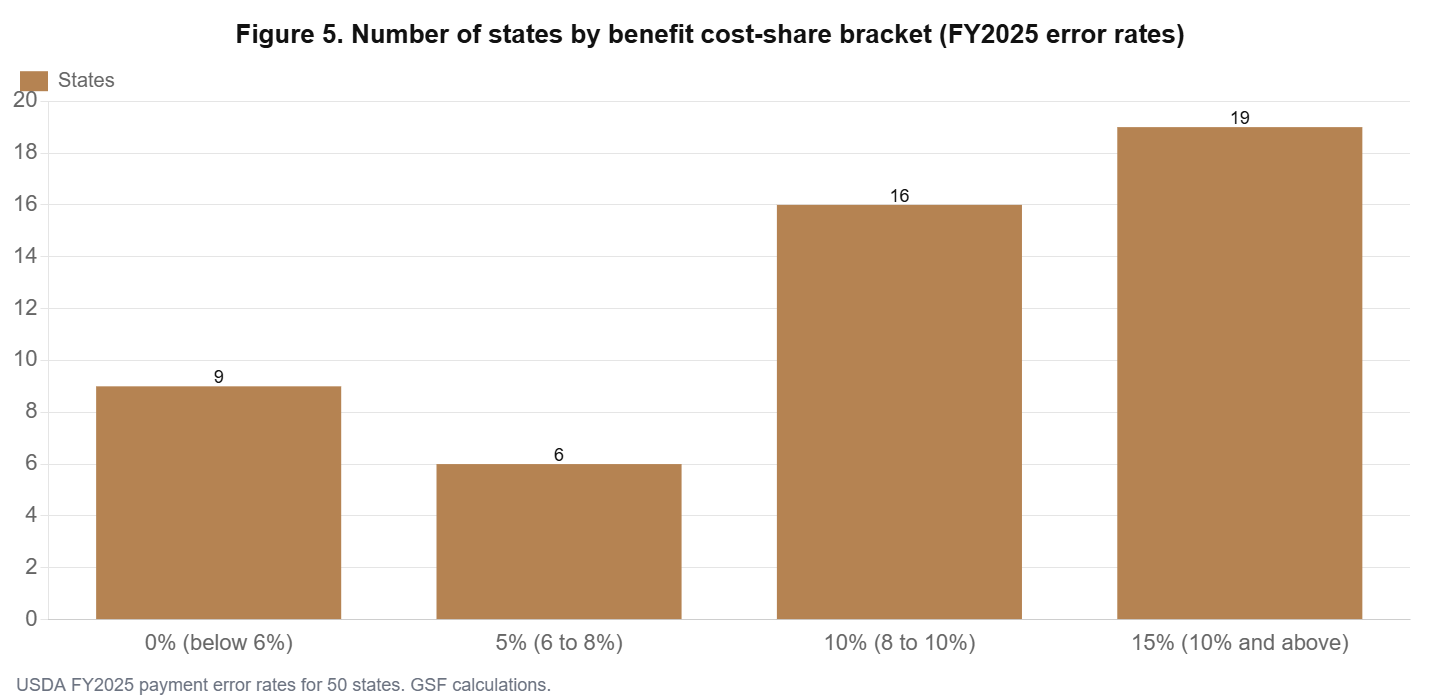
The distribution also shows how far the national program is from the 6% target set by the law. Reaching it would require 41 states to reduce their error rates, many by several points. Some states have done so in the past: Florida’s rate fell from 15.1% to 12.97% in one year, and Missouri’s from 10.54% to 8.67% over two. But error rates also rose in many states after the pandemic, when caseloads surged and staffing was stretched, which suggests that they depend on administrative capacity as much as on effort. States that cut eligibility staff to save money may find that the savings are wiped out by a higher cost share.
Conclusion
The OBBBA cost shift gives states a direct financial stake in the accuracy of SNAP payments, a goal that has merit: a national error rate above 10% is hard to defend. But the design has three weaknesses that our numbers make visible. It concentrates costs in a handful of states relative to their economies; it creates cliffs that sampling error turns into lotteries; and it makes state budgets more pro-cyclical. A graduated schedule, a multi-year average of error rates and a recession clause that suspends the cost share when unemployment rises would preserve the integrity incentive while reducing these risks. Without them, the next downturn will reveal how much of the federal safety net has quietly moved to the states.
Robustness and limits
Our estimates use FY2024 benefit levels. Benefits in fiscal 2028 will differ: caseloads have fallen since mid-2025, from about 41.6 million participants in July 2025 to 36.3 million in June 2026, partly because of the new work requirements, while food prices and benefit amounts have risen. States may also choose their FY2026 error rate, which could move some of them into a lower or higher bracket. Our figures are therefore estimates of the order of magnitude of the exposure, consistent with independent estimates of about $9 to $14 billion a year, not budget forecasts.
The standard error of one percentage point that we use for the sampling analysis is an assumption chosen to illustrate the mechanism. Actual standard errors differ across states, being larger in small states with small samples. The Hamilton Project’s analysis suggests that the uncertainty is large relative to the 2-point width of the brackets, which is the condition that matters for our argument.
Table A1. Data appendix: estimated SNAP cost shift by state
| State | Error rate | Share | Benefit cost ($M) | New cost ($M) | bp of GDP |
|---|---|---|---|---|---|
| Alabama | 9.52% | 10% | 173 | 206 | 6.1 |
| Alaska | 23.15% | 15% | 38 | 44 | 6.0 |
| Arizona | 10.80% | 15% | 302 | 337 | 5.7 |
| Arkansas | 8.81% | 10% | 55 | 77 | 3.9 |
| California | 10.93% | 15% | 1857 | 2519 | 5.9 |
| Colorado | 10.09% | 15% | 195 | 242 | 4.2 |
| Connecticut | 9.08% | 10% | 89 | 129 | 3.4 |
| Delaware | 16.00% | 15% | 38 | 49 | 4.0 |
| Florida | 12.97% | 15% | 991 | 1035 | 5.7 |
| Georgia | 15.21% | 15% | 490 | 545 | 5.8 |
| Hawaii | 10.92% | 15% | 110 | 125 | 10.1 |
| Idaho | 3.85% | 0% | 0 | 5 | 0.4 |
| Illinois | 14.67% | 15% | 670 | 754 | 6.1 |
| Indiana | 9.77% | 10% | 143 | 189 | 3.5 |
| Iowa | 5.34% | 0% | 0 | 13 | 0.5 |
| Kansas | 9.44% | 10% | 41 | 55 | 2.4 |
| Kentucky | 4.70% | 0% | 0 | 53 | 1.7 |
| Louisiana | 8.14% | 10% | 190 | 232 | 6.8 |
| Maine | 10.81% | 15% | 55 | 61 | 6.0 |
| Maryland | 13.08% | 15% | 225 | 277 | 4.9 |
| Massachusetts | 12.49% | 15% | 393 | 436 | 5.4 |
| Michigan | 9.89% | 10% | 306 | 402 | 5.5 |
| Minnesota | 12.58% | 15% | 128 | 172 | 3.3 |
| Mississippi | 9.51% | 10% | 84 | 99 | 6.1 |
| Missouri | 8.67% | 10% | 151 | 179 | 3.8 |
| Montana | 8.86% | 10% | 17 | 24 | 3.0 |
| Nebraska | 5.90% | 0% | 0 | 12 | 0.6 |
| Nevada | 6.22% | 5% | 50 | 72 | 2.6 |
| New Hampshire | 8.85% | 10% | 15 | 21 | 1.6 |
| New Jersey | 6.86% | 5% | 96 | 191 | 2.2 |
| New Mexico | 16.81% | 15% | 154 | 169 | 11.1 |
| New York | 13.18% | 15% | 1103 | 1349 | 5.5 |
| North Carolina | 7.36% | 5% | 147 | 215 | 2.4 |
| North Dakota | 9.89% | 10% | 11 | 18 | 2.2 |
| Ohio | 6.76% | 5% | 159 | 229 | 2.3 |
| Oklahoma | 11.04% | 15% | 226 | 253 | 9.2 |
| Oregon | 14.14% | 15% | 240 | 320 | 9.3 |
| Pennsylvania | 9.21% | 10% | 427 | 534 | 5.1 |
| Rhode Island | 12.42% | 15% | 51 | 64 | 7.3 |
| South Carolina | 8.80% | 10% | 129 | 146 | 3.9 |
| South Dakota | 2.47% | 0% | 0 | 5 | 0.6 |
| Tennessee | 9.44% | 10% | 162 | 225 | 3.8 |
| Texas | 9.34% | 10% | 721 | 806 | 2.7 |
| Utah | 5.54% | 0% | 0 | 13 | 0.4 |
| Vermont | 5.38% | 0% | 0 | 6 | 1.2 |
| Virginia | 12.32% | 15% | 265 | 352 | 4.4 |
| Washington | 6.98% | 5% | 96 | 159 | 1.8 |
| West Virginia | 6.69% | 5% | 28 | 37 | 3.3 |
| Wisconsin | 5.72% | 0% | 0 | 40 | 0.8 |
| Wyoming | 3.96% | 0% | 0 | 5 | 1.0 |
Methodological note
Benefit costs use FY2024 SNAP benefits and FY2025 payment error rates as compiled by the National Grocers Association (July 2026); the District of Columbia is not included. New costs add the benefit share to the increase in the administrative share from 50% to 75%. GDP is 2025 nominal state GDP from BEA via FRED. The expected-cost calculation assumes a normal sampling distribution with a standard error of one point. The recession simulation assumes a 35% rise in benefits and a 10% rise in administrative costs. Actual FY2028 costs will depend on benefit levels and the error rate year each state selects.
GO DEEPER
The 2026 US Economy Trilogy (3 books, PDF)
Growth from the AI investment boom, the Federal Reserve and the credit economy, and what inflation leaves in the household budget: the forces behind this article, analysed in three research books by Dr. Driss Effina. About 900 pages in English PDF.
$59 instead of $90
Sources
- USDA, SNAP payment error rates FY2025 (June 2026); National Grocers Association, Estimated State Cost Share by State, July 2026; Hamilton Project, The SNAP State Cost-Shift Policy Leaves the Program’s Existence to Chance; AEI, SNAP’s New Cost Share Requirement; Cato Institute; Center on Budget and Policy Priorities estimates as reported by MPR News, July 2026.
- Pew Charitable Trusts, Mounting Pressures Usher in a New Budget Era (January 2026) and How States Are Assessing the Impact of Federal Policy Changes (November 2025); Associated Press, January 2026; The New Republic, 2026; BEA state GDP via FRED.
- Driss EFFINA, PhD | Independent Researcher, Global Strategy Files | globalstrategyfiles.com
Driss EFFINA, PhD
The opening pages of our four country reports: United States, United Kingdom, Japan and China. A free PDF, sent to your inbox.
You will also receive occasional analysis from Global Strategy Files. Unsubscribe in one click, at any time.