
The Billionaire Exit Test: What California’s Rejected Wealth Tax Reveals

Driss EFFINA, PhD Independent Researcher, Global Strategy Files. Decoded, 11 November 2026. Reading time: about 10 minutes.
Key takeaways
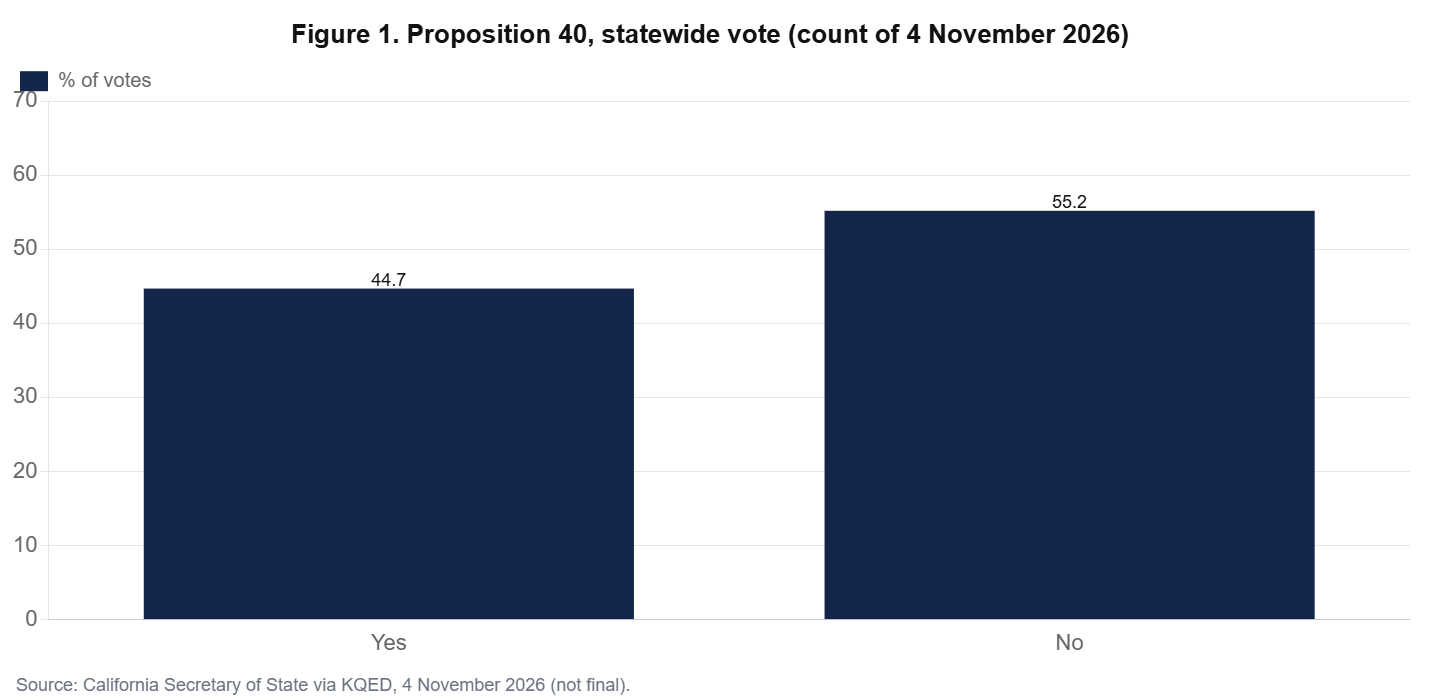
- On 3 November 2026, Californians rejected Proposition 40, a one-time 5% tax on fortunes above $1 billion, by about 55% to 45% in the count available on 4 November. A countermeasure banning wealth taxes was also leading.
- Six publicly reported departures before the residency date removed about $536 billion, close to 30% of the taxable billionaire wealth. That implies a pre-departure base of about $1.8 trillion.
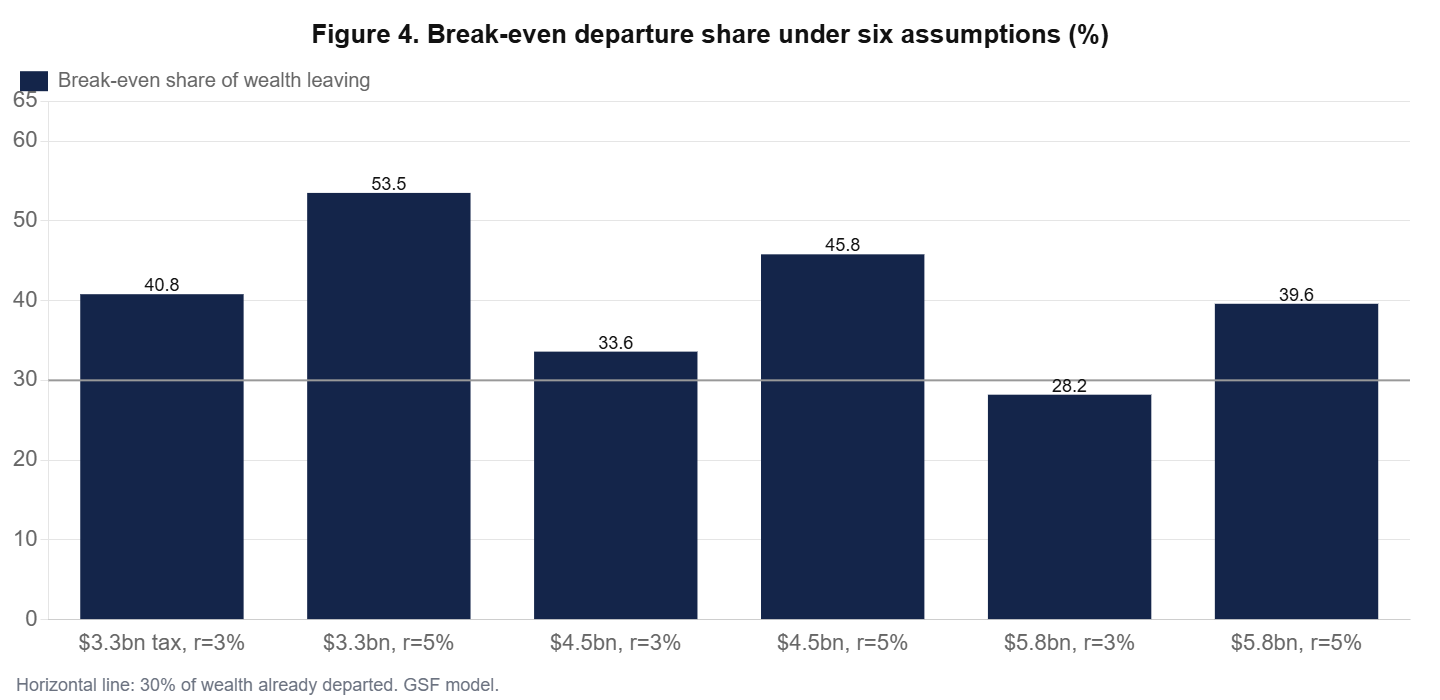
- Our break-even model shows that the tax remains a net gain for the state only if no more than 28% to 54% of that wealth leaves, depending on assumptions; under central assumptions the threshold is 34% to 46%. The base was already close to that range before the vote.
- At a 30% departure rate, the net present value of the tax is positive, between $10 billion and $28 billion. At 45%, it turns negative. The outcome depended less on the tax rate than on the behaviour of a few dozen families.
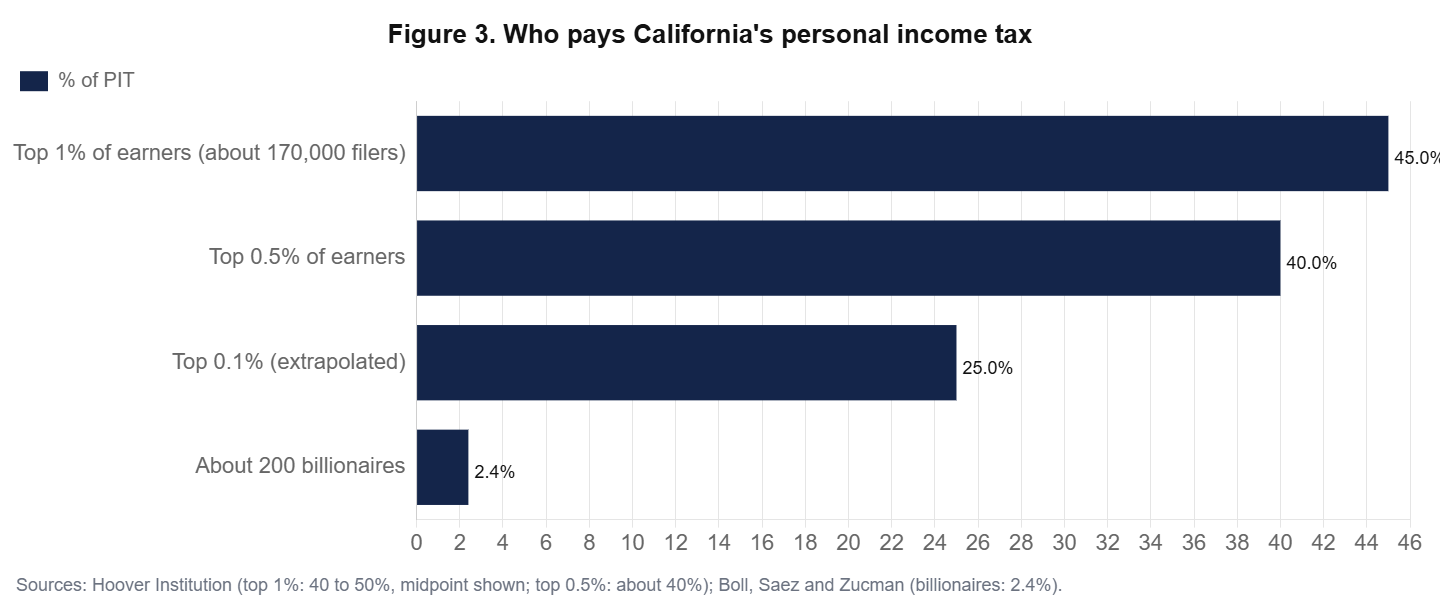
- Billionaires pay only about 2.4% of California’s personal income tax. The real fragility lies one level down: the top 1% of earners, about 170,000 filers, supply 40% to 50% of the tax, whose annual growth has a standard deviation of about 17%.
A vote watched far beyond California
Proposition 40 asked California voters to approve a one-time tax of 5% on the worldwide net worth of residents worth more than $1 billion on 1 January 2026, payable over five years, with most of the revenue reserved for health care to offset federal cuts. Its supporters, led by a health care workers’ union and backed by Senator Bernie Sanders, estimated revenue of about $100 billion. Its opponents, including Governor Gavin Newsom, the state’s business organisations and the teachers’ union, warned that the tax would drive billionaires and their income taxes out of the state. They also placed two countermeasures on the ballot: Proposition 41, which would have counted any new tax under the state spending limit, and Proposition 42, which bans taxes on financial assets and other forms of wealth.
With about half the vote counted on the day after the election, Proposition 40 was rejected by 55.2% to 44.7%, while Proposition 42 was leading. In parallel, voters appeared ready to make permanent the existing income tax surcharge on high earners (Proposition 3), which yields up to $15 billion a year for schools. The result is therefore not a simple rejection of taxing the rich. It is a rejection of taxing wealth, as distinct from income, in one state.
This article does not take sides in that debate. It uses the numbers produced by both camps to answer a narrower question: under what conditions would a state wealth tax raise more than it costs, and what does the episode reveal about California’s public finances?
The base that moved before the vote
The tax applied to residents on 1 January 2026. Between the filing of the initiative and that date, six billionaires publicly moved their residence out of the state. According to Stanford economists Joshua Rauh and Benjamin Jaros, those departures removed $536 billion, or nearly 30% of aggregate billionaire wealth, from the tax base. That implies a pre-departure base of roughly $1.8 trillion, held by about 200 to 260 people depending on the count used.
The estimates of revenue differ by a factor of three. Economists Jasper Boll, Emmanuel Saez and Gabriel Zucman, who supported the initiative, estimated more than $100 billion with comparatively minor effects on income tax revenue. Rauh and Jaros estimated about $30 billion, in a range of $28 to $36 billion, once departures and litigation are counted, and a negative net present value of about $25 billion once the permanent loss of income tax from those who leave is included. The two camps agree on one fact: California’s billionaires pay roughly $3.2 to $5.8 billion a year in state income tax.
A break-even model
The fiscal arithmetic of a one-time wealth tax is a race between a one-off gain and a permanent loss. If a fraction d of the base leaves, the state collects 5% of the remaining wealth, adjusted for valuation and collection, but loses forever the income tax that the departing taxpayers would have paid. We write the net present value as the one-time revenue minus the capitalised value of the lost income tax:
Net value = 0.05 x (1 – d) x W x c minus d x I / r
where W is the pre-departure wealth base ($1.79 trillion), c the collection rate (85%), I the annual income tax paid by billionaires and r the discount rate. Figure 2 plots the net value against the departure share for three values of I.
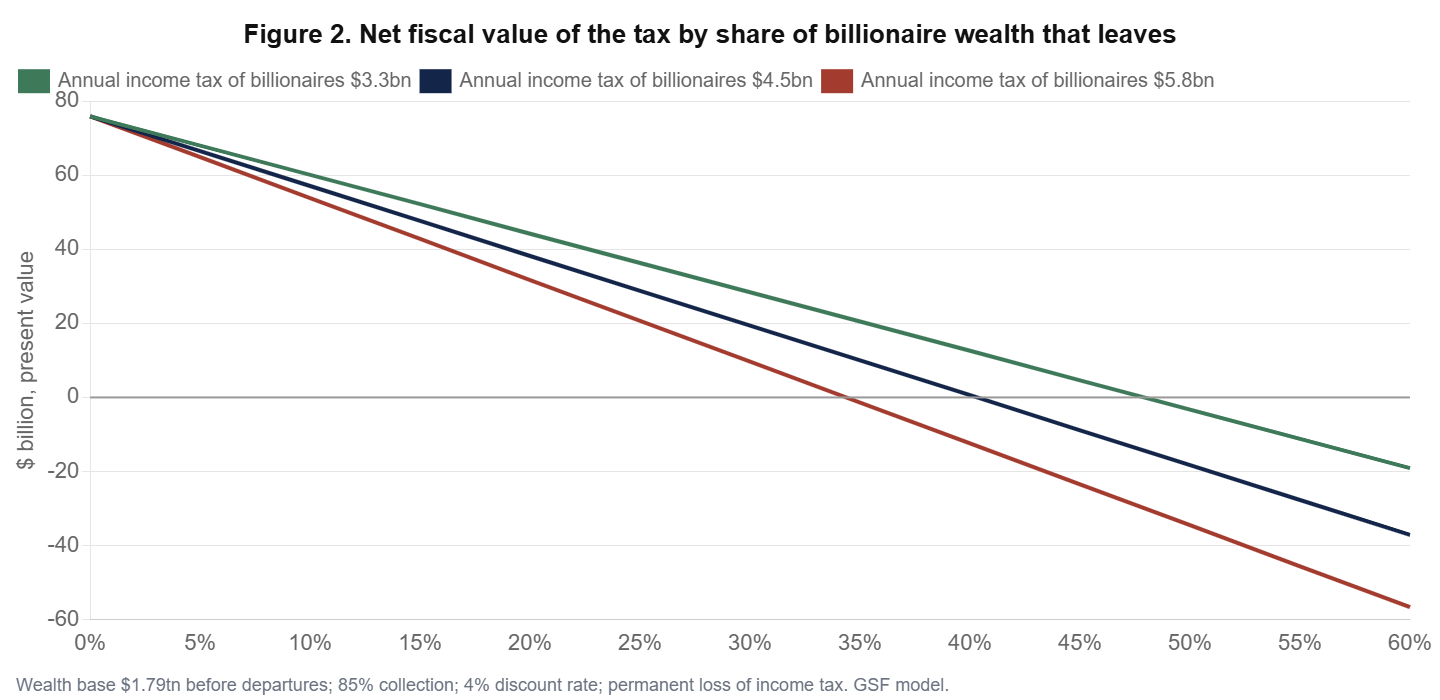
Table 1. Break-even departure share: the tax loses money if more wealth than this leaves
| Annual billionaire income tax | Discount rate 3% | Discount rate 5% |
|---|---|---|
| $3.3 billion | 41% | 54% |
| $4.5 billion | 34% | 46% |
| $5.8 billion | 28% | 40% |
Two conclusions follow. First, with the 30% departure already recorded, the tax would still have produced a positive net value, between about $10 billion and $28 billion depending on the income tax assumption. That is far below the $100 billion promised, but it is not negative. Second, the margin was thin: a further 5 to 15 points of departures, which is what Rauh and Jaros assumed for unannounced moves, would have been enough to make the tax a net loss. The outcome depended less on the tax rate than on the decisions of a few dozen families whose residence is a choice.
The real fragility: the top 1%, not the top 200
The debate focused on billionaires, but they are not where California’s fiscal risk is concentrated. According to the Saez and Zucman group, billionaires pay about 2.4% of the state’s personal income tax. The Hoover Institution estimates that the top 1% of earners, about 170,000 taxpayers, pay 40% to 50% of it, and the top half of 1% about 40% (Figure 3). Personal income tax has grown from 44.6% of state tax revenue in fiscal 2003 to almost 60% in fiscal 2021.
This concentration makes revenue extremely volatile, because top incomes depend on capital gains and stock options. Personal income tax revenue rose 55% in 2021 and fell nearly 35% in 2023; over the past thirty-five years, the standard deviation of its annual change is about 17%. A wealth tax on 200 people would not change that structure. What changes it is the mobility of the much larger group of high earners who are not billionaires: entrepreneurs, senior executives and professionals who can relocate to Nevada, Texas or Florida. The ballot campaign may have mattered most through the signal it sent to that group.
Table 2. California’s revenue concentration in numbers
| Indicator | Value | Source |
|---|---|---|
| Share of PIT paid by billionaires | about 2.4% | Boll, Saez and Zucman |
| Share of PIT paid by top 0.5% | about 40% | Hoover Institution |
| Share of PIT paid by top 1% | 40% to 50% | Hoover Institution |
| PIT as share of state tax revenue, FY2021 | 59.7% | Hoover Institution |
| Standard deviation of annual PIT growth, 35 years | about 17% | Hoover Institution |
| Annual yield of the high-earner tax (Prop 3) | up to $15 billion | GV Wire, July 2026 |
Lessons for the national debate
Governor Newsom argued that a wealth tax should be national rather than state-level, precisely because of mobility. The California numbers support part of that argument: a subnational wealth tax faces a much more elastic base than a national one, because moving across a state line is far easier than renouncing citizenship. But they also show that the elasticity is not infinite. Even after a highly publicised exodus, the tax would have raised a positive amount under most of our assumptions. The broader lesson is that the political economy of taxing wealth is dominated by expectations: the mere prospect of the tax moved the base before a single dollar was assessed.
For California, the more urgent issue is the structure of its revenue. A state that relies on a few hundred thousand taxpayers for half of its main tax, and whose revenue can swing by a third in a year, needs larger reserves and a broader base, whatever its views on wealth taxation. The permanence of the high-earner surcharge, approved on the same day, increases that dependence.
The arguments on both sides
A fair reading of the episode requires setting out the strongest arguments made by each side. Supporters argued that billionaire wealth in California has grown about thirty-fold over four decades while household wealth has only doubled, that billionaires pay a very small share of their wealth in state income tax each year, about 0.2% according to the Saez and Zucman group, and that a one-time levy was a way to fund health care in the face of federal cuts expected to remove about two million Californians from insurance. They also argued that the estimates of departures were exaggerated, since moving one’s legal residence requires real changes in life and business.
Opponents argued that a tax on unrealised wealth requires valuing private companies and illiquid assets, which invites litigation and avoidance; that the measure would discourage entrepreneurs from starting or keeping companies in California; that a one-time tax rarely stays one-time; and that the departures already observed proved the base was mobile. They pointed out that most countries that tried broad annual wealth taxes between the 1960s and the 2010s later repealed them. Opponents and their allies spent about $317 million against the measure, against about $33 million in support.
Our model does not settle the normative question of whether wealth should be taxed. It shows that both sides were partly right on the numbers: the tax would probably have raised a positive amount at the departure rates observed, but much less than promised, and the margin before it became a net loss was thin.
Sensitivity: what else could have changed the result
Three parameters drive our results. The collection rate matters because a tax on wealth depends on valuations that can be contested: lowering it from 85% to 70% reduces the net value at a 30% departure rate by about $9 billion and lowers the break-even departure share by several points. The discount rate matters because the loss of income tax is permanent: a lower rate makes future losses weigh more. And the income tax paid by billionaires matters most: estimates range from $3.3 billion to $5.8 billion a year, a gap almost as large as the difference between a positive and a negative outcome.
Table 3. Net present value of the tax at a 30% departure rate ($ billion)
| Annual billionaire income tax | Collection 85%, r = 4% | Collection 70%, r = 4% |
|---|---|---|
| $3.3 billion | +28 | +19 |
| $4.5 billion | +19 | +10 |
| $5.8 billion | +10 | +0 |
The table shows that under pessimistic but plausible assumptions about valuation, litigation and the income tax at stake, the tax could have been roughly neutral even without further departures, and negative with only a few more. This is the strongest quantitative argument against a state-level wealth tax: not that it necessarily loses money, but that its expected yield is small relative to the uncertainty around it.
A comparative perspective
Wealth taxes have a long and mixed history. Most of the countries that tried broad annual wealth taxes between the 1960s and the 2010s later repealed them; by the late 2010s only a handful of OECD countries still levied one, notably Norway, Spain and Switzerland, while France replaced its general wealth tax in 2018 with a tax limited to real estate. Two lessons from that experience are relevant to California. First, the yield of wealth taxes has generally been modest, typically well below 1% of total tax revenue, with Switzerland as the main exception. Second, their main difficulties have been valuation, liquidity and mobility, the same issues raised in the Proposition 40 campaign.
Figure 4 summarises our break-even analysis under six combinations of assumptions. In every case, the break-even share is between 28% and 54% of billionaire wealth, against the 30% that had already left. A state-level one-time tax is therefore close to the point where mobility cancels its yield, which is precisely the zone where the political debate becomes a debate about behaviour rather than principle. A national tax, by contrast, would face departures only through renunciation of citizenship, which is far rarer and itself subject to an exit tax.
Switzerland offers a different model: an annual wealth tax at low rates, levied by cantons with competitive rates and long-standing valuation practices, which coexists with a large population of wealthy residents. Its acceptance rests on low rates and predictability rather than on large one-off levies. Whatever one thinks of the merits, the California episode suggests that the design of a wealth tax, its rate, its base and its stability, matters as much for its revenue as the principle of taxing wealth itself.
The Proposition 3 paradox
On the same ballot, voters appear to have approved Proposition 3, which makes permanent the income tax surcharge on very high earners that was due to expire. That measure yields up to $15 billion a year for schools and community colleges in good years. The contrast with Proposition 40 is instructive: Californians rejected a one-time tax on the wealth of about 200 people but kept a recurring tax on the income of a much larger group of top earners.
From a fiscal point of view, the choice is coherent. A recurring surcharge of up to $15 billion a year is worth far more over time than a one-time levy of about $30 billion, and it is administered through an existing tax with established rules. But it deepens the dependence identified earlier in this article: the surcharge is paid by the same top 1% of earners who already supply 40% to 50% of personal income tax, and its yield swings with the stock market. The state has chosen to keep its revenue anchored in the most mobile and most volatile part of its tax base.
Table 4. Two ways of taxing the top: Proposition 40 versus Proposition 3
| Feature | Proposition 40 (rejected) | Proposition 3 (leading) |
|---|---|---|
| Base | Net worth above $1 billion | Income of very high earners |
| Taxpayers | About 200 to 260 | Top income earners |
| Revenue | About $30 bn once (GSF/Hoover range) to $100 bn (supporters) | Up to $15 bn a year |
| Main risk | Departures and valuation disputes | Revenue volatility and gradual migration |
| Administration | New valuation system | Existing income tax |
For the rest of the country, the lesson is that the politics of taxing the rich are less about whether to do it than about which instrument voters trust. In California, the familiar instrument won.
What to watch
- The certified results of Propositions 40, 41 and 42, and any litigation over the countermeasures.
- California’s personal income tax receipts in the 2026 to 2027 fiscal year, particularly withholding and estimated payments from top earners.
- IRS migration data for 2025 and 2026, which will show whether high-income departures accelerated.
- Similar proposals in other states, and the national debate on a minimum tax on very large fortunes.
Conclusion
Proposition 40 was a real-world test of the mobility of extreme wealth. The test produced a clear answer on behaviour, with about 30% of the base leaving before the residency date, and a less clear answer on revenue: the tax would probably still have raised money, but far less than promised and with a thin margin of safety. The episode should shift the focus of the debate from the 200 richest residents to the 170,000 high earners whose taxes fund half of the state’s main revenue source, and to the volatility that this concentration creates.
Robustness and limits
The model treats the departure of wealth and the loss of income tax as proportional, which is a simplification: the billionaires who left may have paid more or less income tax than the average. It assumes that departures are permanent and that the departing taxpayers would otherwise have stayed indefinitely; in reality some would have left anyway and some may return. It ignores the effect on other taxes, such as the corporate tax of companies that move headquarters, and on the state’s economy through investment and philanthropy. Each of these factors could move the results in either direction.
The base estimate itself is uncertain. Dividing $536 billion by 30% gives about $1.8 trillion, but estimates of billionaire wealth vary with stock prices; a 10% market decline would reduce both the potential revenue and the stakes of departure. Finally, the one-time nature of the tax matters: a recurring tax would face a much larger behavioural response, which is one reason why most analyses of state-level annual wealth taxes are more negative than those of a one-off levy.
Table A1. Data appendix: net present value of the tax by departure share ($ billion)
| Share of billionaire wealth that leaves | I = $3.3 bn | I = $4.5 bn | I = $5.8 bn |
|---|---|---|---|
| 0% | +75.9 | +75.9 | +75.9 |
| 10% | +60.1 | +57.1 | +53.8 |
| 20% | +44.2 | +38.2 | +31.7 |
| 30% | +28.4 | +19.4 | +9.7 |
| 40% | +12.6 | +0.6 | -12.4 |
| 50% | -3.3 | -18.3 | -34.5 |
| 60% | -19.1 | -37.1 | -56.6 |
Methodological note
The model uses a wealth base of $536 billion divided by 0.30, an 85% collection rate reflecting valuation disputes and litigation, discount rates of 3% to 5%, and a permanent loss of the income tax paid by departing billionaires proportional to the share of wealth that leaves. It ignores second-round effects on other taxes, the five-year payment schedule and the possibility of return migration. The vote shares are those available on 4 November 2026 and may differ from the certified result.
GO DEEPER
The 2026 US Economy Trilogy (3 books, PDF)
Growth from the AI investment boom, the Federal Reserve and the credit economy, and what inflation leaves in the household budget: the forces behind this article, analysed in three research books by Dr. Driss Effina. About 900 pages in English PDF.
$59 instead of $90
Sources
- KQED election results, Proposition 40, 4 November 2026; EdSource and CalMatters, November 2026; Rauh and Jaros, The 2026 California Billionaire Tax Act, Hoover Institution and NBER working paper; Boll, Saez and Zucman as reported by WebProNews and the Los Angeles Times, 2026.
- Hoover Institution, How Much Longer Will the Top 1 Percent Save California’s Budget and California State Budget and Revenue Volatility; Heritage Foundation commentary on Proposition 40; Pacific Research Institute; Fortune, 9 October 2026.
- Driss EFFINA, PhD | Independent Researcher, Global Strategy Files | globalstrategyfiles.com
Driss EFFINA, PhD
The opening pages of our four country reports: United States, United Kingdom, Japan and China. A free PDF, sent to your inbox.
You will also receive occasional analysis from Global Strategy Files. Unsubscribe in one click, at any time.