
The Rhine and the Climate Vulnerability of German Industrial Supply Chains: Lessons from the Record Low Water of 2026

The Rhine and the Climate Vulnerability of German Industrial Supply Chains: Lessons from the Record Low Water of 2026
Driss EFFINA, PhD Independent Researcher, Global Strategy Files Reading time: about 27 minutes
Key takeaways
- The Kaub gauge on the Rhine broke its 2018 record low of 25 centimetres in August 2026 and fell to 5 centimetres on 17 August.
- In August 2026 ships could carry only 20 to 30 percent of their usual cargo on the Middle Rhine.
- Freight rates from Rotterdam to Karlsruhe reportedly rose from about 45 euros per tonne to 150 to 160 euros in mid-August.
- The 2026 low water episode cost an estimated 2.3 to 3 percent of one month's German industrial output.
Abstract
In its Monthly Report of September 2026, the Deutsche Bundesbank listed low water on the Rhine among the factors slowing the German economy in the third quarter: low water began in July, lasted throughout August, disrupted transport on important waterways, raised freight costs sharply and contributed to a marked fall in industrial production in July, concentrated in refining, chemicals and metal production. The episode turned out to be historic. At the Kaub gauge, the bottleneck of the Middle Rhine, the previous record low of 25 centimetres, set in October 2018, was broken in early August 2026; the gauge fell to 5 centimetres on 17 August, recovered briefly, then fell again to 2 centimetres in late September and briefly below zero at the end of the month. This article examines how such low water levels disrupt transport, supplies and production costs, and what they reveal about the climate vulnerability of German industrial supply chains. It combines Destatis data on inland waterway freight, Destatis production data, the Bundesbank’s assessment, gauge readings and market reports from the press, and the estimate of Ademmer, Jannsen and Meuchelböck (2023), who found that a month with 30 days of low water at Kaub reduces German industrial production by about 1 percent. The author builds four tools: a stylised model of barge capacity and cost per tonne as a function of the water level, a duration-based estimate of lost output, an assessment of the 2026 episode, and three climate scenarios for the expected annual cost. The results show that inland waterway freight fell from 222.7 million tonnes in 2017 to 171.6 million tonnes in 2025, the lowest level since reunification. At the critical level of about 78 centimetres, a barge can carry less than half its normal load; in August 2026, ships could carry only 20 to 30 percent of their usual cargo, and freight rates between Rotterdam and Karlsruhe were reported to have risen from about 45 euros per tonne at the end of June to 150 to 160 euros in mid-August. On the author’s estimate, the 2026 episode, with at least 70 and probably around 90 days below the critical level, cost about 2.3 to 3 percent of one month’s industrial output, and probably more, since the record levels lie outside the range on which the benchmark elasticity was estimated. In aggregate, the expected annual cost of low water remains small, between about 0.02 and 0.13 percent of industrial output depending on the scenario, but it is concentrated on a few strategic branches and regions, and it compounds other shocks. The article concludes that Rhine low water has become a recurrent climate risk for German industry, and that adaptation should be treated as an investment priority.
Keywords: Germany, Rhine, low water, climate risk, inland waterway transport, supply chains, industrial production, chemicals, adaptation
JEL codes: Q54, R41, L60, E23, Q56, H54
1. Introduction
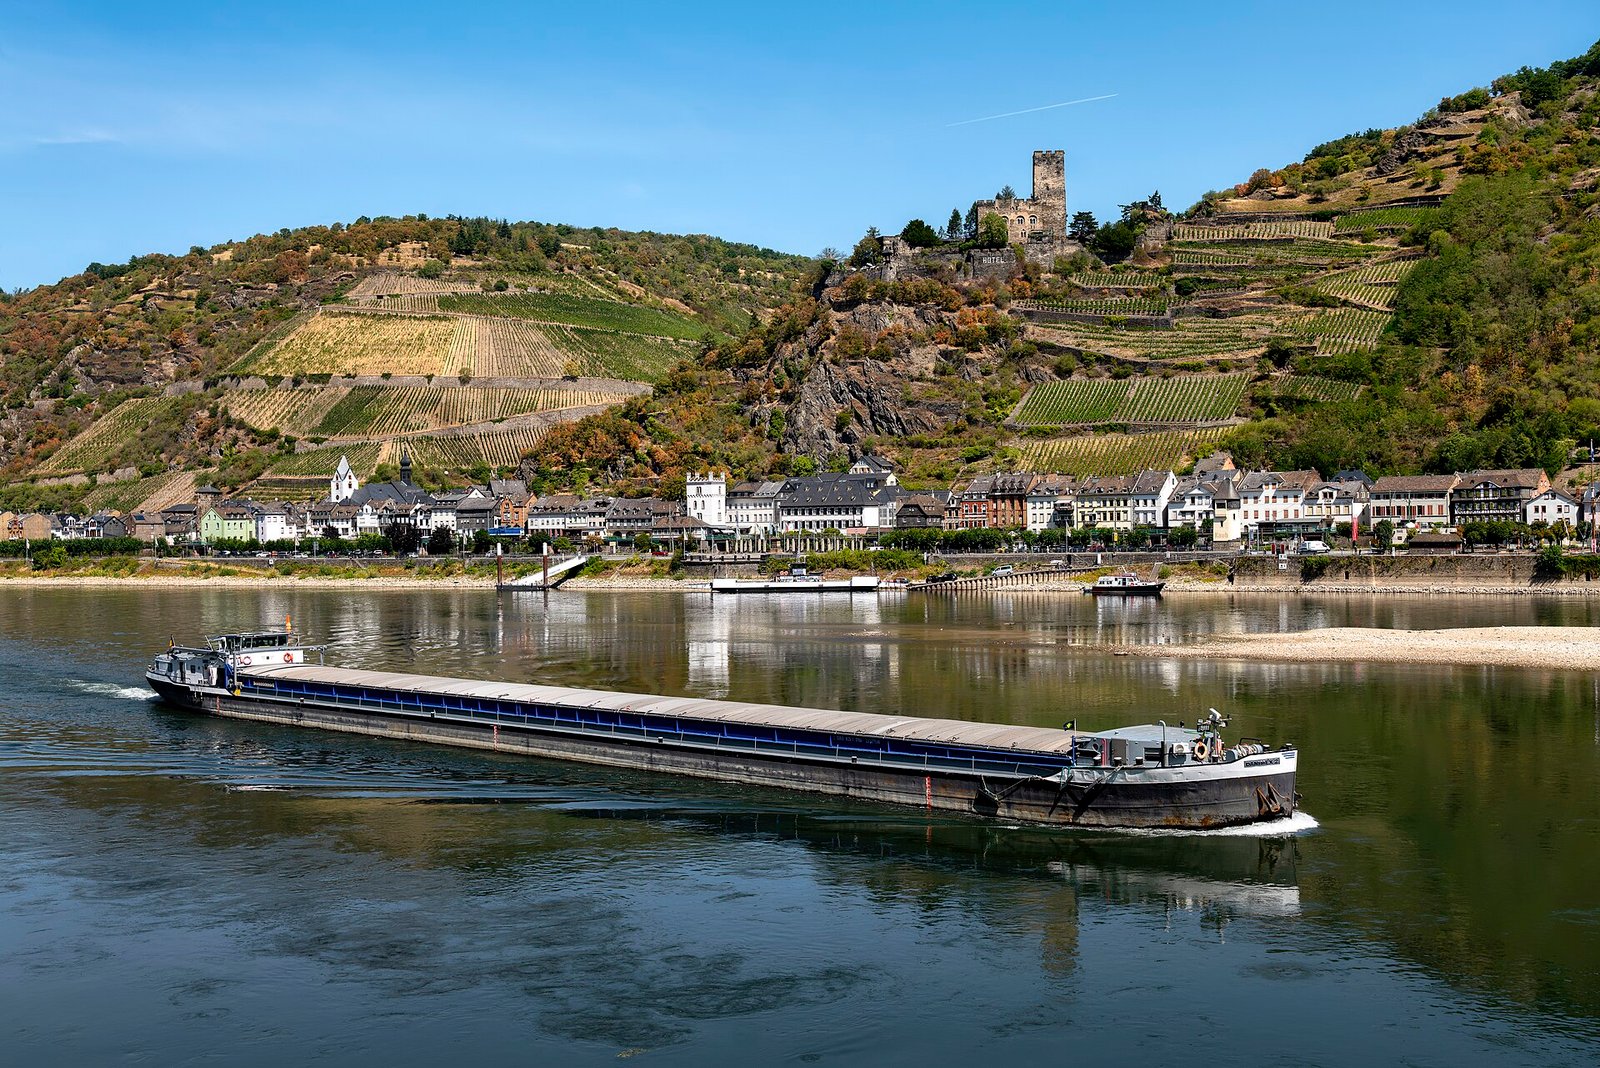
The Rhine is the most important inland waterway in Europe. It connects the North Sea ports of Rotterdam and Antwerp with the industrial heartland of western Germany, the chemical sites of the Rhine valley, the steelworks of Duisburg and the Ruhr, and the economies of Switzerland and eastern France. It carries coal and iron ore for steelworks, crude oil products for refineries and petrol stations, chemicals for the industrial sites of Ludwigshafen, Leverkusen and the Lower Rhine, building materials, agricultural goods and containers.
For most of the year, the Rhine is a reliable and cheap means of transport. A single large barge can carry the equivalent of dozens of trucks. But the river depends on rainfall and on melting snow and ice in the Alps. In dry summers and autumns, its level can fall so low that barges must reduce their load, transport costs rise steeply, and some goods cannot be delivered at all. This happened in 2003, in 2015, very severely in 2018, again in 2022, briefly in the spring of 2025 and, on an unprecedented scale, in 2026.
The Bundesbank’s September 2026 Monthly Report noted that low water on important rivers impaired transport from July and that transport costs rose sharply. Industrial production fell markedly in July, with the largest declines in the branches most exposed to supply bottlenecks: coke and refined petroleum, chemicals and metal production. The Bundesbank expected low water to weigh further on production and foreign trade for the rest of the third quarter, and noted that the outlook for the fourth quarter depended partly on how quickly water levels returned to normal. In fact, levels fell again in September, to new records.
This article asks how low water levels disrupt transport, supplies and production costs, and what this reveals about the climate vulnerability of German industrial supply chains. It proceeds in four steps: it documents the role of inland waterway transport and its recent decline; it models the mechanism through which falling water levels raise transport costs and compares the model with what was observed in 2026; it estimates the output effects of low water episodes, including the 2026 episode; and it builds scenarios for the expected cost of low water under different climate assumptions.
Section 2 presents the context. Section 3 reviews the literature. Section 4 describes the data and methodology. Section 5 presents the results. Section 6 discusses them. Section 7 presents scenarios. Section 8 concludes.
2. Context
2.1 The Rhine as an industrial artery
Inland waterways carry a relatively small share of total German freight, far less than road transport, but they are crucial for specific goods and regions. Bulk goods that are heavy, low in value per tonne and needed in large quantities are particularly suited to transport by barge. According to Destatis, dry bulk goods such as stones and earths, ores and coal make up more than half of the volume, and liquid goods such as mineral oil products and chemicals most of the rest. In 2023, for example, barges carried 27.9 million tonnes of liquid mineral oil products, 21.6 million tonnes of stones and earths, 20.4 million tonnes of iron ore and 18.5 million tonnes of coal. These are precisely the inputs of the energy-intensive industries concentrated along the Rhine.
Large industrial sites have been built on the river because of this access. The BASF site at Ludwigshafen, one of the largest integrated chemical complexes in the world, receives about half of its raw materials by barge, according to reports in September 2026. The Thyssenkrupp steelworks in Duisburg receive 50,000 to 60,000 tonnes of raw materials every day, normally mostly by water. Refineries and tank storage facilities along the Rhine supply fuel to southern Germany and Switzerland.
2.2 The Kaub bottleneck
The critical point for navigation on the Rhine is the gauge at Kaub, in the Middle Rhine gorge between Bingen and Koblenz. Here the river is narrow and rocky, and the navigable channel is shallowest. The water level measured at Kaub is a reference value, not the depth of the channel, which is considerably deeper: at a reading of 8 centimetres in August 2026, the fairway was still just over 1.20 metres deep. Shippers use the Kaub reading to determine how much cargo a barge can carry through the gorge. A level of about 78 centimetres, the so-called equivalent water level (some recent reports use 77 centimetres), is the key reference point: it corresponds to a fairway depth of about 1.90 metres, and below it navigation becomes increasingly restricted. For comparison, the mean water level at Kaub over 2010 to 2020 was about 208 centimetres.
2.3 Past episodes
The most severe episode before 2026 occurred in 2018. After an exceptionally dry summer, the level at Kaub fell to a record low of 25 centimetres on 22 October 2018. Barges could carry only a fraction of their usual cargo, transport costs rose several times over, and some petrol stations in southern Germany ran short of fuel. According to Destatis, freight carried on German inland waterways fell by 11.1 percent in 2018, from 222.7 million tonnes to about 198 million, with the second half of the year and especially November, down almost 34 percent, most affected.
In August 2022, the level at Kaub fell to about 32 centimetres, at the same time as the gas crisis. Freight carried on inland waterways fell by 6.4 percent in 2022, to 182 million tonnes, the lowest level since reunification at that time. In April 2025, an unusually dry spring briefly pushed the level below the critical mark again.
2.4 The 2026 episode
The 2026 episode broke all records. After a long drought, the Kaub gauge stood at 29 centimetres on 29 July, and the 2018 record of 25 centimetres was broken in the first days of August. On 14 August, the gauge read 8 centimetres; on 17 August, it reached 5 centimetres. A brief recovery followed, with a daily mean of 73 centimetres on 24 August, still below the critical level. In September, levels fell again: daily means at Kaub were below 25 centimetres from 10 September, apart from four days in mid-month, the gauge read 12 centimetres on 23 September and 2 centimetres around 25 September, and at the end of the month it slipped slightly below zero for the first time. New record lows were also recorded downstream, including at Cologne. Official forecasts at the end of September gave a near certainty that the level would stay below the critical mark at least until early October.
The consequences for shipping were severe. In August, ships passing Kaub could carry only 20 to 30 percent of their normal load, according to the inland shipping cooperative DTG. At the end of September, only a few cargo ships were still sailing on the Middle Rhine between St. Goar and Mainz, and the German Economic Institute described the Rhine as effectively divided in two, with the ports of Duisburg and Rotterdam largely cut off from the Middle and Upper Rhine. The ferry at Kaub stopped operating. Several Länder suspended the Sunday driving ban for trucks, and the rail freight operator DB Cargo made 400 additional wagons available, with up to 500 more on standby.
The episode coincided with the energy price shock caused by the renewed conflict in the Middle East, which raised gas prices and restricted deliveries of petroleum products. According to the German Weather Service, the summer of 2026 was the second warmest since records began. Industrial production fell by 1.2 percent in July compared with June. In August, total production rose by 2.0 percent, driven by construction and machinery, but production in the energy-intensive branches continued to fall.
2.5 Earlier policy responses
After the 2018 episode, the federal government, the Länder and industry adopted an action plan on low water on the Rhine in 2019, covering better water level forecasts, vessels better suited to low water, more storage capacity at industrial sites and faster infrastructure projects. The most important of these projects is the optimisation of the navigation channel in the Middle Rhine, included in the federal waterway expansion law of 2016, which would increase the depth available at low water by about 20 centimetres in the critical section. Press reports in August 2026 noted that its realisation would take more than twenty years from its inclusion in the law.
2.6 Why waterways matter more than their share suggests
Measured by tonnes, inland waterways carry a much smaller share of German freight than road or rail. This share understates their importance for industry. For a large chemical or steel site, the river is often the only practical way to receive the volumes of raw materials it needs. A single large Rhine barge can carry as much as dozens of heavy trucks; DB Cargo estimated in August 2026 that one freight train can replace up to ten barges. Replacing the river would require thousands of additional truck journeys or hundreds of extra trains per day, which neither the road network nor the rail network could absorb at short notice. Some hazardous goods cannot easily be moved to road transport at all.
The waterway also has advantages in cost and emissions. Per tonne kilometre, transport by barge is generally cheaper than by truck and emits less carbon dioxide. This is why policymakers have long sought to shift more freight to waterways. Recurrent low water episodes undermine this objective, because shippers who cannot rely on the river in late summer may decide to use other modes throughout the year.
3. Literature review
Four strands of literature are relevant.
The first estimates the macroeconomic effects of low water on the Rhine. Ademmer, Jannsen and Meuchelböck (2023), in an article published in the German Economic Review and first circulated as a Kiel Working Paper in 2020, used daily water levels at Kaub and monthly industrial production data. They found that in a month with 30 days of water below the critical threshold of 78 centimetres, German industrial production falls by about 1 percent, with larger effects in the industries most dependent on inland shipping, notably chemicals. The Bundesbank cites this study in its September 2026 report. It is the main empirical benchmark for the present article.
The second strand concerns the transport economics of low water. Jonkeren, Rietveld and van Ommeren (2007) estimated the welfare effects of low water levels on the Rhine on the inland shipping market. They showed that low water reduces the load factor of vessels, raises freight prices and transfers income from shippers to carriers, and that these effects could increase with climate change.
The third strand concerns the propagation of local supply disruptions through production networks. Barrot and Sauvagnat (2016) showed that natural disasters affecting suppliers propagate to their customers, especially when inputs are specific and difficult to replace. Carvalho, Nirei, Saito and Tahbaz-Salehi (2021) documented how the 2011 earthquake in Japan propagated through supply chains, reducing output far from the affected area. These studies suggest that a disruption on the Rhine can affect firms that do not use the river directly but depend on suppliers who do.
The fourth strand concerns climate and economic activity. Dell, Jones and Olken (2012) showed that temperature shocks affect economic growth, particularly in poorer countries. Hsiang (2016) reviewed the econometric literature on climate impacts, emphasising that the costs of climate change often come through specific channels and extreme events rather than gradual average changes. Low water on the Rhine is a clear example of such a channel in an advanced economy.
4. Data and methodology
4.1 Data
The analysis uses:
- Destatis annual results on freight carried on German inland waterways, 2017 to 2025, as published or reported in the press (the 2020 value is not used);
- Destatis monthly data on industrial production, July and August 2026;
- the Bundesbank Monthly Report of September 2026;
- Kaub gauge readings and shipping conditions reported in the press between July and September 2026, citing the Federal Waterways and Shipping Administration (WSV) and the Federal Institute of Hydrology (BfG);
- freight rates reported by market sources in August 2026;
- the elasticity estimated by Ademmer, Jannsen and Meuchelböck (2023).
4.2 A stylised model of barge capacity and cost
To illustrate the mechanism, the author uses a simple model. The usable load capacity of a barge is assumed to be 100 percent when the Kaub gauge is at or above 200 centimetres, and to decline linearly to 30 percent at 50 centimetres. This is a stylised approximation of shipping practice, not an engineering formula; actual capacity depends on vessel type and route. The cost of a voyage is assumed to be fixed, so that the cost per tonne carried is inversely proportional to the load factor. The model is compared with the load factors and freight rates observed in 2026.
4.3 Output effects
Following Ademmer, Jannsen and Meuchelböck, the author assumes that each period of 30 days with water below the critical level reduces industrial production by about 1 percent of monthly output. For an episode of a given duration, the lost output is expressed as a percentage of one month’s industrial production.
4.4 Climate scenarios
The expected annual cost is computed as the probability of an episode in a given year, times its duration, times the elasticity, divided by twelve to express it as a share of annual industrial output.
4.5 Limitations
The capacity model is stylised. The elasticity was estimated on past episodes that were less extreme than 2026, and the relationship may be non-linear at record low levels. The output effects concern industrial production only. The duration of the 2026 episode below the critical level is estimated by the author from press reports, since a complete daily series was not available for this article. The gauge readings shown in Figure 5 mix spot readings and daily values and are unevenly spaced in time.
5. Results
5.1 The long decline of inland waterway freight
Figure 1 shows freight carried on German inland waterways from 2017 to 2025.
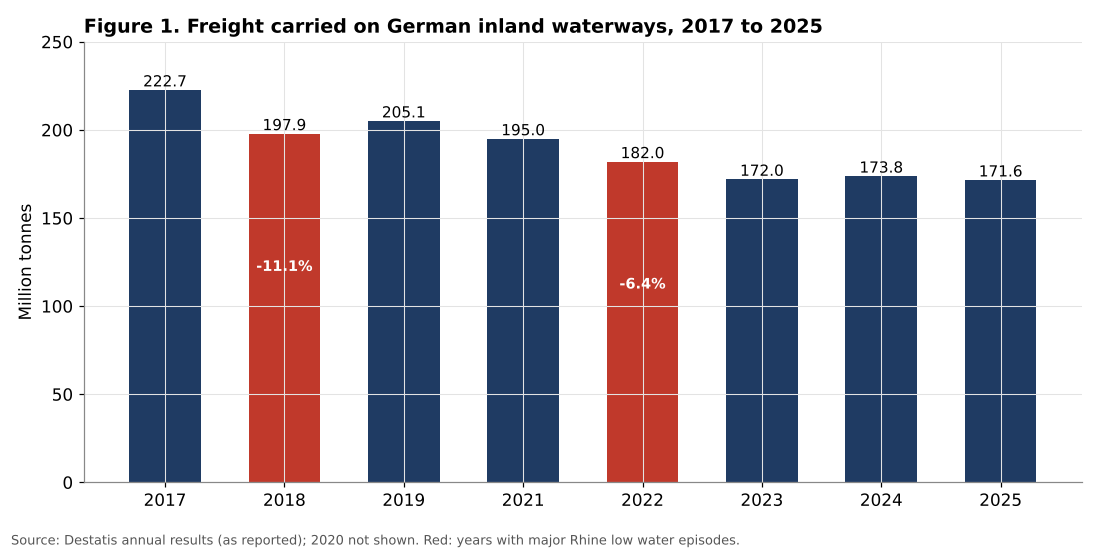
Freight carried on German inland waterways fell from 222.7 million tonnes in 2017 to 171.6 million tonnes in 2025, a decline of about 23 percent. In 2000, it had been 242.2 million tonnes. The 2025 figure, 1.3 percent below 2024, is the lowest since German reunification. The two years of major Rhine low water before 2026 stand out: in 2018, volumes fell by 11.1 percent; in 2022, by 6.4 percent.
| Year | Freight (million tonnes) | Note |
|---|---|---|
| 2017 | 222.7 | normal year |
| 2018 | 197.9 | record low water in autumn |
| 2019 | 205.1 | partial recovery |
| 2021 | 195.0 | after the pandemic |
| 2022 | 182.0 | low water in summer, energy crisis |
| 2023 | 172.0 | weak industry |
| 2024 | 173.8 | slight recovery |
| 2025 | 171.6 | lowest since reunification |
Table 1. Freight carried on German inland waterways. Source: Destatis results as published or reported; 2023 rounded.
Low water is not the only explanation for this decline. The phase-out of coal-fired power generation reduces coal transport (coal fell by 27.9 percent in 2023), the decline of energy-intensive production since 2022 reduces demand for raw materials, and the weakness of construction reduces transport of building materials. Destatis also cites fluctuating water levels and competition from road and rail. Low water episodes have lasting effects: after 2018 and 2022, some shippers shifted part of their transport to rail and road, or increased storage, to reduce their dependence on the river. The decline of volumes is partly a symptom of the river’s reduced reliability. Given the severity of the 2026 episode, a further sharp fall in 2026 volumes is likely.
5.2 The mechanism: capacity and cost
Figure 2 illustrates how falling water levels affect transport capacity and cost.
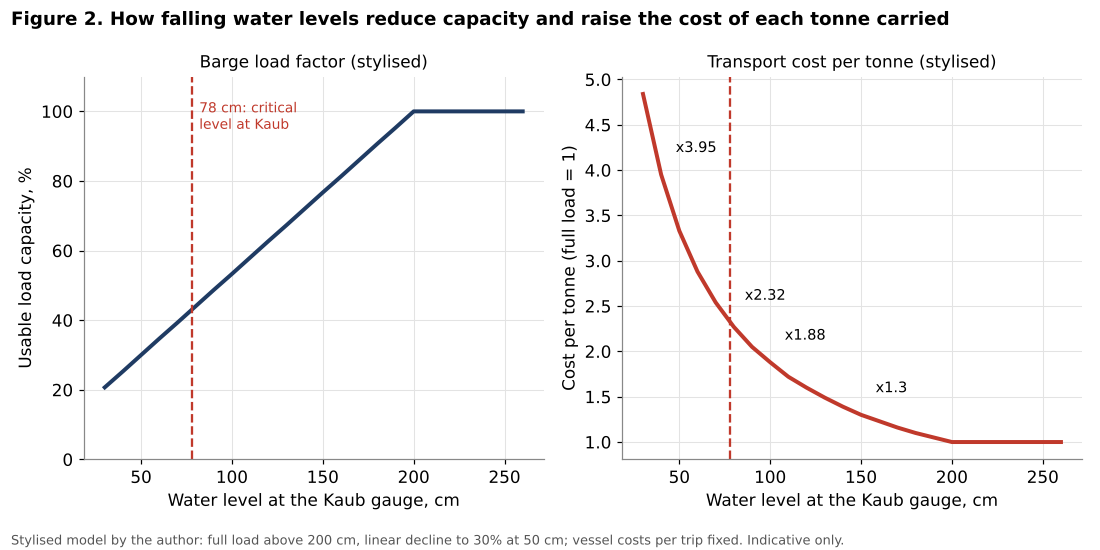
In the stylised model, a barge can use its full capacity when the Kaub gauge is at 200 centimetres or more. At 150 centimetres, its usable capacity falls to about 77 percent and the cost per tonne rises by about 30 percent. At 100 centimetres, capacity falls to about 53 percent and the cost per tonne almost doubles. At the critical level of 78 centimetres, capacity is about 43 percent and the cost per tonne about 2.3 times the normal level. At 40 centimetres, the cost per tonne is about four times the normal level.
| Kaub level (cm) | Usable capacity (%) | Cost per tonne (full load = 1) |
|---|---|---|
| 200 | 100 | 1.00 |
| 150 | 77 | 1.30 |
| 100 | 53 | 1.88 |
| 78 | 43 | 2.32 |
| 60 | 35 | 2.88 |
| 40 | 25 | 3.95 |
Table 2. Stylised barge capacity and cost per tonne. Source: model by the author (Section 4.2).
The observations of 2026 are broadly consistent with the model. With the Kaub gauge between about 5 and 30 centimetres in August, the model implies a usable capacity of about 20 percent; ship operators reported that vessels could carry 20 to 30 percent of their normal load. Market reports cited in the press put the freight rate between Rotterdam and Karlsruhe at about 45 euros per tonne at the end of June and 150 to 160 euros per tonne in mid-August, an increase by a factor of about 3.4. This is somewhat below the cost multiple implied by the model at the lowest levels, which is plausible, since part of the cargo was diverted to other modes and some vessels designed for shallow water kept operating.
The model also illustrates a non-linearity. As long as the water level stays above about 150 centimetres, the effect on costs is modest. Below 100 centimetres, it accelerates rapidly. This means that the economic damage of low water is concentrated in the most extreme episodes, which are precisely those that climate change is expected to make more frequent.
5.3 How much output is lost?
Figure 3 shows the estimated output loss as a function of the duration of the low water episode.
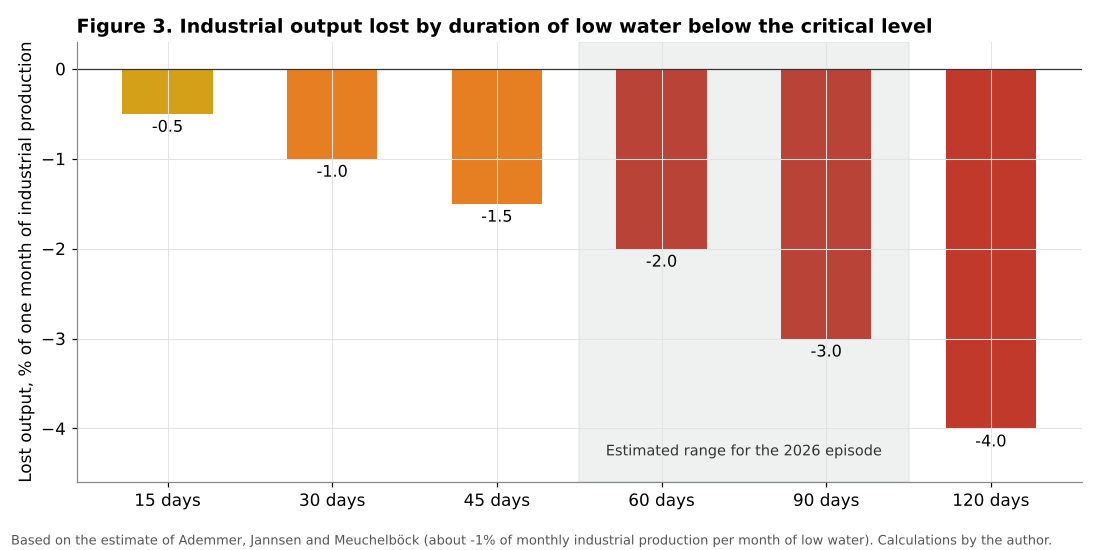
On the basis of the estimate of Ademmer, Jannsen and Meuchelböck, an episode of 15 days below the critical level costs about 0.5 percent of one month’s industrial production; 30 days, about 1 percent; 60 days, about 2 percent; 90 days, about 3 percent; 120 days, about 4 percent.
For 2026, the gauge was already far below the critical level at the end of July and remained below it, with a brief partial recovery in late August, through the end of September, with forecasts of further low levels into October. The author therefore estimates that the level was below the critical threshold for at least 70 days and probably around 90 days. This implies a loss of about 2.3 to 3 percent of one month’s industrial production. Because the levels reached in 2026 were far below anything in the sample on which the elasticity was estimated, the true effect may be larger: at levels close to zero, parts of the Middle Rhine were effectively closed to commercial shipping.
Part of the lost production is recovered later, as firms catch up on delayed deliveries when water levels return to normal. The Bundesbank expects such catch-up effects. The permanent loss is therefore smaller than the immediate loss, but the costs of disruption, such as higher transport costs, emergency logistics and lost orders, are not recovered.
5.4 A sector-specific shock
Figure 4 shows industrial production by branch in August 2026.
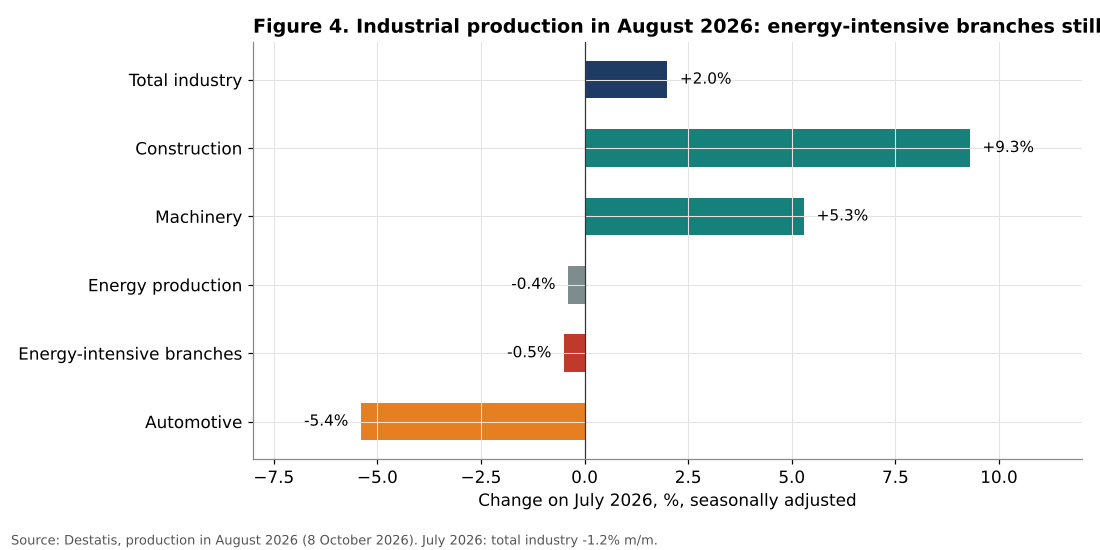
The aggregate figures hide large sectoral differences. In August 2026, total industrial production rose by 2.0 percent compared with July, driven by construction (+9.3 percent) and machinery (+5.3 percent). Car production fell by 5.4 percent, mainly because of factory holidays. Energy production fell by 0.4 percent. The energy-intensive branches fell by 0.5 percent, after a decline in July, and their output in June to August was 2.9 percent lower than in the previous three months.
The Bundesbank attributes the July fall in the energy-intensive branches to both low water and high energy prices. It is not possible, with the available data, to separate the two effects precisely. But the sectoral pattern is consistent with the literature: the branches that depend most on bulk transport by water, refining, chemicals and metals, are also the ones that suffered most.
This sectoral concentration matters because these branches are at the beginning of supply chains. If a chemical plant reduces output because it cannot receive raw materials, its customers in plastics, pharmaceuticals, paints or agriculture may face shortages in turn.
5.5 The 2026 episode in context
Figure 5 shows the Kaub readings reported during the 2026 episode.
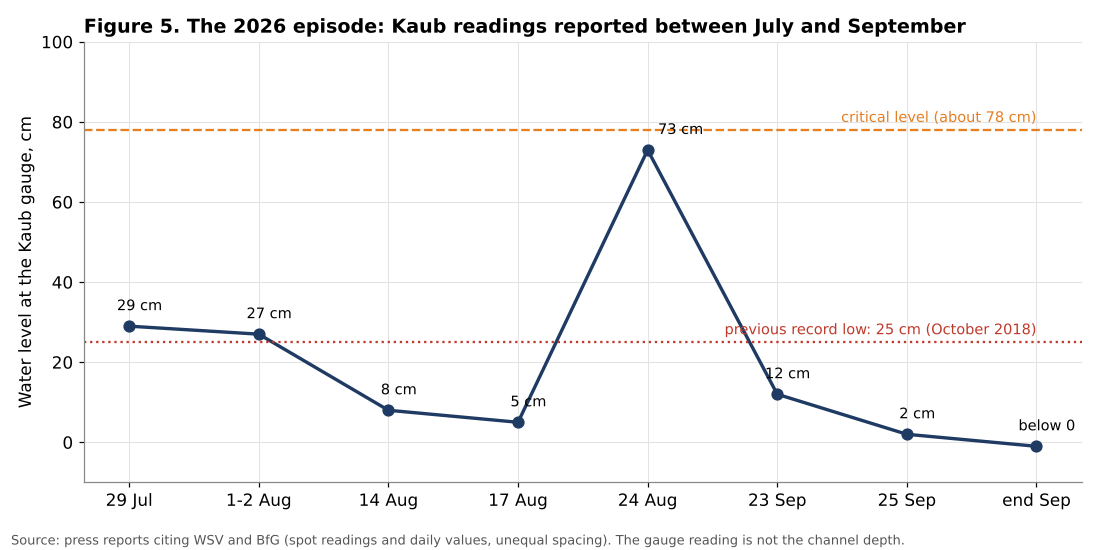
The 2026 episode differs from earlier ones in three respects. First, its depth: the 2018 record of 25 centimetres was broken in early August, and the gauge fell into single digits twice, in mid-August and in late September, before slipping slightly below zero. Second, its duration: from late July to at least the end of September, with only a brief and partial recovery in late August. Third, its coincidence with another shock: in July and August, the energy-intensive branches faced at the same time higher gas and oil prices, restricted supplies of petroleum products from the Gulf, and transport disruptions on the Rhine.
The two shocks reinforce each other. When supplies of oil products from abroad are restricted, the ability to move them inland by barge becomes even more critical, and when river transport is restricted, the alternative routes, rail and road, are more expensive and also strained. The coincidence is not entirely accidental. Hot, dry summers raise electricity demand for cooling, reduce the output of hydroelectric and some thermal power plants that need river water for cooling, and lower river levels at the same time. Climate risks tend to cluster.
5.6 How firms coped
The 2026 episode also showed how much firms have adapted since 2018. Press reports in August described a range of responses. Thyssenkrupp doubled the share of raw materials delivered by rail to its Duisburg steelworks, from about 5 percent, and kept all blast furnaces running, stating that customer supply was not at risk. BASF largely maintained barge transport by using vessels with a shallower draft, with bottlenecks only in isolated cases. Lanxess reported additional costs in the single-digit millions of euros. By mid-August, no company that had commented publicly reported an actual production cut.
These responses show that adaptation works, up to a point. Shallow-draft vessels, rail diversion and larger stocks reduce the impact of an episode of a few weeks. But they have limits. Rail capacity is limited and is itself under pressure from infrastructure renovation. Storage is expensive. And when the river falls to the levels of late September 2026, when only a few ships were still sailing on the Middle Rhine, even specialised vessels struggle. The decline of production in the energy-intensive branches over the summer shows that adaptation did not prevent losses.
5.7 Prices: the hidden cost
The output losses capture only part of the economic cost. Another part shows up in prices. When freight rates more than triple, firms that continue to produce pay more for their inputs, and part of this cost is passed on. Regional differences in fuel prices appeared in 2026: diesel prices in the west of Germany and the Cologne area were reported to be up to 10 cents per litre higher than elsewhere in July. However, the effect of low water on prices is difficult to separate from the much larger effect of the energy shock: Destatis attributed the increases in fuel and heating oil prices mainly to crude oil and the expiry of a temporary energy tax cut, and producer prices of mineral oil products were 40.5 percent higher in August 2026 than a year earlier, mainly because of the Middle East conflict.
For the energy-intensive branches, which operate on thin margins in competitive international markets, higher transport costs have the same effect as higher energy costs: they reduce competitiveness relative to producers located elsewhere, for example at the coast, where raw materials can be received directly from sea-going vessels. Over time, this may influence where new capacity is built.
6. Discussion
6.1 A manageable but recurring risk
In aggregate, low water on the Rhine remains a manageable risk. Even a severe episode costs a few percent of one month’s industrial production, and part of it is recovered. In an economy that produces more than four trillion euros of output per year, these are small numbers.
But the risk is no longer occasional. Major episodes occurred in 2018, 2022 and 2026, with a brief one in the spring of 2025, and the 2026 episode was far more extreme than any before. If this frequency continues or increases, the cumulative costs become more significant, and the uncertainty affects investment decisions. A firm deciding where to build a new plant will take into account not only the average cost of transport but also its reliability.
6.2 Climate change and the hydrology of the Rhine
The Rhine has two main sources of water: rainfall in its basin and melting snow and ice in the Alps. In summer and autumn, the Alpine contribution is crucial, especially in dry years. As Alpine glaciers retreat and snow cover declines because of rising temperatures, this contribution is expected to fall over the coming decades. At the same time, climate projections suggest drier summers in parts of central Europe. Both trends point to more frequent and longer low water episodes in late summer and autumn. The 2026 drought also lowered Lake Constance well below its long-term average. For economic planning, the question is no longer whether low water will recur, but how often and for how long.
6.3 Compound risks
The 2026 episode illustrates the importance of compound risks. Taken separately, the energy shock and the low water shock would each have had significant but manageable effects. Together, they hit the same branches at the same time and reduced their ability to adapt. The energy-intensive branches, already weakened by the 2022 energy crisis, as discussed in the previous article in this series, had fewer buffers to absorb a second disruption. Climate risk assessments for industry should therefore not consider each hazard in isolation but take into account their interaction with other shocks.
6.4 Infrastructure and adaptation
The analysis supports the case for treating adaptation as an investment priority.
Waterway infrastructure. The optimisation of the Middle Rhine navigation channel, which would add about 20 centimetres of depth at low water in the critical section, would directly reduce the frequency and severity of restrictions. In the stylised model, 20 centimetres more depth at the critical level would reduce the cost per tonne by roughly a fifth. The project has been planned for a decade; accelerating it would be a direct contribution to the resilience of German industry. The new infrastructure special fund discussed in an earlier article in this series could be used for this purpose.
Forecasting and information. Better forecasts of water levels several weeks in advance allow firms to plan stocks and transport. The 2026 episode showed the value of the existing forecasts of the federal authorities, which gave firms several days’ warning of new record lows.
Fleet adaptation. Vessels designed for shallow water can carry more cargo at low levels, as BASF’s experience in 2026 shows. Supporting the renewal of the inland fleet would increase its resilience.
Diversification. Improving rail connections and multimodal terminals for industrial sites would provide alternatives during low water episodes, although rail capacity is itself a bottleneck.
Storage. Strategic storage of critical inputs and products, such as fuels, at key locations can bridge short episodes.
6.5 Who should pay?
Waterway infrastructure is a public good and is financed by the federal government. Storage and fleet adaptation are mainly private investments, but firms may underinvest if they expect the state to intervene in a crisis, as it did in 2026 by suspending driving bans and postponing lock renovations. Public support for private adaptation can be justified where the benefits extend beyond the firm, for example when a chemical site supplies many downstream customers or when fuel supplies to a region are at stake.
6.6 The broader lesson for supply chains
The Rhine is one example of a broader phenomenon: the exposure of industrial supply chains to physical climate risks. Other examples include heat waves that reduce labour productivity and force power plants to reduce output, floods that damage factories and infrastructure, as in the Ahr valley in 2021, and droughts that affect agricultural inputs. For an export-oriented manufacturing economy like Germany, the resilience of supply chains to such risks is becoming a competitive factor in its own right.
7. Scenarios
7.1 Assumptions
The author considers three scenarios for the frequency and duration of low water episodes below the critical level.
Historical. One long episode of about 60 days per decade, roughly the frequency of severe episodes in the decades before 2015.
Recent. One episode every three years, lasting about 70 days, consistent with the sequence of 2018, 2022 and 2026.
Warmer climate. One episode every two years, lasting about 90 days, comparable to 2026, reflecting a possible intensification of dry summers and the decline of the Alpine contribution to the river’s flow.
7.2 Results
Figure 6 shows the expected annual cost in each scenario, measured as the average annual loss of industrial output.
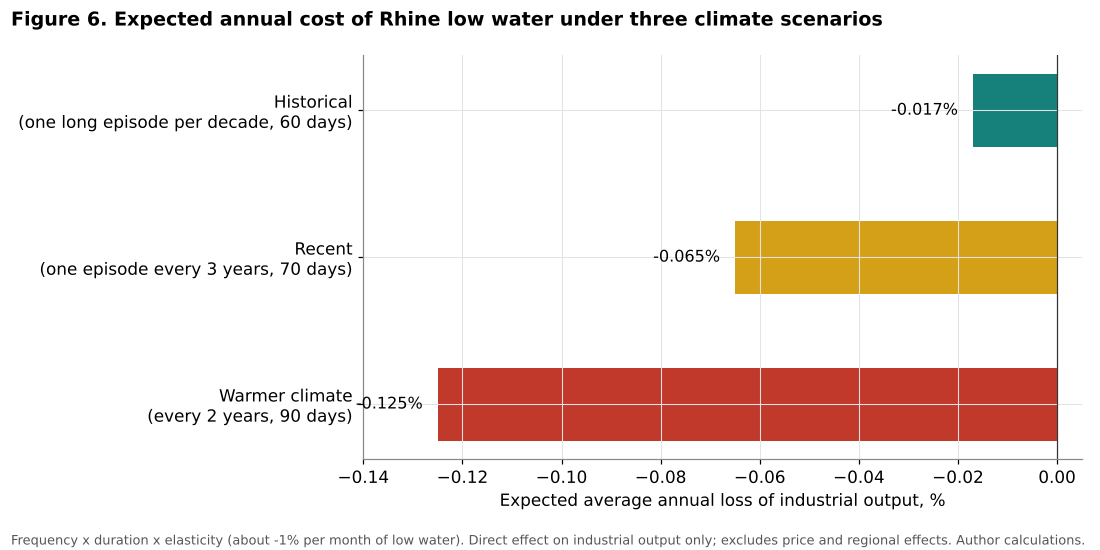
In the historical scenario, the expected annual loss is about 0.017 percent of industrial output. In the recent scenario, it rises to about 0.065 percent, almost four times as much. In the warmer climate scenario, it reaches about 0.125 percent, more than seven times the historical level.
| Scenario | Frequency | Duration (days) | Expected annual loss (% of industrial output) |
|---|---|---|---|
| Historical | 1 per decade | 60 | 0.017 |
| Recent | 1 every 3 years | 70 | 0.065 |
| Warmer climate | 1 every 2 years | 90 | 0.125 |
Table 3. Expected annual cost of Rhine low water. Source: calculations by the author.
7.3 Interpretation
These figures are small in aggregate, which confirms that low water is not a threat to the German economy as a whole. But three considerations suggest that they understate the true cost. First, they include only the direct effect on industrial output, not the higher transport costs paid by firms that continue to produce, nor the costs of storage, emergency logistics and adaptation. Second, the costs are concentrated on a few branches and regions; for a chemical site on the Rhine, an episode of 90 days every two years would be a recurring disruption with significant effects on profitability and investment decisions. Third, the elasticity was estimated on milder episodes. If record levels such as those of 2026 become more common, and if longer episodes exhaust the buffers that firms have built, the effect per day of low water could be larger.
7.4 Indicators to watch
The author suggests monitoring:
1. Daily water levels at the Kaub gauge and the forecasts of the federal waterways administration and the Federal Institute of Hydrology. 2. Monthly production in chemicals, refining and metals. 3. Inland waterway freight volumes for 2026 and freight rates. 4. Progress on the Middle Rhine channel optimisation project. 5. Investment and logistics decisions by large industrial sites along the Rhine.
8. Conclusion
The 2026 low water on the Rhine was the most extreme on record. The Kaub gauge fell below the 2018 record in early August, reached 5 centimetres in mid-August and dropped slightly below zero at the end of September, after a brief recovery. It occurred at a moment of particular vulnerability, when German energy-intensive industries were also hit by a new energy price shock, and the Bundesbank identified it as one of the factors that slowed the economy in the third quarter.
The analysis shows that:
1. Freight carried on German inland waterways fell from 222.7 million tonnes in 2017 to 171.6 million tonnes in 2025, the lowest level since reunification, with sharp drops in the low water years 2018 and 2022. 2. At the critical level of about 78 centimetres at Kaub, a barge can carry less than half its normal load; in August 2026, ships carried only 20 to 30 percent of their normal cargo, and freight rates between Rotterdam and Karlsruhe were reported to have more than tripled. 3. The 2026 episode probably cost at least 2.3 to 3 percent of one month’s industrial output, concentrated in refining, chemicals and metals, and possibly more given its extreme depth. 4. In aggregate, the expected annual cost of low water remains small, between about 0.02 and 0.13 percent of industrial output depending on the climate scenario, but it is concentrated on strategic branches and regions and interacts with other shocks.
The Rhine is a reminder that climate change is not only a long-term environmental issue but a present economic risk for industrial supply chains. For Germany, the risk is manageable, but it is no longer exceptional. Treating adaptation, from the deepening of the Middle Rhine channel to better forecasts, storage and fleet renewal, as an investment priority would be a modest cost compared with the value of the industrial activity that depends on the river.
Need this analysis for your organisation?
We prepare confidential briefings, executive talks and studies on countries, markets and policies, built on the same method as this article.
Request a briefingSupport independent analysis
Our studies are free to read and carry no advertising. If this one was useful, a small contribution helps us publish the next.
Support our workGo further: books by Global Strategy Files

Frequently asked questions
How low did the Rhine fall in 2026?
To record levels. At the Kaub gauge, the previous record low of 25 centimetres from October 2018 was broken in early August 2026; the gauge fell to 5 centimetres on 17 August, then to 2 centimetres in late September and briefly below zero.
How does low water on the Rhine affect German industry?
Low water cuts barge capacity and raises costs. In August 2026 ships could carry only 20 to 30 percent of their usual cargo, and freight rates between Rotterdam and Karlsruhe reportedly rose from about 45 to 150 to 160 euros per tonne.
How much did the 2026 Rhine low water cost Germany?
With at least 70 and probably around 90 days below the critical level, the episode cost about 2.3 to 3 percent of one month’s industrial output, probably more, with refining, chemicals and metal production most affected.
Is Rhine freight transport declining?
Yes. Freight carried on German inland waterways fell from 222.7 million tonnes in 2017 to 171.6 million tonnes in 2025, the lowest level since reunification, and recurrent low water has become a structural climate risk.
Methodological note
All calculations and charts were produced by the author. Inland waterway freight data are Destatis annual results as published or reported in the press (2017, 2018, 2019, 2021, 2022, 2023, 2024 and 2025); the 2020 value is not shown because it could not be verified. Industrial production data for July and August 2026 are from Destatis. The description of the 2026 episode is based on the Bundesbank Monthly Report of September 2026 and on press reports citing the WSV and the BfG; the readings in Figure 5 mix spot readings and daily values. The duration of the 2026 episode below the critical level (at least 70 and probably about 90 days) is an estimate by the author. Freight rates are from market reports cited in the press and have no primary source. The barge capacity model is stylised. The output elasticity (about 1 percent of monthly industrial production for a month with 30 days of low water below 78 centimetres at Kaub) is taken from Ademmer, Jannsen and Meuchelböck (2023). The scenarios are illustrative.
References
Ademmer, M., Jannsen, N. and Meuchelböck, S. (2023). Extreme Weather Events and Economic Activity: The Case of Low Water Levels on the Rhine River. German Economic Review, published online 14 March 2023, DOI 10.1515/ger-2022-0077. Earlier version: Kiel Working Paper No. 2155 (2020).
Barrot, J.-N. and Sauvagnat, J. (2016). Input Specificity and the Propagation of Idiosyncratic Shocks in Production Networks. Quarterly Journal of Economics, 131(3), 1543 to 1592.
Carvalho, V. M., Nirei, M., Saito, Y. U. and Tahbaz-Salehi, A. (2021). Supply Chain Disruptions: Evidence from the Great East Japan Earthquake. Quarterly Journal of Economics, 136(2), 1255 to 1321.
Dell, M., Jones, B. F. and Olken, B. A. (2012). Temperature Shocks and Economic Growth: Evidence from the Last Half Century. American Economic Journal: Macroeconomics, 4(3), 66 to 95.
Deutsche Bundesbank (2026). Kurzbericht: Konjunkturlage. Monatsbericht, September 2026. Frankfurt am Main.
Hsiang, S. (2016). Climate Econometrics. Annual Review of Resource Economics, 8, 43 to 75.
Jonkeren, O., Rietveld, P. and van Ommeren, J. (2007). Climate Change and Inland Waterway Transport: Welfare Effects of Low Water Levels on the River Rhine. Journal of Transport Economics and Policy, 41(3), 387 to 411.
Statistisches Bundesamt (Destatis) (2019 to 2026). Güterverkehr: Binnenschifffahrt, annual results, as reported by VerkehrsRundschau, Eurotransport and Tiroler Tageszeitung. Wiesbaden.
Statistisches Bundesamt (Destatis) (2023). Goods transport by inland waterways in 2022 at lowest level since German unification. Press release, March 2023.
Statistisches Bundesamt (Destatis) (2026). Produktion im August 2026: +2,0 % zum Vormonat. Press release, 8 October 2026.
VerkehrsRundschau (2026). Rhein-Niedrigwasser: Pegel Kaub erreicht historischen Tiefstand. 14 August 2026 (dpa).
ZDFheute (2026). Niedrigwasser im Rhein: Nur noch vereinzelt Güterschiffe. 28 September 2026.
