
Canada’s Productivity Problem and the Limits of Tax Incentives: Measuring the Gap and the Effect of the 2025 Super-Deduction


Canada’s Productivity Problem and the Limits of Tax Incentives: Measuring the Gap and the Effect of the 2025 Super-Deduction
Driss EFFINA, PhD Independent Researcher, Global Strategy Files Reading time: about 25 minutes
Key takeaways
- Canadian labour productivity grew 26.7 percent between 1999 and 2025, against 67.9 percent in the United States.
- Canadian output per hour fell from 88 percent of the US level in 1984 to 71 percent in 2022.
- Canadian firms invest only 32 cents in machinery and equipment per worker for every US dollar, down from 63 cents in 2008.
- The 2025 super-deduction cuts the marginal effective tax rate on new investment from 15.6 to 13.2 percent.
Abstract
Canada’s weak productivity has become one of the central concerns of its economic policy. In March 2024, a senior deputy governor of the Bank of Canada described the situation as an emergency, and the federal budget of November 2025 introduced a “productivity super-deduction” designed to encourage business investment. This article measures the size of the Canadian productivity gap, its link with business investment, and the likely effect of the new tax incentives, using data from Statistics Canada, the Bank of Canada, the Department of Finance, the C.D. Howe Institute and the Fraser Institute, together with the author’s own calculations. Five results emerge. First, Canadian labour productivity grew by 26.7 percent between 1999 and 2025, against 67.9 percent in the United States, an average of 0.9 percent per year against 2.0 percent; Canadian output per hour fell from 88 percent of the American level in 1984 to 71 percent in 2022. Second, the gap is closely linked to investment: real investment in machinery and equipment per worker in Canada fell from 63 cents for every dollar invested in the United States in 2008 to only 32 cents in the second quarter of 2025. Third, productivity rebounded by 1.0 percent in the second quarter of 2026, its strongest gain since 2020, but this followed two quarters of decline and is not yet evidence of a turning point. Fourth, the budget measures reduce the marginal effective tax rate on new investment from 15.6 to 13.2 percent; the author’s simulation suggests this would raise the long-run capital stock by about 0.5 to 1.7 percent and labour productivity by about 0.2 to 0.6 percent. Fifth, the annual fiscal cost of the new incentives, about 360 million dollars, is equivalent to less than 0.2 percent of the annual gap in machinery and equipment investment with the United States. The article concludes that tax incentives are a useful but very small part of the answer, and that the productivity gap is mainly a question of competition, scale, regulation and the allocation of capital.
Keywords: Canada, productivity, business investment, capital deepening, tax incentives, marginal effective tax rate, accelerated depreciation, R&D, competitiveness
JEL codes: O47, E22, H25, O30, O51
1. Introduction
Productivity is the most important determinant of long-term living standards. A country whose workers produce more per hour can pay higher wages, finance better public services and support an ageing population. Over the past four decades, Canada has steadily lost ground relative to the United States on this measure, and the gap has widened markedly since the mid-2010s.
The issue moved to the centre of Canadian economic debate in March 2024, when Carolyn Rogers, Senior Deputy Governor of the Bank of Canada, gave a speech titled “Time to break the glass: Fixing Canada’s productivity problem”. She noted that Canadian output per hour had fallen from 88 percent of the American level in 1984 to 71 percent in 2022, and that the level of business sector productivity was roughly the same as seven years earlier. The phrase “break the glass”, a reference to emergency alarms, was widely quoted.
Since then, the economic context has worsened. American tariffs have reduced exports and business investment, and the economy contracted in late 2025 and early 2026. The federal budget of 4 November 2025, presented under the title “Canada Strong”, made productivity and competitiveness one of its main themes, with about 110 billion dollars of measures over five years, including a set of accelerated tax deductions for business investment presented as a “productivity super-deduction”.
This article asks three questions. How large is the Canadian productivity gap, and how is it changing? To what extent is it explained by insufficient business investment? And what can we expect from the new tax incentives? It uses official data and published research, and adds the author’s own calculations, including a simulation of the effect of the super-deduction based on the user cost of capital.
Section 2 presents the context. Section 3 reviews the literature. Section 4 presents the data and methods. Section 5 presents the results. Section 6 discusses them. Section 7 presents scenarios to 2035. Section 8 concludes.
2. Context
2.1 What productivity measures
Labour productivity is measured as real output divided by hours worked. In the business sector, Statistics Canada publishes it quarterly. It grows when workers have more or better capital to work with (capital deepening), when they are better trained, and when firms organise production more efficiently or adopt new technologies (multifactor productivity). It is also influenced by the composition of the economy: a shift of workers toward sectors with high output per hour, such as mining or finance, raises average productivity, while a shift toward sectors with low output per hour, such as retail or food services, lowers it.
2.2 Why the gap matters
The productivity gap translates directly into a gap in income. According to the Fraser Institute (2026), the difference in GDP per person between the United States and Canada rose from 10,766 Canadian dollars in 1999 to 23,757 dollars in 2024, more than doubling. GDP per person in Canada fell in real terms for several years after 2022, as population growth outpaced output growth.
The gap also matters for the public finances, since tax revenue grows with incomes, and for the sustainability of public pensions and health care in an ageing society. With the working-age population growing more slowly due to lower immigration, Canada can no longer rely on population growth to drive GDP growth; it must rely on productivity.
2.3 Budget 2025
The budget of November 2025 introduced several measures intended to encourage investment:
- Immediate expensing for manufacturing and processing buildings. Buildings acquired on or after 4 November 2025 and used for manufacturing or processing can be fully deducted in the first year if they are put into use before 2030, with the rate falling to 75 percent for buildings put into use in 2030 and 2031, and 55 percent in 2032 and 2033.
- Reinstatement of the Accelerated Investment Incentive. This measure, which provides an enhanced first-year deduction for most capital assets and was due to be phased out after 2027, was restored. It covers manufacturing and processing machinery and equipment, clean energy equipment, zero-emission vehicles, capital expenditures for scientific research, patents, data network infrastructure and computers.
- Accelerated deductions for low-carbon liquefied natural gas facilities.
- Changes to the Scientific Research and Experimental Development (SR&ED) tax credit. The expenditure limit on which Canadian-controlled private corporations can earn the enhanced refundable credit of 35 percent was raised from 3 million to 6 million dollars, and administrative changes were made to speed up the processing of claims.
The Department of Finance estimates that these measures reduce the marginal effective tax rate on new business investment from 15.6 percent to 13.2 percent, which it says is the lowest in the G7. The estimated cost of the super-deduction is 1.5 billion dollars over five years, and that of the SR&ED changes 293 million dollars over five years.
3. Literature review
The literature on Canadian productivity and on the effect of tax incentives on investment can be grouped into four strands.
The first strand documents the Canada United States gap. Studies by the Centre for the Study of Living Standards, Statistics Canada and the Bank of Canada have repeatedly shown that the gap is concentrated in a few sectors, notably manufacturing, information technology and professional services, and that it is related to lower investment in machinery, equipment and intellectual property, to smaller firm size and to weaker adoption of technology. A Bank of Canada study by MacGee and Rodrigue (2024), cited by CIBC Economics (2026), suggested that a significant part of the measured gap in income comes from the top of the income distribution, where American earnings are much higher.
The second strand concerns the role of capital. Growth accounting decomposes labour productivity growth into the contribution of capital deepening and that of multifactor productivity. Since about 2015, capital per worker in Canada has stagnated or declined, according to the C.D. Howe Institute, which has documented that Canadian workers now have less and older capital than a decade ago. In a context of rapid labour force growth, investment did not keep pace with the number of workers.
The third strand concerns the effect of taxes on investment. The neoclassical theory of investment, developed by Jorgenson (1963) and Hall and Jorgenson (1967), shows that investment depends on the user cost of capital, which includes taxes. Empirical studies have estimated the elasticity of investment to the user cost. Zwick and Mahon (2017), using American data on bonus depreciation, found large effects, with an elasticity of investment to the net present value of deductions of about 1.6, larger for small firms. Other estimates, reviewed by Chirinko, Fazzari and Meyer (1999), are lower, often between 0.25 and 1. The range of estimates is wide, which is why the simulation in this article uses several values.
The fourth strand concerns competition and firm dynamics. Several authors argue that Canada’s productivity problem is not mainly a tax problem but a problem of insufficient competition in protected sectors such as telecommunications, banking, air transport and retail, of regulatory barriers to firm growth, of interprovincial trade barriers, and of a tax system that favours small firms and may discourage growth. The Senior Deputy Governor of the Bank of Canada identified competition as her biggest concern in her 2024 speech.
4. Data and methodology
4.1 Data
- Statistics Canada quarterly estimates of labour productivity, hourly compensation and unit labour costs in the business sector, as reported for the fourth quarter of 2025 and the first and second quarters of 2026.
- The Fraser Institute (2026) for cumulative growth of labour productivity in Canada and the United States from 1999 to 2025 and for GDP per person.
- The Bank of Canada (Rogers, 2024) for relative productivity levels.
- The C.D. Howe Institute (2025) for investment per worker in Canada and the United States.
- The Department of Finance (Budget 2025) for the marginal effective tax rate and the cost of the measures.
- Statistics Canada for gross domestic expenditure on R&D.
4.2 Calculations
1. Annual growth rates are derived from cumulative growth over 26 years. 2. The investment gap is the difference between investment per worker in machinery and equipment in the United States and in Canada in the second quarter of 2025 (8,700 US dollars at purchasing power parity), multiplied by an approximate Canadian labour force of 22.3 million. This gives an order of magnitude of the annual investment Canada would need to make to match the American intensity. 3. The effect of the super-deduction. The author uses a simplified user cost of capital: c = r / (1 minus METR) plus δ, where r is the required after-tax real return (5 percent), METR is the marginal effective tax rate and δ is the depreciation rate (10 percent). The change in the user cost when the METR falls from 15.6 to 13.2 percent is multiplied by an elasticity of the capital stock to the user cost of 0.5, 1.0 or 1.6. The effect on labour productivity is the effect on the capital stock multiplied by the capital share of income (0.35). 4. Scenarios project a productivity index under three growth rates and compare it with a projection of the United States at its 1999 to 2025 average.
4.3 Limitations
The user cost calculation is a highly simplified representation; actual effects depend on the composition of investment, the profitability of firms, financing conditions, uncertainty and the response of investment to other factors, such as American tariffs. The labour force figure is approximate. The scenarios assume that Canada’s relative level in 2025 is the same as in 2022, which is an approximation.
5. Results
5.1 Four decades of relative decline
Figure 1 summarises the long-term gap.
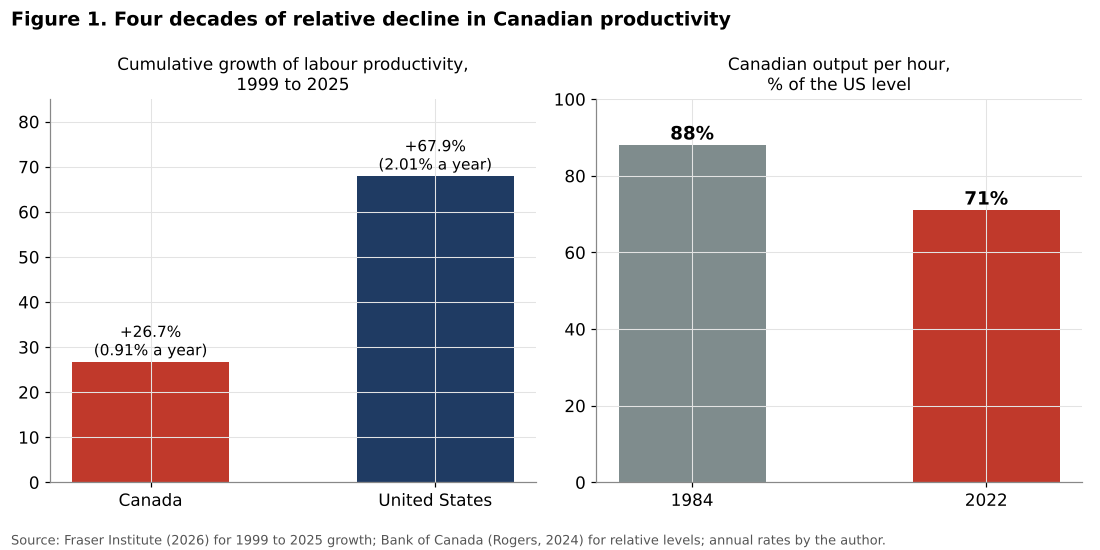
According to the Fraser Institute, labour productivity grew by 26.7 percent in Canada between 1999 and 2025, against 67.9 percent in the United States. By the author’s calculation, this corresponds to average annual growth of 0.91 percent in Canada and 2.01 percent in the United States. Over 26 years, the relative level of Canadian productivity fell by about a quarter.
The Bank of Canada’s measure of output per hour shows the same trend from an earlier starting point. In 1984, Canadian output per hour was 88 percent of the American level. In 2022, it was 71 percent. Among G7 countries, only Italy experienced a larger relative decline. CIBC Economics (2026) estimated that between 2000 and 2024, the ratio of Canadian to American GDP per hour fell by about 19 percent at constant prices, and about 12 percent at current prices, the difference reflecting the strong rise in commodity prices, which raised the value of Canadian output.
| Indicator | Canada | United States |
|---|---|---|
| Cumulative labour productivity growth, 1999 to 2025 | +26.7% | +67.9% |
| Average annual growth | 0.91% | 2.01% |
| Output per hour relative to US, 1984 | 88% | 100% |
| Output per hour relative to US, 2022 | 71% | 100% |
| GDP per person gap, 1999 (C$) | 10,766 | |
| GDP per person gap, 2024 (C$) | 23,757 |
Table 1. Indicators of the productivity gap. Source: Fraser Institute (2026), Bank of Canada (2024); calculations by the author.
5.2 Recent developments
Figure 2 presents the latest quarterly data.
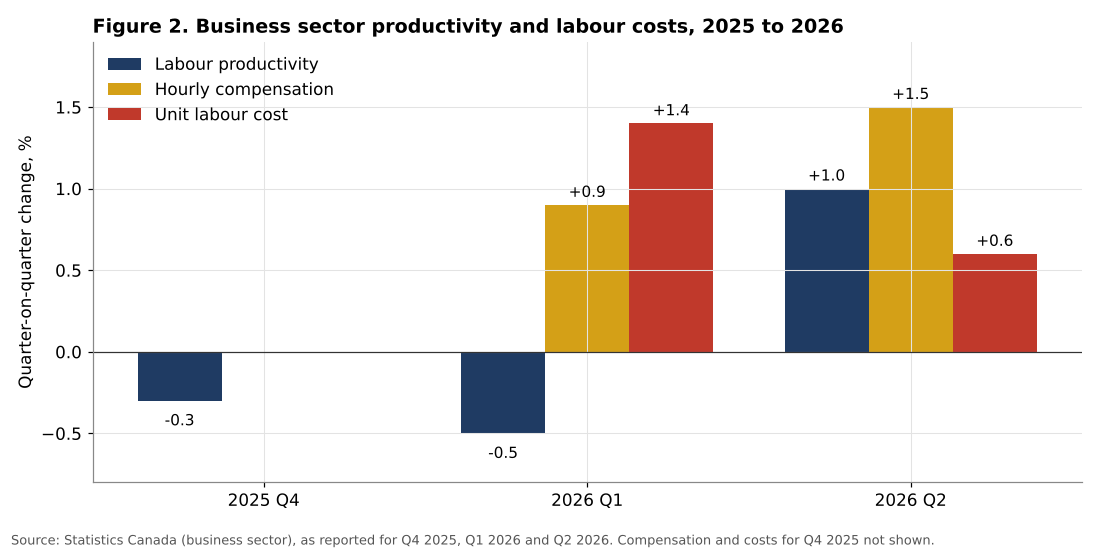
After falling by 0.3 percent in the fourth quarter of 2025 and by 0.5 percent in the first quarter of 2026, as business sector output contracted, labour productivity rose by 1.0 percent in the second quarter of 2026. This was the largest quarterly gain since the second quarter of 2020, a period distorted by the pandemic. Productivity rose in 12 of 16 main industry sectors, led by mining and oil and gas extraction, wholesale trade and manufacturing. In goods-producing industries, productivity rose by 1.7 percent after two quarterly declines, and in service industries by 0.7 percent, the fourth consecutive increase.
Unit labour costs, which measure the cost of labour per unit of output, rose by 1.4 percent in the first quarter and 0.6 percent in the second, their fifth consecutive increase. Hourly compensation rose by 1.5 percent in the second quarter, faster than productivity.
One good quarter is not a trend. The rebound of the second quarter reflects partly a recovery of output after two weak quarters, while hours worked fell slightly. It shows, however, that Canadian productivity is not condemned to stagnate: when output recovers while employment grows slowly, productivity rises. The slowdown of population growth, which reduces the growth of the labour force, may have this effect: firms that cannot easily hire must invest to raise output.
5.3 The investment gap
Figure 3 presents investment in machinery and equipment per worker in Canada and the United States.
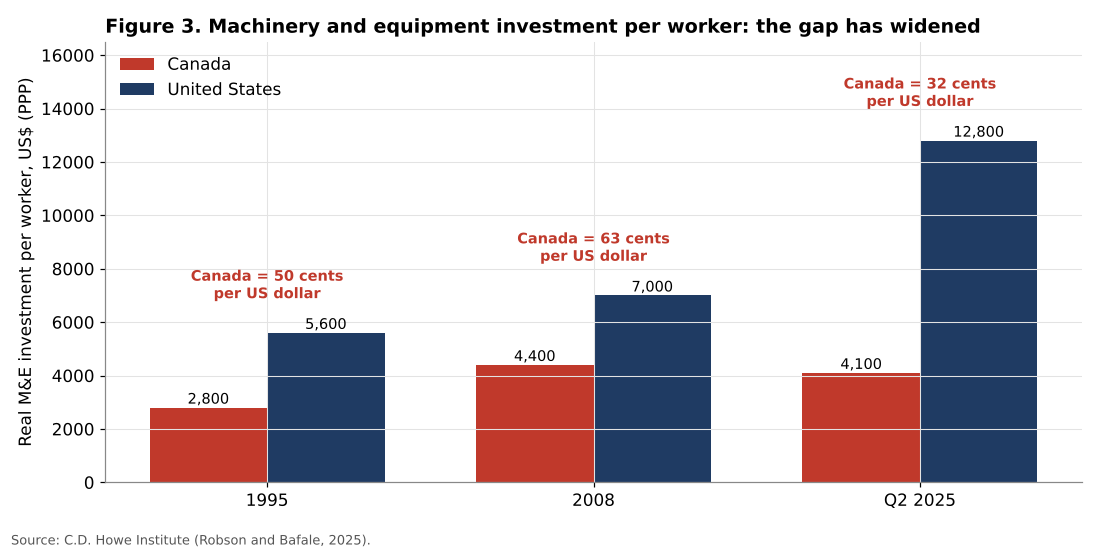
The figures of the C.D. Howe Institute are striking. In 1995, real investment in machinery and equipment per worker was about 2,800 US dollars at purchasing power parity in Canada and 5,600 dollars in the United States: Canadian workers received about 50 cents of new equipment for every dollar received by American workers. By 2008, the ratio had improved to 63 cents (4,400 dollars against 7,000). Since then, the ratio has collapsed. In the second quarter of 2025, investment per worker was about 4,100 dollars in Canada and 12,800 dollars in the United States, a ratio of 32 cents. In 2024, Canadian workers received 41 cents of machinery and equipment and 32 cents of intellectual property investment for every dollar received by American workers.
Two forces explain this trend. In Canada, investment per worker fell after 2014, when the collapse of oil prices reduced investment in the energy sector, which had been a major source of capital spending, and remained weak thereafter, while the labour force grew rapidly. In the United States, investment per worker rose strongly, particularly in information technology, software and, more recently, data centres and artificial intelligence.
By the author’s calculation, closing the gap in machinery and equipment investment per worker would require additional annual investment of about 190 billion US dollars at purchasing power parity, given a labour force of about 22 million. This order of magnitude illustrates the scale of the problem: it represents several percent of GDP, far more than any tax measure could induce on its own.
5.4 What the super-deduction can achieve
Figure 4 presents the effect of the budget measures on the marginal effective tax rate and the author’s simulation of their long-run effects.
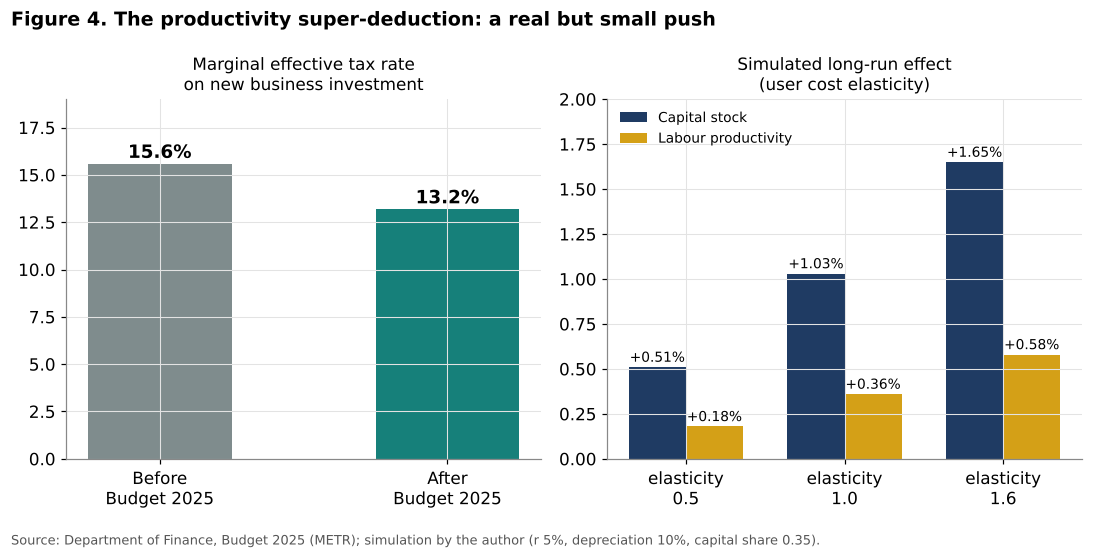
The Department of Finance estimates that the measures reduce the marginal effective tax rate on new business investment by 2.4 percentage points, from 15.6 to 13.2 percent. Using the simplified user cost formula, with a required real return of 5 percent and a depreciation rate of 10 percent, this reduces the user cost of capital from 15.92 percent to 15.76 percent, a reduction of about 1.0 percent.
The effect on the long-run capital stock depends on the elasticity of capital to its user cost:
| Elasticity | Effect on capital stock | Effect on labour productivity |
|---|---|---|
| 0.5 | +0.51% | +0.18% |
| 1.0 | +1.03% | +0.36% |
| 1.6 | +1.65% | +0.58% |
Table 2. Simulated long-run effects of the 2025 investment incentives. Source: calculations by the author.
Even with the high elasticity found by Zwick and Mahon (2017) for American bonus depreciation, the long-run effect on labour productivity would be less than 0.6 percent, spread over several years. This is a positive contribution, but small relative to the cumulative gap of about 25 percent that has opened with the United States since 1999.
The fiscal cost provides another perspective. The super-deduction and the SR&ED changes together cost about 1.8 billion dollars over five years, or about 360 million dollars per year on average. This is equivalent to less than 0.2 percent of the annual gap in machinery and equipment investment estimated above. The incentive is well designed in the sense that it targets new investment rather than existing capital, but it is modest in scale.
There are two reasons to think the simulation may understate the effect. First, accelerated depreciation particularly benefits firms with limited access to finance, because it improves their cash flow at the time of investment; this effect is not captured by the user cost formula. Second, the measures send a signal of policy stability that may reduce uncertainty. There are also reasons to think it may overstate the effect: investment decisions in 2026 are dominated by the uncertainty created by American tariffs and the CUSMA review, which no tax incentive can offset.
5.5 The income cost and the innovation deficit
Figure 5 shows the gap in GDP per person and the level of R&D spending in Canada.
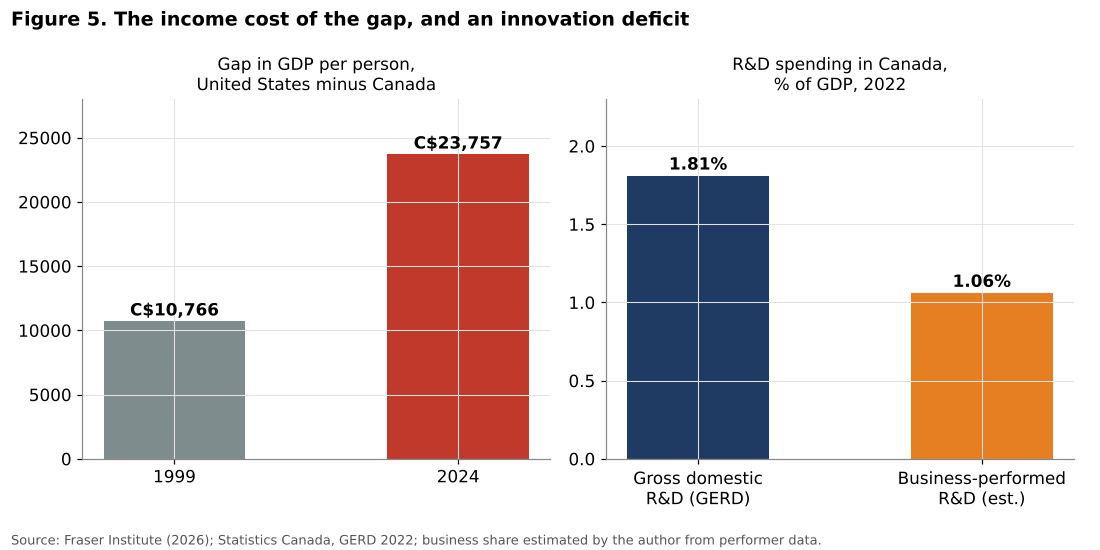
The gap in GDP per person between the United States and Canada more than doubled between 1999 and 2024, from about 10,800 to about 23,800 Canadian dollars. This is the concrete measure of what the productivity gap means for Canadians.
Innovation is a key driver of multifactor productivity. In 2022, gross domestic expenditure on R&D in Canada was 51.7 billion dollars, or 1.81 percent of GDP, according to Statistics Canada. The business sector performed about 30.4 billion dollars, which the author estimates at about 1.06 percent of GDP. These levels are below the average of the OECD and well below those of the United States, where R&D intensity is roughly twice as high. Canada spends generously on R&D tax credits, notably the SR&ED programme, but business investment in research remains low, which suggests that the obstacle is not mainly the cost of research but the incentives to innovate and to commercialise innovations.
5.6 Sectors and composition
The aggregate figures hide important differences between sectors. The rebound of the second quarter of 2026 was led by mining and oil and gas extraction, wholesale trade and manufacturing, while productivity fell in utilities and retail trade. In the first quarter, the decline had been driven by construction, agriculture and forestry, while retail, transportation and warehousing improved.
Two features of the Canadian economy deserve attention. The first is the weight of natural resources. Oil and gas extraction has very high output per hour, because it is extremely capital intensive, but its measured productivity fluctuates with the volume of production and is affected by long investment cycles. When investment in the oil sands slowed after 2014, the capital stock per worker of the whole economy was affected. The second is the weight of construction and real estate. Construction absorbed a large share of the labour force during the housing boom, and its measured productivity has been weak for decades. A growing share of employment in sectors with weak productivity growth lowers the aggregate rate, even if productivity in each sector were unchanged.
These composition effects mean that part of the gap with the United States reflects differences in industrial structure rather than in efficiency within each sector. But studies that compare the same sectors across the two countries find that a large gap remains within manufacturing, information and communication, finance and professional services, the sectors most exposed to technological change.
5.7 Unit labour costs, wages and inflation
Productivity also matters for inflation and wages. Unit labour costs rise when hourly compensation grows faster than productivity. In the first half of 2026, compensation grew faster than productivity in each quarter, and unit labour costs rose for the fifth consecutive quarter. If this continued, firms would face pressure either to raise prices or to accept lower margins, and the Bank of Canada would have less room to support the economy.
Conversely, a durable increase in productivity growth would allow wages to rise faster without generating inflation. This is the mechanism by which productivity translates into higher living standards. Over the long period from 1999 to 2025, weak productivity has been reflected in weak growth of real wages in many sectors, and in the growing gap in income per person with the United States.
6. Discussion
6.1 The diagnosis: capital, competition and scale
The data presented in this article support a clear diagnosis. The Canadian productivity gap with the United States has widened for four decades and accelerated after 2014. It is closely associated with a collapse of investment per worker relative to the United States, both in machinery and equipment and in intellectual property. And the gap in investment is so large that tax incentives of the size introduced in 2025 cannot close it.
Why do Canadian firms invest so much less than American firms? The literature suggests several explanations. Canadian firms are smaller on average and operate in a smaller domestic market, which limits economies of scale and the return on large investments. Several important sectors, such as telecommunications, banking, air transport, groceries and some professional services, are protected from foreign competition by regulation, which reduces the pressure to invest and innovate. Interprovincial barriers to trade and labour mobility fragment the domestic market. Regulatory approval processes for major projects are long and uncertain, which discourages investment in natural resources and infrastructure. And the composition of the economy, with a large share of natural resources and real estate, may have diverted capital toward sectors with lower productivity growth.
The rapid growth of the population between 2022 and 2024 also played a role. When labour is abundant and relatively cheap, firms have less incentive to invest in labour-saving capital. The slowdown of population growth since 2025 may reverse this effect, as suggested by the productivity rebound of the second quarter of 2026.
6.2 What tax policy can and cannot do
Tax policy is an important instrument, and the Canadian marginal effective tax rate on new investment is now low by international standards. Further reductions would have diminishing effects. The simulation suggests that even the high estimates of the elasticity of investment produce small effects on productivity.
This does not mean the measures are useless. A permanent, predictable reduction of the cost of capital, particularly for manufacturing and for intangible assets, can contribute to a gradual improvement of capital intensity. But the main obstacles to investment in Canada are not fiscal.
6.3 The broader policy agenda
The analysis suggests that the most effective productivity policies would address:
- Competition. Opening protected sectors to more competition, including foreign entry, would raise the pressure to innovate and invest.
- Internal trade. Removing interprovincial barriers to trade in goods and services and to the mobility of workers would enlarge the effective domestic market.
- Regulation of major projects. Faster and more predictable approvals for energy, mining, transport and housing projects would reduce the risk premium on investment.
- Scale-up of firms. A tax and support system that encourages firms to grow rather than to stay small, and better access to growth capital, would help Canadian firms reach the scale needed to compete internationally.
- Adoption of technology. Encouraging the diffusion of digital technologies and artificial intelligence among small and medium-sized firms could raise productivity in services, which account for most employment.
- Skills. Better matching of immigrants’ skills with jobs, and more training of existing workers.
6.4 The role of the trade conflict
The American tariffs and the uncertainty surrounding the CUSMA review have a double effect on productivity. In the short term, they reduce investment, as firms postpone decisions until the conditions of access to the American market are clear. In the longer term, they could encourage a reallocation of resources toward more productive firms and sectors, as weaker exporters exit, and could push Canadian policymakers to undertake reforms, such as the removal of internal trade barriers, that have been postponed for decades. The experience of the 1989 Free Trade Agreement, analysed by Trefler (2004), showed that trade shocks can raise productivity substantially in exposed industries, albeit at a significant short-term cost in employment.
6.5 Lessons from other countries
Other advanced economies have faced similar challenges. Australia, which also has a large resource sector and has experienced slow productivity growth, has a permanent Productivity Commission that conducts regular reviews of the obstacles to productivity and publishes recommendations that the government must respond to. Canada does not have an equivalent institution with the same mandate, although several proposals to create one have been made. The experience of countries that have successfully raised productivity growth, such as the Nordic countries in the 1990s, suggests that broad structural reforms, including the opening of protected sectors to competition and investment in skills, are more important than tax incentives alone.
6.6 A note on measurement
Productivity statistics are subject to revision and to measurement difficulties, particularly in services, where output is hard to measure, and in the digital economy, where many services are free to users. Some researchers have suggested that part of the measured gap with the United States reflects differences in the measurement of output in sectors such as finance and information technology. However, the gap is visible in a wide range of indicators, including investment per worker, R&D intensity and income per person, which makes it unlikely that it is a statistical artefact.
6.7 Productivity and the federal fiscal framework
The budget of 2025 also raises a question of consistency. A large share of the 110 billion dollars of measures described as supporting productivity and competitiveness consists of spending on infrastructure, defence, housing and industrial support, rather than of measures directly targeting the determinants of productivity identified in the literature. Public investment in infrastructure can raise productivity, particularly when it reduces transport costs or improves access to markets, but its effects depend on the selection of projects and on the speed of implementation. Industrial subsidies to specific firms, such as those granted to battery and electric vehicle plants in recent years, can attract investment, but their cost per job and their effect on aggregate productivity are debated. A rigorous evaluation of the productivity effects of each of these measures, published regularly, would help focus resources on the most effective instruments.
7. Scenarios to 2035
7.1 Three scenarios
Figure 6 presents three scenarios for Canadian labour productivity to 2035, compared with the United States at its average growth rate of 1999 to 2025.
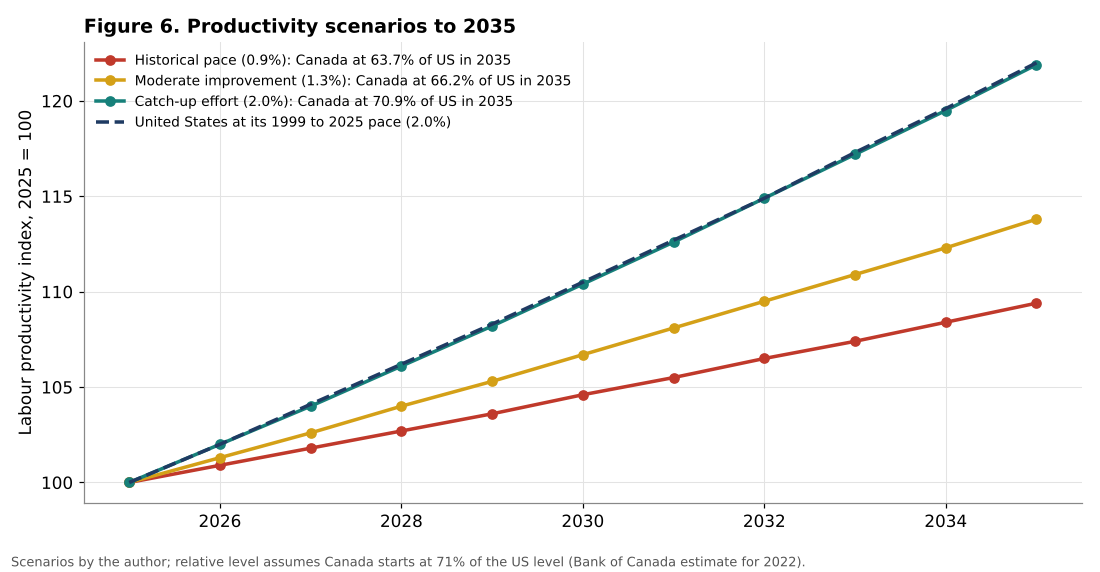
Scenario A: Historical pace. Productivity grows by 0.9 percent per year, the average of 1999 to 2025. By 2035, the index reaches about 109 (2025 = 100). If the United States continues to grow at 2.0 percent per year, Canadian productivity would fall to about 64 percent of the American level, compared with about 71 percent today.
Scenario B: Moderate improvement. Productivity growth rises to 1.3 percent per year, as the effects of the investment incentives, slower labour force growth and some structural reforms accumulate. By 2035, Canada would reach about 66 percent of the American level. The gap continues to widen, but more slowly.
Scenario C: Catch-up effort. A broad programme of reforms, including competition, internal trade, regulation and support for the adoption of technology, raises productivity growth to 2.0 percent per year, the American pace. The relative level stabilises at about 71 percent. Closing the gap would require growth faster than in the United States for a prolonged period.
7.2 Interpretation
These scenarios show the arithmetic of the problem. Simply matching American productivity growth, which Canada has not done for decades, would only stop the widening of the gap. To close even part of the gap, Canada would need to grow faster than the United States for many years, which has happened only rarely in its modern history.
The scenarios also show why productivity is so important for living standards. The difference between scenario A and scenario C in 2035 is about 11 percent of output per hour, which, applied to the Canadian economy, represents several hundred billion dollars of annual income.
7.3 Indicators to monitor
1. Quarterly business sector labour productivity, published by Statistics Canada. 2. Non-residential business investment, particularly in machinery, equipment and intellectual property, in the quarterly national accounts. 3. Investment per worker relative to the United States, published annually by the C.D. Howe Institute. 4. Business expenditure on R&D as a percentage of GDP. 5. Progress in removing interprovincial trade barriers and in reforming the approval of major projects.
8. Conclusion
This article has measured Canada’s productivity gap and assessed the likely effect of the investment incentives introduced in 2025. Its main conclusions are:
1. Canadian labour productivity grew by 0.9 percent per year between 1999 and 2025, against 2.0 percent in the United States. Canadian output per hour fell from 88 percent of the American level in 1984 to 71 percent in 2022. 2. The gap is closely linked to investment: Canadian workers receive only 32 cents of new machinery and equipment for every dollar received by American workers, down from 63 cents in 2008. 3. Productivity rebounded by 1.0 percent in the second quarter of 2026 after two quarters of decline, but it is too early to speak of a turning point. 4. The 2025 super-deduction reduces the marginal effective tax rate on new investment from 15.6 to 13.2 percent. By the author’s simulation, it could raise labour productivity by 0.2 to 0.6 percent in the long run. 5. The annual fiscal cost of the new incentives, about 360 million dollars, is very small relative to the investment gap with the United States, estimated at about 190 billion US dollars per year.
Tax incentives are a useful complement to a productivity strategy, but they cannot be its centre. The productivity gap reflects deeper features of the Canadian economy: limited competition in key sectors, fragmented internal markets, slow regulatory processes, small firms and low adoption of technology. Addressing these features is politically more difficult than reducing taxes, but it is the only way to reverse four decades of relative decline. The productivity rebound of 2026, if confirmed, offers a window in which these reforms could produce visible results.
Need this analysis for your organisation?
We prepare confidential briefings, executive talks and studies on countries, markets and policies, built on the same method as this article.
Request a briefingSupport independent analysis
Our studies are free to read and carry no advertising. If this one was useful, a small contribution helps us publish the next.
Support our workGo further: books by Global Strategy Files


Frequently asked questions
How large is Canada’s productivity gap with the United States?
Large and growing. Canadian labour productivity grew 26.7 percent between 1999 and 2025, against 67.9 percent in the United States, and output per hour fell from 88 percent of the American level in 1984 to 71 percent in 2022.
Why is Canadian productivity so weak?
Weak business investment is a key reason. Real investment in machinery and equipment per worker in Canada fell from 63 cents for every dollar invested in the United States in 2008 to only 32 cents in the second quarter of 2025.
What is Canada’s productivity super-deduction?
It is a tax incentive introduced in the November 2025 federal budget to encourage business investment. The measures reduce the marginal effective tax rate on new investment from 15.6 to 13.2 percent, at an annual fiscal cost of about 360 million dollars.
Will the super-deduction close Canada’s productivity gap?
Only marginally. The simulation suggests it would raise the long-run capital stock by about 0.5 to 1.7 percent and labour productivity by about 0.2 to 0.6 percent, so competition, scale, regulation and capital allocation matter more.
Methodological note
All calculations were carried out by the author using the sources listed below. Annual growth rates are geometric averages over 1999 to 2025. The investment gap uses investment per worker in the second quarter of 2025 from the C.D. Howe Institute and an approximate labour force of 22.3 million. The user cost simulation uses c = r / (1 minus METR) plus δ with r = 5 percent and δ = 10 percent, elasticities of 0.5, 1.0 and 1.6, and a capital share of 0.35. The business share of R&D is estimated from performer data for 2022. The scenarios assume a relative productivity level of 71 percent of the United States in 2025. All parameters are assumptions, and the results should be interpreted as orders of magnitude.
References
Bank of Canada (2024). Rogers, C. Time to Break the Glass: Fixing Canada’s Productivity Problem. Speech, 26 March 2024.
Chirinko, R. S., Fazzari, S. M. and Meyer, A. P. (1999). How Responsive Is Business Capital Formation to Its User Cost? An Exploration with Micro Data. Journal of Public Economics, 74(1), 53 to 80.
CIBC Economics (2026). How Bad Is It? Productivity and Prosperity in Canada versus the US. Toronto, July 2026.
Department of Finance Canada (2025). Budget 2025: Canada Strong. Ottawa, 4 November 2025.
Fraser Institute (2026). Munro, G., Fuss, J. and Emes, J. Squandering the Canadian Century, Part 1: Comparing Economic Performance in Canada and the United States. Vancouver.
Hall, R. E. and Jorgenson, D. W. (1967). Tax Policy and Investment Behavior. American Economic Review, 57(3), 391 to 414.
Jorgenson, D. W. (1963). Capital Theory and Investment Behavior. American Economic Review, 53(2), 247 to 259.
Robson, W. B. P. and Bafale, M. (2025). Surging United States Leaves Canadian Workers Behind: Tackling Canada’s Capital Crisis. C.D. Howe Institute, Toronto.
Robson, W. B. P. and Bafale, M. (2025). We Need to Get Going on Canada’s Four-Alarm Productivity Emergency. C.D. Howe Institute Intelligence Memo, 1 October 2025.
Statistics Canada (2024). Gross Domestic Expenditures on Research and Development, 2022 (final), 2023 (preliminary) and 2024 (intentions). Ottawa.
Statistics Canada (2026). Labour Productivity, Hourly Compensation and Unit Labour Cost, first and second quarters of 2026. The Daily. Ottawa.
Trefler, D. (2004). The Long and Short of the Canada-U.S. Free Trade Agreement. American Economic Review, 94(4), 870 to 895.
Zwick, E. and Mahon, J. (2017). Tax Policy and Heterogeneous Investment Behavior. American Economic Review, 107(1), 217 to 248.
