
Canada’s Dependence on the US Market in 2026: Measuring an Unprecedented Shift in Export Destinations


Canada’s Dependence on the US Market in 2026: Measuring an Unprecedented Shift in Export Destinations
Driss EFFINA, PhD Independent Researcher, Global Strategy Files Reading time: about 26 minutes
Key takeaways
- The US share of Canadian merchandise exports fell from 75.9 percent in 2024 to 68.3 percent over the twelve months to August 2026.
- About three quarters of the 2025 decline came from faster growth of exports to other markets, notably unwrought gold and energy.
- Exports to the United States still represented about 17 percent of Canadian GDP in 2025.
- The Section 338 duties raise the estimated average US tariff on Canadian goods from 5.0 percent to about 7.4 percent.
Abstract
For more than half a century, the United States has absorbed the large majority of Canadian merchandise exports. Since 2025, a sequence of American tariff measures, legal reversals and new trade instruments has put this relationship under the greatest strain since the 1988 Free Trade Agreement. This article measures how much Canada’s export dependence on the United States has actually changed and what it would cost the Canadian economy if the relationship deteriorated further. It relies on Statistics Canada merchandise trade data on a balance of payments basis, the monthly trade reports of Global Affairs Canada, the tariff assumptions published by the Bank of Canada and the legal texts of the American measures, and adds the author’s own calculations: a decomposition of the change in the US share of exports, an estimate of the average tariff after the Section 338 duties of August 2026, a bilateral balance analysis and a simple simulation of the GDP cost of three tariff scenarios. Five findings emerge. First, the US share of Canadian merchandise exports fell from 75.9 percent in 2024 to 71.6 percent in 2025 and to 68.3 percent over the twelve months to August 2026, the lowest level in the modern series. Second, about three quarters of the decline in the share in 2025 came from the growth of exports to other markets rather than from the fall of exports to the United States, and much of that growth was concentrated in a few products, notably unwrought gold and energy. Third, exports to the United States still represented about 17 percent of Canadian GDP in 2025. Fourth, the Section 338 duties raise the author’s estimate of the average American tariff on Canadian goods from 5.0 percent to about 7.4 percent. Fifth, the simulated GDP cost of current tariffs is moderate in the short run, between 0.6 and 0.9 percent of GDP, but could reach between 2 and 4 percent in the long run if the North American trade agreement were to break down. The article concludes that Canada has begun a real but narrow diversification, and that its dependence on the US market remains structural.
Keywords: Canada, United States, trade dependence, tariffs, CUSMA, export diversification, Section 232, Section 338, gravity, trade policy
JEL codes: F13, F14, F15, F51, O51
1. Introduction
Few large economies depend as much on a single foreign market as Canada does on the United States. Geography, a shared language for most of the population, deeply integrated supply chains in the automotive, energy and agri-food sectors, and three decades of free trade under the Canada United States Free Trade Agreement of 1988, the North American Free Trade Agreement of 1994 and the Canada United States Mexico Agreement (CUSMA) of 2020 have made the border one of the most intensively crossed in the world. In a typical year before 2025, around three quarters of Canadian merchandise exports went south.
This dependence was long regarded as an asset rather than a risk. Access to the largest consumer market in the world allowed Canadian producers to achieve economies of scale that the domestic market alone could not provide. The risk was considered theoretical, because the trade relationship was protected by treaty and by the political closeness of the two countries.
The events of 2025 and 2026 changed this perception. In March 2025, the American administration imposed tariffs on Canadian goods under the International Emergency Economic Powers Act (IEEPA), with an exemption for goods qualifying under CUSMA. Sector-specific tariffs under Section 232 of the Trade Expansion Act of 1962 were imposed or increased on steel, aluminium, copper, motor vehicles and lumber. On 20 February 2026, the United States Supreme Court ruled in Learning Resources, Inc. v. Trump that IEEPA does not authorise the President to impose tariffs. The administration immediately replaced the invalidated measures with a temporary global surcharge of 10 percent under Section 122 of the Trade Act of 1974, from which CUSMA goods were exempt, and which expired on 24 July 2026. In July 2026, it used for the first time Section 338 of the Tariff Act of 1930 to impose an additional duty of 50 percent on a list of Canadian products valued at nearly 20 billion US dollars, without any exemption for CUSMA goods. Canada announced retaliatory tariffs at the end of August.
In this context, the question of Canada’s dependence on the American market has become central to Canadian economic policy. Political leaders have called for diversification of trade, and the data show that exports to other markets have grown rapidly. But how much has the dependence actually changed? Is the decline in the American share durable or driven by a few products? How large is the remaining exposure, and what would it cost the economy if the relationship deteriorated further?
This article answers these questions with official data and the author’s own calculations. Section 2 describes the context. Section 3 reviews the literature on the Canada United States trade relationship. Section 4 presents the data and methodology. Section 5 presents the results. Section 6 discusses them. Section 7 presents scenarios. Section 8 concludes.
2. Context
2.1 The structure of the relationship
The trade relationship between Canada and the United States is unusual in several respects. It is very large in absolute terms: in 2024, Canada exported about 590 billion Canadian dollars of goods to the United States on a balance of payments basis. It is highly asymmetric in relative terms: the United States represents about three quarters of Canadian exports, while Canada represents less than a fifth of American exports. And it is deeply integrated: a large share of the trade consists of intermediate goods that cross the border several times before becoming final products, notably in the automotive sector.
Energy is the largest single component. Canada is the largest foreign supplier of crude oil to the United States, and almost all of its pipeline network for crude oil exports runs south. Until the opening of the expanded Trans Mountain pipeline in 2024, Canadian oil producers had practically no alternative to the American market. Other major components include motor vehicles and parts, metals and minerals, forestry products, agri-food and machinery.
2.2 The trade conflict of 2025 and 2026
The measures taken by the United States since 2025 have come in several waves.
The first wave, in March 2025, consisted of tariffs under IEEPA, initially 25 percent and later 35 percent on goods not qualifying under CUSMA, with a lower rate of 10 percent on energy and potash. Because the majority of Canadian exports could qualify under CUSMA, the effective impact was smaller than the headline rates suggested. Many exporters who had not previously bothered to document the origin of their goods began to do so, which increased the share of exports entering the United States duty free under the agreement.
The second wave consisted of sector-specific tariffs under Section 232, which apply regardless of CUSMA status. They affected steel and aluminium, later raised to 50 percent, copper, motor vehicles and parts with a deduction for American content, and lumber. These measures have been the most damaging for specific Canadian industries.
The third wave followed the Supreme Court decision of February 2026. The IEEPA tariffs disappeared, and the question of refunds to importers, potentially more than 100 billion US dollars across all countries, was left to the Court of International Trade and the customs administration. The temporary Section 122 surcharge of 10 percent did not apply to CUSMA goods and expired after the statutory limit of 150 days.
The fourth wave began with three proclamations signed on 20 July 2026 under Section 338 of the Tariff Act of 1930. This provision, never used before to impose tariffs, allows the President to impose duties of up to 50 percent on imports from countries that discriminate against American commerce. The proclamations cite the Canadian surtax on American motor vehicles, the removal of American alcoholic beverages from provincial liquor stores since March 2025 and the administration of dairy tariff rate quotas under CUSMA. The covered products include a broad annex of 439 tariff lines in sectors such as agricultural goods, textiles, wood products, cement, furniture, consumer goods and some machinery and electrical equipment, as well as alcoholic beverages and dairy products. The measures took effect in the second half of August 2026. Goods already subject to Section 232 tariffs are excluded, and energy, potash and certain critical minerals are not on the lists.
2.3 The review of CUSMA
CUSMA provides for a joint review six years after its entry into force, that is in 2026. At the review, each party must confirm whether it wishes to extend the agreement for a new sixteen year term. If one party does not confirm, the agreement enters a period of annual reviews and could expire in 2036. The review process has coincided with the trade conflict, and the negotiations between Canada and the United States have lagged behind those between the United States and Mexico. The Section 338 measures were widely interpreted as a means of pressure in these negotiations.
2.4 The macroeconomic backdrop
The Canadian economy slowed considerably during this period. According to the Bank of Canada, the level of real GDP was roughly unchanged between the first quarter of 2025 and the first quarter of 2026, as exports and housing activity declined and business investment stagnated. The unemployment rate fluctuated between about 6.5 and 7 percent. The Bank lowered its policy rate to 2.25 percent and held it there for several consecutive decisions. Growth then picked up in the second quarter of 2026, at an annualised rate of 3.3 percent according to Statistics Canada, supported by exports and business investment. The Bank estimates that potential output growth has fallen to about 1.1 percent in 2026, reflecting slower population growth and the effects of American trade policy.
3. Literature review
The economic literature on the Canada United States trade relationship is unusually rich, because the relationship has served as a natural laboratory for several of the most influential ideas in international economics.
The first strand concerns the effect of borders. McCallum (1995) showed, using data on trade between Canadian provinces and American states, that trade between two Canadian provinces was about twenty times larger than trade between a province and a state of similar size and distance. This “border puzzle” stimulated a large literature. Anderson and van Wincoop (2003) showed that a theoretically consistent gravity model, which accounts for “multilateral resistance”, reduces the estimated border effect considerably but does not eliminate it. Head and Mayer (2014) reviewed the subsequent literature on gravity equations and confirmed that distance and borders remain powerful determinants of trade. The implication for Canada is that its concentration on the American market is not an accident of policy but largely a consequence of geography and economic size, which gravity models predict well.
The second strand concerns the effects of free trade. Trefler (2004) analysed the effects of the Canada United States Free Trade Agreement on Canadian manufacturing and found that tariff cuts caused significant short-term job losses in import-competing industries, but raised labour productivity substantially in the industries most exposed to American competition. Caliendo and Parro (2015) estimated the trade and welfare effects of NAFTA in a multi-sector model with input-output linkages and showed that intermediate goods trade amplifies the effects of tariff changes.
The third strand concerns the effects of the new protectionism. Amiti, Redding and Weinstein (2019) and Fajgelbaum, Goldberg, Kennedy and Khandelwal (2020) analysed the American tariffs of 2018 and 2019 and found that their cost was borne almost entirely by American importers and consumers, with near complete pass-through of tariffs to import prices. This finding suggests that the direct effect of American tariffs on Canadian exporters’ prices may be limited, but that the volume effect, through reduced American demand for taxed goods, can be significant.
The fourth strand concerns diversification. A study by the Fraser Institute (2026) documented that the share of non-American destinations in Canadian merchandise exports rose from an average of 17.5 percent in 1999 to 2010 to 26.4 percent in 2011, then stabilised at an average of 24.2 percent between 2012 and 2024. The authors concluded that Canada’s dependence on the American market is “sticky” despite decades of diversification policies. They also documented that China’s share of non-American exports rose from 4.2 to 10.4 percent between the two periods, while Japan’s fell.
This article contributes to this literature by measuring the change in dependence through August 2026, by decomposing it into its components, and by quantifying the remaining exposure under several tariff scenarios.
4. Data and methodology
4.1 Data
The main data source is Statistics Canada’s table of international merchandise trade for all countries and by principal trading partners (table 12-10-0011), on a balance of payments basis, as reported in the monthly releases of The Daily and the monthly trade reports of the Office of the Chief Economist of Global Affairs Canada. The balance of payments basis adjusts customs data for coverage, valuation and timing, which makes it consistent with the national accounts. It differs slightly from the customs basis used in some other publications, which explains why figures for the same year can vary by a few percentage points between sources.
The article also uses:
- the tariff assumptions of the Bank of Canada’s Monetary Policy Report of July 2026, which provide average tariff rates between the two countries;
- the legal analyses of the Section 338 proclamations of July 2026 published by law firms;
- the Fraser Institute (2026) study for historical averages;
- the quarterly national accounts for nominal GDP.
4.2 Indicators
The author calculates:
1. The US share of merchandise exports, annually and on a rolling twelve-month basis. 2. A decomposition of the change in the share. The change between 2024 and 2025 is decomposed by calculating two counterfactual shares: the share in 2025 if exports to the United States had remained at their 2024 level (isolating the effect of growth in other markets), and the share if exports to other markets had remained at their 2024 level (isolating the effect of the fall in exports to the United States). 3. Exposure to the United States, measured as exports to the United States as a percentage of nominal GDP. 4. The average American tariff after Section 338. The value covered by the Section 338 duties (nearly 20 billion US dollars according to the Office of the United States Trade Representative, converted at 1.37 Canadian dollars per US dollar) is divided by the value of Canadian exports to the United States over the twelve months to July 2026 (571 billion Canadian dollars), then multiplied by the tariff rate of 50 percent. The result is added to the Bank of Canada’s estimate of the average tariff in July 2026. This is an upper bound, because some trade in the covered products will stop or be diverted. 5. A simulation of the GDP cost of tariffs. For a given average tariff τ and a trade elasticity σ, the long-run proportional fall in the volume of exports to the United States is approximated by 1 minus (1 + τ) to the power of minus σ. The value of lost exports is multiplied by an assumed share of domestic value added in exports of 70 percent, then reduced by 25 percent to reflect the redirection of part of the lost sales to other markets or to the domestic market. The result is expressed as a percentage of 2025 GDP. Two elasticities are used: 1.5 for the short run and 4 for the long run, consistent with the range found in the trade literature.
4.3 Limitations
The decomposition depends on the choice of base year and does not account for price effects, which were significant in 2025 because of the fall in energy prices and the rise in gold prices. The tariff calculation assumes that the covered value is the value before the tariff. The simulation is a partial equilibrium exercise that ignores exchange rate adjustments, general equilibrium effects, retaliation and policy responses. Its results should be interpreted as orders of magnitude, not forecasts. Nominal GDP for the first quarter of 2025 is estimated by the author.
5. Results
5.1 A historic fall in the American share
Figure 1 presents the share of Canadian merchandise exports sold to the United States.
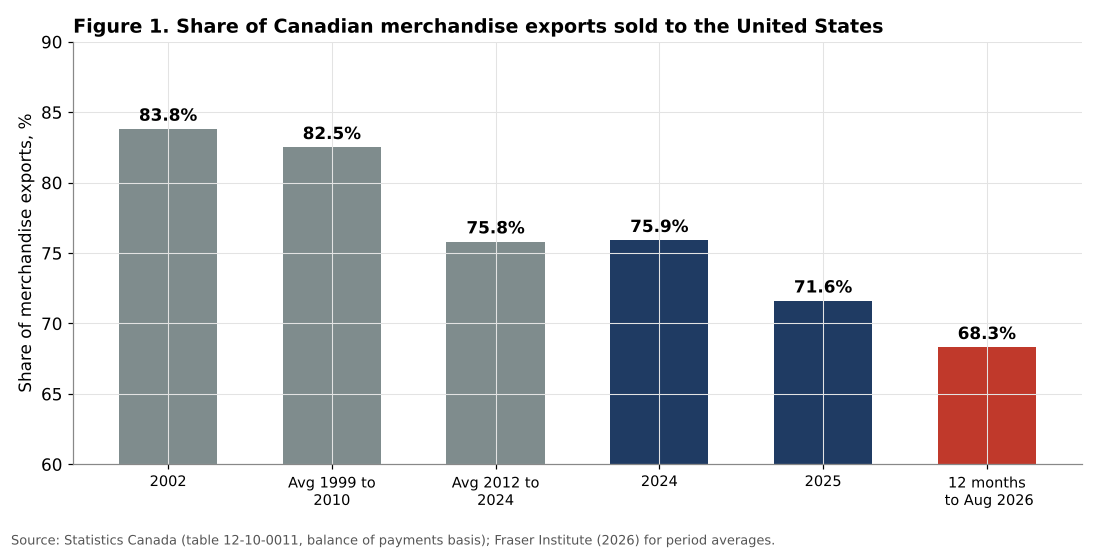
The US share reached its highest point in 2002, at 83.8 percent. It averaged 82.5 percent between 1999 and 2010, then fell to an average of 75.8 percent between 2012 and 2024, when the growth of Asian demand for Canadian commodities and the weakening of the American market after the 2008 crisis reduced the American weight. In 2024, the share was 75.9 percent, exactly in line with its average of the previous decade.
The break came in 2025. Exports to the United States fell by 5.8 percent, while exports to other countries rose by 17.2 percent. The American share fell to 71.6 percent, the lowest for any full calendar year in the modern series. The decline continued in 2026: over the twelve months to August 2026, the share was 68.3 percent, down 5.5 percentage points from 73.9 percent a year earlier. The largest annual fall recorded before 2025 had been about 4 percentage points, in 2007.
In other words, in less than two years, the American share has fallen by more than 7 percentage points, a decline comparable to the shift between the averages of the 2000s and the 2010s, which took about a decade.
5.2 Monthly dynamics: volatility around a lower level
Figure 2 shows monthly exports by destination for selected months between April 2025 and August 2026.
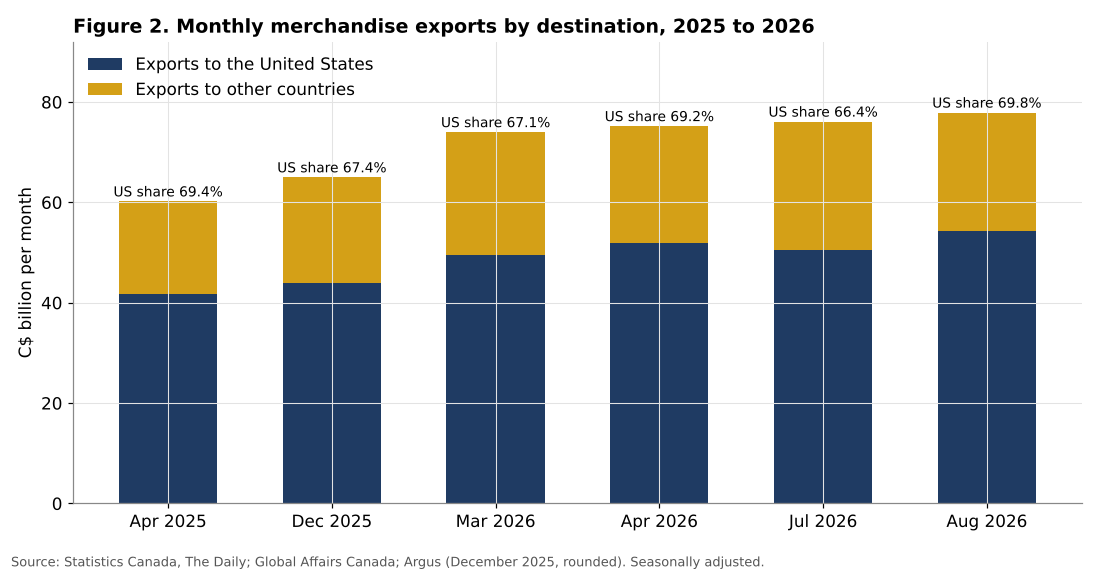
The monthly data show that the American share has fluctuated between about 66 and 70 percent since spring 2025, compared with around 76 percent before the conflict. The lowest values were recorded in March 2026 (67.1 percent) and July 2026 (66.4 percent). In December 2025, the share was 67.4 percent, compared with 76.2 percent in December 2024.
The level of exports to the United States has nevertheless recovered in 2026. In August 2026, Canada exported 54.3 billion dollars of goods to the United States, up 8.1 percent from July, and the bilateral surplus reached 11.2 billion dollars, the largest monthly increase on record. Part of this increase reflected American importers buying ahead of the Section 338 duties. Over the first eight months of 2026, exports to the United States were 7.6 percent higher than a year earlier, while total exports rose by 15.1 percent.
This pattern is important: the decline in the American share in 2026 does not come from a collapse of exports to the United States, which are growing again, but from the even faster growth of exports to other markets.
5.3 Decomposing the fall in the share
To identify the drivers of the change, the author decomposes the fall of the American share between 2024 and 2025.
| Measure | 2024 | 2025 | Change |
|---|---|---|---|
| Exports to the United States (C$ bn) | 590.0 | 555.4 | -5.9% |
| Exports to other countries (C$ bn) | 187.6 | 220.4 | +17.5% |
| US share of exports (%) | 75.9 | 71.6 | -4.3 points |
| Share if exports to the US had not changed (%) | 72.8 | -3.1 points | |
| Share if exports to other countries had not changed (%) | 74.7 | -1.2 points |
Table 1. Decomposition of the change in the US share of exports. Source: Statistics Canada; calculations by the author. Small differences from official growth rates reflect revisions.
If exports to the United States had remained at their 2024 level, the growth of exports to other markets alone would have reduced the American share to 72.8 percent, a fall of 3.1 points. If exports to other markets had remained at their 2024 level, the fall in exports to the United States alone would have reduced the share to 74.7 percent, a fall of only 1.2 points. In other words, about three quarters of the decline in the share in 2025 is explained by the growth of other markets, and only about a quarter by the fall of exports to the United States.
This result is essential for interpreting the diversification. The fall of the American share is mainly a story of new sales elsewhere, not of lost sales in the United States. And these new sales were highly concentrated. Statistics Canada reported that exports of unwrought gold, silver and platinum group metals rose by 41.7 percent in 2025, largely because of unwrought gold, much of it shipped to the United Kingdom as gold prices reached record highs. Excluding this product group, total Canadian exports fell by 3.0 percent in 2025 instead of 0.2 percent. A large part of the apparent diversification is therefore the result of a gold price boom and of the role of London as a centre of the global gold market, rather than of a structural change in Canada’s commercial relationships.
5.4 Tariffs: lower than the headlines, but rising again
Figure 3 shows the average tariff rates between the two countries estimated by the Bank of Canada, with the author’s estimate for October 2026.
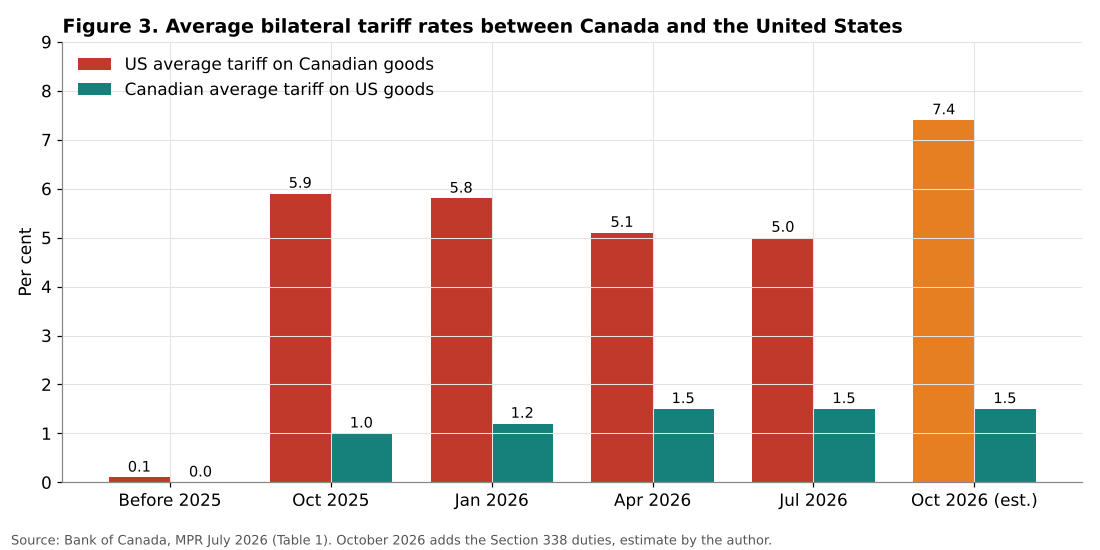
Before 2025, the average American tariff on Canadian goods was 0.1 percent: trade was practically free. It rose to 5.9 percent in October 2025, at the height of the IEEPA and Section 232 measures, then declined slightly to 5.8 percent in January 2026, 5.1 percent in April after the Supreme Court decision and 5.0 percent in July 2026. Canadian tariffs on American goods, net of remissions, rose from zero to about 1.5 percent.
These averages are much lower than the headline rates of 25, 35 or 50 percent, for two reasons. First, the large majority of Canadian exports to the United States qualify under CUSMA and were exempt from the IEEPA tariffs and the Section 122 surcharge. Second, energy, which represents a large share of exports, faced lower rates or no tariff.
The Section 338 duties change this picture. By the author’s calculation, the covered value of nearly 20 billion US dollars represents about 27 billion Canadian dollars, or about 4.8 percent of Canadian exports to the United States over the past year. A duty of 50 percent on this value adds about 2.4 percentage points to the average tariff, which would rise to about 7.4 percent, the highest level since the beginning of the conflict. This figure is an upper bound, because part of the trade in these products will stop. But it shows that the trend of declining average tariffs observed in the first half of 2026 has been reversed.
Moreover, the average hides an extreme concentration. For the steel, aluminium and copper industries, the tariff is 50 percent. For motor vehicles, it applies to the non-American content. For the products on the Section 338 lists, it is 50 percent without CUSMA exemption. For most other goods, it is zero. The burden is borne by a limited number of industries and regions, notably the automotive sector of Ontario, aluminium producers in Quebec and British Columbia, and the steel industry.
5.5 The bilateral balances
Figure 4 compares Canada’s merchandise trade balances with the United States and with other countries.
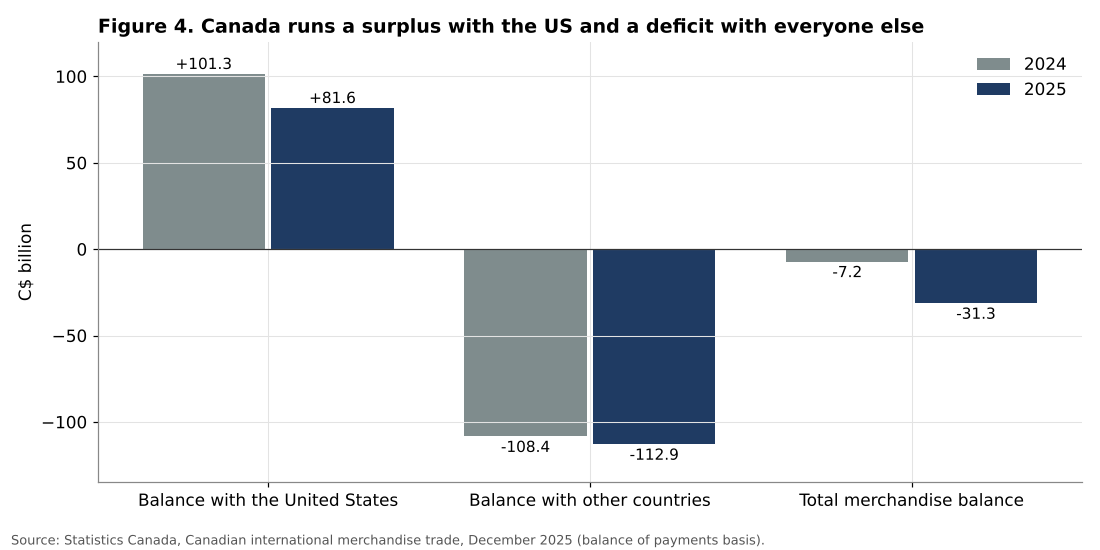
Canada has a large and persistent surplus with the United States and a large deficit with the rest of the world. In 2024, the surplus with the United States was 101.3 billion dollars and the deficit with other countries was 108.4 billion. In 2025, the surplus with the United States fell to 81.6 billion, while the deficit with other countries widened to 112.9 billion. The total merchandise deficit rose from 7.2 billion to 31.3 billion dollars, the largest since 2020.
This structure illustrates the nature of Canadian dependence. The United States is not only Canada’s main customer but also its main source of net foreign income from merchandise trade. Canada buys more than it sells from Asia and Europe, and the surplus with the United States finances this deficit. Diversification of exports, if it were not accompanied by a change in the structure of imports, would not eliminate this asymmetry.
The share of imports coming from the United States also fell, from 62.3 percent in 2024 to 58.8 percent in 2025, as Canadian consumers and businesses reduced their purchases of American goods, partly in response to the retaliatory tariffs and to consumer boycotts, and imports from other countries rose by 12.4 percent.
5.6 Which markets and which products?
Figure 5 shows the growth of exports by market and by product in the first eight months of 2026.
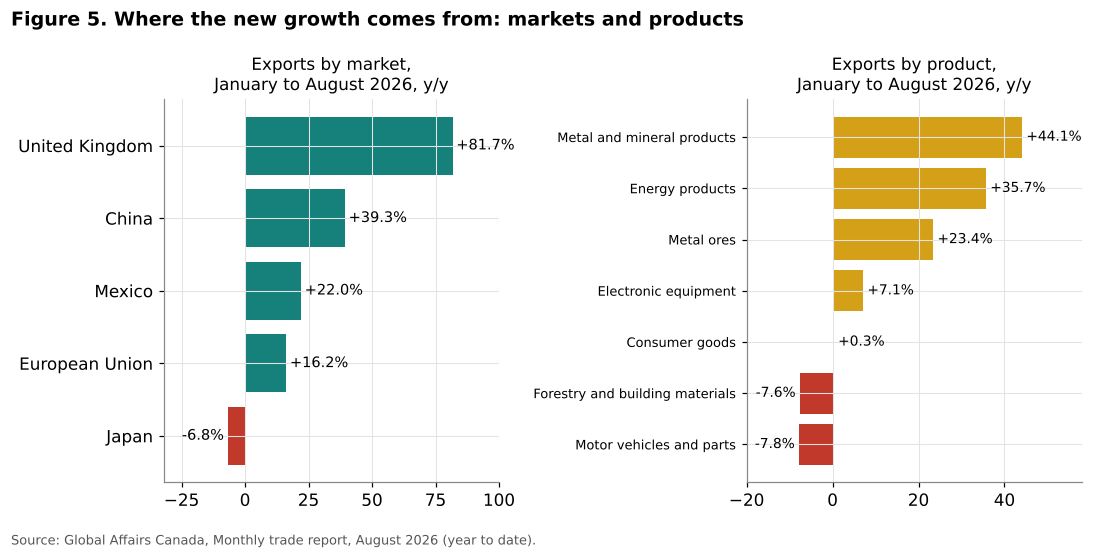
Among non-American markets, the strongest growth was recorded by the United Kingdom (+81.7 percent), reflecting gold shipments, followed by China (+39.3 percent), Mexico (+22.0 percent) and the European Union (+16.2 percent). Exports to Japan fell by 6.8 percent.
By product, the strongest growth came from metal and non-metallic mineral products (+44.1 percent), which include gold, energy products (+35.7 percent), and metal ores (+23.4 percent). Exports of motor vehicles and parts fell by 7.8 percent and forestry products and building materials by 7.6 percent, the two sectors most affected by American sector-specific tariffs.
The pattern is clear: diversification is driven by commodities that can easily be redirected to world markets, such as gold, oil and ores, which are priced globally and can be shipped to any buyer. Manufactured goods, which are embedded in North American supply chains, have not found alternative markets. They have simply lost sales. Energy is a particular case: the expanded Trans Mountain pipeline, which opened in May 2024, has allowed Canadian crude oil to reach Asian markets from the Pacific coast for the first time on a large scale, which contributes to the growth of non-American energy exports.
5.7 The remaining exposure
Despite the decline in the share, Canada’s exposure to the American market remains very high. In 2025, exports of goods to the United States represented about 555 billion dollars, or about 17.1 percent of Canadian nominal GDP, estimated by the author at about 3.24 trillion dollars. Including services, the exposure is even greater. No other G7 country depends on a single foreign market to this extent. For comparison, exports of goods to the United States represent roughly 3 to 4 percent of GDP for Germany and Japan, while Mexico, the only large economy that is even more dependent, sells goods worth more than a quarter of its GDP to its northern neighbour.
This means that any significant change in the conditions of access to the American market has macroeconomic consequences for Canada. A fall of 10 percent in exports to the United States would directly reduce demand by about 1.7 percent of GDP before any offsetting effects.
5.8 Simulating the cost of tariffs
Figure 6 presents the author’s simulation of the GDP cost of three tariff scenarios.
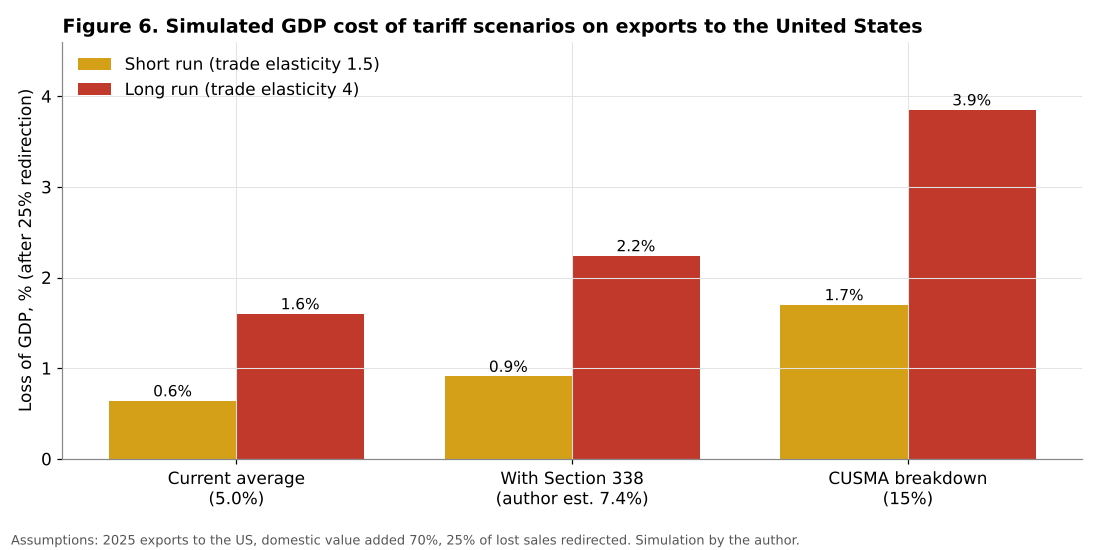
The simulation applies an average tariff to the 2025 value of exports to the United States and estimates the resulting fall in exports using two trade elasticities. The results, after accounting for domestic value added and a partial redirection of sales, are as follows:
| Scenario | Average tariff | Short run (σ = 1.5) | Long run (σ = 4) |
|---|---|---|---|
| Current average | 5.0% | 0.6% of GDP | 1.6% of GDP |
| With Section 338 duties | 7.4% | 0.9% of GDP | 2.2% of GDP |
| Breakdown of CUSMA | 15% | 1.7% of GDP | 3.9% of GDP |
Table 2. Simulated loss of GDP. Source: calculations by the author.
At the current average tariff of 5 percent, the simulated short-run cost is about 0.6 percent of GDP, rising to about 1.6 percent in the long run, when supply chains have had time to adjust. With the Section 338 duties, the cost rises to about 0.9 percent in the short run and 2.2 percent in the long run. In a scenario in which CUSMA ceased to apply and Canadian goods faced an average tariff of about 15 percent, the cost would be about 1.7 percent of GDP in the short run and nearly 4 percent in the long run.
These estimates should be interpreted with caution. They ignore the depreciation of the Canadian dollar, which partly offsets tariffs, the responses of fiscal and monetary policy, and the possibility that American importers absorb part of the tariffs. On the other hand, they also ignore the effects of uncertainty on investment, which the Bank of Canada considers significant, and the costs of adjustment for workers and firms. The order of magnitude is consistent with other estimates: Deloitte estimated in September 2026 that an American withdrawal from CUSMA would reduce Canadian real GDP by 1.6 percent relative to its baseline.
6. Discussion
6.1 A real but narrow diversification
The data show that Canada’s export dependence on the United States has fallen significantly since 2025. The American share of merchandise exports has fallen to its lowest level in the modern series, and exports to the United Kingdom, China, Mexico and the European Union have grown strongly. This is a real change.
But the decomposition shows that the change is narrow. It is driven mainly by the growth of commodity exports to other markets, notably gold, and much less by a reorientation of manufacturing. The Fraser Institute’s observation that Canadian dependence is “sticky” remains valid: the structural factors that bind Canada to the United States, geography, integrated supply chains, infrastructure oriented north south, and regulatory compatibility, have not changed.
Part of the diversification could reverse quickly. If gold prices fell, exports to the United Kingdom would fall with them. If the American tariffs were lifted after an agreement in the CUSMA review, exports to the United States would recover, and the American share would rise again. The experience after 2011, when the American share stabilised after an initial decline, suggests that diversification tends to stall once the immediate shock fades.
6.2 Why manufacturing cannot easily diversify
The contrast between commodities and manufactured goods is not surprising in light of the literature. Commodities are homogeneous goods sold on world markets at world prices. A Canadian gold producer can sell to London instead of New York with little cost. Manufactured goods, by contrast, are often differentiated, produced to the specifications of particular customers, and embedded in supply chains in which parts cross the border several times. A Canadian auto parts producer whose customer is an assembly plant in Michigan cannot simply redirect its production to Germany or Japan.
Moreover, distance matters. Gravity models consistently show that trade falls sharply with distance. Europe and Asia are thousands of kilometres away, while the main American markets are a few hours by truck. The transport costs, delivery times and regulatory differences that come with distance make it difficult for most Canadian manufacturers to compete in distant markets.
6.3 The role of infrastructure
The Trans Mountain example shows that infrastructure can change the geography of trade. Before 2024, Canadian crude oil had practically no outlet other than the United States, which allowed American refiners to buy it at a significant discount to world prices. The expansion of the pipeline to the Pacific coast has given Canadian producers access to Asian buyers and has narrowed this discount. Similar arguments are made for liquefied natural gas terminals on the Pacific coast, port capacity, rail links and interprovincial transmission lines. Diversification of trade is, to a large extent, a question of physical infrastructure, and the next article in this series on export diversification examines this question in more detail.
6.4 The asymmetry of power
The trade conflict has also revealed the asymmetry of the relationship. Exports to the United States represent about 17 percent of Canadian GDP, while imports from Canada represent about 1.5 percent of American GDP. This asymmetry gives the United States considerable leverage in negotiations, as the use of Section 338 illustrates. Canada’s retaliation, while politically important, has a limited effect on the American economy and risks raising prices for Canadian consumers and businesses.
The legal dimension is also important. The Supreme Court decision of February 2026 showed that American tariff powers are subject to legal limits. But it also led the administration to use other legal instruments, including Section 232, Section 122 and Section 338, which are more difficult to challenge. Canadian exporters face a legal environment that is more uncertain than at any time since the 1980s.
6.5 Policy options
Canadian policy faces a choice between three broad strategies, which are not mutually exclusive.
The first is to negotiate the best possible terms with the United States in the CUSMA review, accepting some concessions on the issues raised by the American side, such as dairy supply management, digital taxation or provincial alcohol policies, in exchange for the removal of tariffs. This strategy recognises that the American market will remain dominant for the foreseeable future.
The second is to accelerate diversification by using existing trade agreements more intensively, notably the Comprehensive Economic and Trade Agreement with the European Union and the Comprehensive and Progressive Agreement for Trans-Pacific Partnership, and by investing in infrastructure that opens access to other markets. This strategy reduces vulnerability in the long run but cannot replace the American market in the short run.
The third is to strengthen the domestic market by removing internal trade barriers between provinces, which several studies have identified as significant. The Canadian Free Trade Agreement has reduced some of these barriers, and the federal and provincial governments have made new commitments since 2025. A more integrated domestic market would give Canadian firms a larger home base.
The evidence in this article suggests that the first strategy is unavoidable in the short run, given the scale of the exposure, and that the second and third strategies are necessary in the long run, given the demonstrated risks of dependence.
7. Scenarios to 2030
7.1 Three scenarios
Scenario A: Negotiated stabilisation. The CUSMA review leads to an agreement in 2027 that removes most of the Section 338 duties and reduces some Section 232 tariffs, in exchange for Canadian concessions. The average American tariff falls back to about 2 to 3 percent. Exports to the United States recover, and the American share of exports rises again to about 72 to 74 percent by 2030. The simulated long-run GDP cost falls below 1 percent. Diversification stalls, as it did after 2011.
Scenario B: Managed conflict. The current situation persists, with periodic escalation and partial de-escalation. The average American tariff remains between 5 and 8 percent. The American share of exports stabilises around 68 to 70 percent, supported by the growth of commodity exports to other markets and the gradual development of new infrastructure. The long-run GDP cost is about 1.5 to 2.5 percent.
Scenario C: Rupture. The CUSMA review fails, and the United States announces its withdrawal from the agreement or imposes generalised tariffs. The average tariff rises to around 15 percent. Exports to the United States fall sharply, and the American share falls toward 60 to 65 percent, not because of strong diversification but because of the collapse of American sales. The long-run GDP cost could reach 3 to 4 percent, with severe regional effects in Ontario and Quebec.
7.2 Assessment
Based on the evidence of 2025 and 2026, the author considers scenario B to be the most likely central case, with significant risks on both sides. The trend in the American share over the past two years shows that diversification is possible, but the decomposition shows that it is driven by a few commodities. The Section 338 measures show that the American administration is willing to escalate, but the exemption of energy and critical minerals shows that it recognises its own dependence on certain Canadian products.
7.3 Indicators to monitor
The author suggests monitoring five indicators:
1. The US share of exports on a rolling twelve-month basis, published monthly by Statistics Canada. 2. The share of exports to non-American markets excluding unwrought gold, which would show whether diversification extends beyond precious metals. 3. The average American tariff estimated by the Bank of Canada in each Monetary Policy Report. 4. Exports of motor vehicles and parts, the best indicator of the health of integrated supply chains. 5. The progress of the CUSMA joint review and any decision by the parties on the extension of the agreement.
8. Conclusion
This article has measured the change in Canada’s export dependence on the United States during the trade conflict of 2025 and 2026. Its main conclusions are:
1. The US share of Canadian merchandise exports fell from 75.9 percent in 2024 to 71.6 percent in 2025 and 68.3 percent over the twelve months to August 2026, the lowest in the modern series and the fastest decline on record. 2. About three quarters of the fall in the share in 2025 came from the growth of exports to other markets, largely driven by gold and energy, and only about a quarter from the decline of exports to the United States. 3. The average American tariff on Canadian goods rose from 0.1 percent before 2025 to about 5 percent, and the Section 338 duties could raise it to about 7.4 percent by the author’s estimate, with an extreme concentration on a few industries. 4. Canada maintains a large surplus with the United States and a large deficit with the rest of the world, which illustrates the depth of the asymmetry. 5. Exports to the United States still represent about 17 percent of GDP, and the simulated long-run cost of current tariffs is about 1.6 to 2.2 percent of GDP, rising to nearly 4 percent if CUSMA broke down.
Canada has begun to diversify its trade, but this diversification is real only for goods that can easily find buyers on world markets. For the manufacturing industries that are the heart of the North American economic integration, there is no short-term alternative to the American market. The future of Canada’s dependence will therefore be decided less by market forces than by the outcome of the negotiations of 2026 and 2027, and by the willingness of Canadian governments to invest for decades in the infrastructure and institutions that diversification requires.
Need this analysis for your organisation?
We prepare confidential briefings, executive talks and studies on countries, markets and policies, built on the same method as this article.
Request a briefingSupport independent analysis
Our studies are free to read and carry no advertising. If this one was useful, a small contribution helps us publish the next.
Support our workGo further: books by Global Strategy Files


Frequently asked questions
How dependent is Canada on exports to the United States?
Still very dependent. The US share of Canadian merchandise exports fell from 75.9 percent in 2024 to 68.3 percent over the twelve months to August 2026, the lowest in the modern series, but exports to the United States still equal about 17 percent of Canadian GDP.
Why has the US share of Canadian exports fallen?
Mainly because exports to other markets grew. About three quarters of the decline in the US share in 2025 came from the growth of exports elsewhere rather than a fall in exports to the United States, and much of it was concentrated in unwrought gold and energy.
What tariffs does the US apply to Canadian goods in 2026?
After the Section 338 duties of August 2026, the estimated average American tariff on Canadian goods rose from 5.0 percent to about 7.4 percent, according to the author’s calculation based on trade weights and the legal texts of the US measures.
How much could US tariffs cost the Canadian economy?
The simulated cost of current tariffs is moderate in the short run, between 0.6 and 0.9 percent of Canadian GDP, but it could reach 2 to 4 percent in the long run if the North American trade agreement were to break down.
Methodological note
All calculations in this article were carried out by the author using data from Statistics Canada (table 12-10-0011, balance of payments basis, as reported in The Daily and in the monthly reports of Global Affairs Canada), the Bank of Canada Monetary Policy Report of July 2026 and the Fraser Institute (2026). The 2025 decomposition uses annual values as available in summer 2026. The average tariff after Section 338 uses the coverage of nearly 20 billion US dollars estimated by the Office of the United States Trade Representative, an exchange rate of 1.37 and exports to the United States over the twelve months to July 2026. The GDP simulation uses the formula described in Section 4 with elasticities of 1.5 and 4, a domestic value added share of 70 percent and a redirection rate of 25 percent; these parameters are assumptions. Nominal GDP for 2025 is the sum of quarterly values, with the first quarter estimated by the author. The scenarios are illustrative.
References
Amiti, M., Redding, S. J. and Weinstein, D. E. (2019). The Impact of the 2018 Tariffs on Prices and Welfare. Journal of Economic Perspectives, 33(4), 187 to 210.
Anderson, J. E. and van Wincoop, E. (2003). Gravity with Gravitas: A Solution to the Border Puzzle. American Economic Review, 93(1), 170 to 192.
Bank of Canada (2026). Monetary Policy Report, July 2026, including Tariff and Other Assumptions. Ottawa.
Caliendo, L. and Parro, F. (2015). Estimates of the Trade and Welfare Effects of NAFTA. Review of Economic Studies, 82(1), 1 to 44.
Fajgelbaum, P. D., Goldberg, P. K., Kennedy, P. J. and Khandelwal, A. K. (2020). The Return to Protectionism. Quarterly Journal of Economics, 135(1), 1 to 55.
Fraser Institute (2026). Assessing Canada’s Trade Dependence on the United States, 1999 to 2024. Vancouver.
Global Affairs Canada, Office of the Chief Economist (2026). Monthly Trade Report: August 2026. Ottawa.
Head, K. and Mayer, T. (2014). Gravity Equations: Workhorse, Toolkit, and Cookbook. In G. Gopinath, E. Helpman and K. Rogoff (eds.), Handbook of International Economics, Vol. 4, 131 to 195. Elsevier.
Holland and Knight (2026). 50 Percent Opening Bid: Canadian Imports Subject to Section 338 Tariffs Amid USMCA Talks. July 2026.
McCallum, J. (1995). National Borders Matter: Canada-U.S. Regional Trade Patterns. American Economic Review, 85(3), 615 to 623.
Statistics Canada (2026). Canadian International Merchandise Trade, December 2025. The Daily, 19 February 2026.
Statistics Canada (2026). Canadian International Merchandise Trade, April 2026 and August 2026. The Daily.
Statistics Canada (2026). Table 12-10-0011-01, International merchandise trade for all countries and by principal trading partners, monthly. Ottawa.
Supreme Court of the United States (2026). Learning Resources, Inc. v. Trump. Decided 20 February 2026.
Trefler, D. (2004). The Long and Short of the Canada-U.S. Free Trade Agreement. American Economic Review, 94(4), 870 to 895.
