
Canada’s Housing Market in 2026: Falling Rents, Stalled Construction and the Arithmetic of the Supply Gap

Canada’s Housing Market in 2026: Falling Rents, Stalled Construction and the Arithmetic of the Supply Gap
Driss EFFINA, PhD Independent Researcher, Global Strategy Files Reading time: about 26 minutes
Key takeaways
- Canadian housing starts reached 259,028 units in 2025, about 60 percent of the 430,000 a year CMHC says are needed to restore affordability.
- Population growth fell from 2.8 percent in 2023 to 2024 to 0.5 percent in 2025 to 2026, reversing the balance between new homes and new households.
- Mortgage payments still absorb 51.1 percent of median household income, against a long-run average of about 41 percent.
- Restoring average affordability would need a price fall of about 20 percent, or about eight years of 3 percent income growth with flat prices.
Abstract
Canada entered the 2020s with one of the least affordable housing markets among advanced economies. By the autumn of 2026, the situation has changed in a way few observers predicted: asking rents have fallen for two consecutive years, home prices are declining, and mortgage affordability has improved for ten consecutive quarters. Yet housing construction has not accelerated, and the official estimates of the long-term supply gap remain very large. This article examines this apparent paradox with data from the Canada Mortgage and Housing Corporation (CMHC), Statistics Canada, the Canadian Real Estate Association (CREA), the Parliamentary Budget Officer (PBO), the National Bank of Canada and the Rentals.ca national rent report, and adds the author’s own calculations. Five results stand out. First, housing starts reached 259,028 units in 2025 and are running at a trend of about 250,000 in 2026, roughly 60 percent of the 430,000 units per year that CMHC estimates are needed to restore 2019 affordability. Second, the collapse of population growth, from 2.8 percent in 2023 to 2024 to 0.5 percent in 2025 to 2026, has reversed the balance between the flow of new homes and the flow of new households: housing starts now exceed the households implied by population growth by a factor of more than three, against a factor of one half two years earlier. Third, mortgage payments still absorb 51.1 percent of median household income, against a long-run average of about 41 percent; a return to that average would require a fall of about 20 percent in prices at constant rates and incomes, or about eight years of income growth at 3 percent with flat prices. Fourth, the construction slowdown is highly concentrated in Toronto and Montreal, while Calgary and Vancouver continue to build at a strong pace. Fifth, the two official estimates of housing need, from CMHC and from the PBO, differ by a factor of two because they answer different questions. The article concludes that Canada has gained a temporary respite in the flow of housing demand, but that the stock deficit accumulated over a decade has not been corrected, and that current construction levels are insufficient to correct it if population growth resumes.
Keywords: Canada, housing, affordability, housing starts, rents, immigration, population growth, supply gap, CMHC, mortgages
JEL codes: R21, R31, R38, J11, E43
1. Introduction
Housing has become one of the defining economic and political issues in Canada. Between 2015 and 2022, average home prices rose much faster than incomes, and in the largest metropolitan areas, Toronto and Vancouver, the purchase of a typical home became inaccessible to households with median incomes. Rents followed with a delay, rising sharply in 2022 and 2023 as interest rates increased, ownership became even less affordable, and the population grew at its fastest pace since the 1950s.
The policy response has been significant. Federal, provincial and municipal governments have launched programmes to accelerate construction, including the Housing Accelerator Fund in 2023, the removal of the goods and services tax on new purpose-built rental housing, the elimination of that tax for first-time buyers of new homes, and the creation of Build Canada Homes in 2025, a federal entity intended to accelerate the construction of affordable housing. At the same time, the federal government reduced immigration targets, notably for temporary residents, which had grown very rapidly.
By 2026, the market has changed direction. Rents are falling, prices are declining, sales are weak and affordability has improved. This raises an important question: has the housing crisis ended, or has it only paused? To answer it, it is necessary to distinguish between the flow of new demand, which depends largely on population growth, and the stock of housing relative to the population, which reflects the accumulated deficit of past years. This article measures both.
Section 2 presents the context. Section 3 reviews the literature on housing supply. Section 4 describes the data and methodology. Section 5 presents the results. Section 6 discusses them. Section 7 presents scenarios to 2035. Section 8 concludes.
2. Context
2.1 The accumulation of the deficit
Canada has historically built about 200,000 housing units per year. Between 2015 and 2020, housing starts averaged about 209,000 units per year, according to CMHC. During the same period, the population grew by about 1.2 to 1.5 percent per year, mainly through immigration. The construction of new housing was broadly sufficient to accommodate population growth on a national basis, but not in the largest cities, where most immigrants settle and where land use regulations limit new construction.
The situation changed dramatically after 2021. Housing starts rose to a record 271,198 units in 2021, stimulated by very low interest rates. But the population grew even faster. The number of non-permanent residents, including international students, temporary foreign workers and asylum claimants, increased very rapidly, and annual population growth reached a peak of 2.8 percent between July 2023 and July 2024, according to the latest revised estimates of Statistics Canada. In absolute terms, the population increased by more than one million people in a single year, while about 240,000 homes were started.
2.2 Interest rates and affordability
The Bank of Canada raised its policy rate from 0.25 percent in early 2022 to 5 percent in July 2023, in response to inflation. Mortgage rates rose correspondingly. Since most Canadian mortgages have fixed terms of five years or less, the increase in rates was gradually transmitted to existing borrowers as their mortgages came up for renewal. The National Bank of Canada’s affordability index shows that mortgage payments on a representative home reached 62.5 percent of median household income at the end of 2023, the worst level since the series began.
From June 2024, the Bank of Canada lowered its policy rate, reaching 2.25 percent in 2025, where it has remained through 2026 as the economy weakened under the effect of American tariffs.
2.3 The immigration correction
In 2024 and 2025, the federal government significantly reduced its immigration targets. The Immigration Levels Plan for 2026 to 2028, announced in November 2025, set a target of 380,000 new permanent residents in 2026 and reduced the targets for new temporary residents, with the objective of bringing the share of temporary residents below 5 percent of the population by the end of 2027. The effect on population growth has been very rapid. According to Statistics Canada, the population on 1 July 2026 was 41,798,407, an increase of only 189,425 people (0.5 percent) over a year. The number of non-permanent residents fell by 154,614 to 2,779,774, or 6.7 percent of the population. The second quarter of 2026 recorded the lowest growth for that quarter since 2020.
2.4 The market in 2026
The combination of slower population growth, a weaker economy and continued affordability constraints has produced a soft market. According to CREA, home sales in September 2026 were 7.7 percent lower than a year earlier, the MLS Home Price Index was 3.4 percent lower, and the national average price was 666,538 dollars, down 1.6 percent. CREA lowered its forecast for 2026 sales for the third time in the year, to a decline of 5.2 percent. Average asking rents, according to Rentals.ca and Urbanation, were 2,034 dollars in September 2026, down 4.2 percent from a year earlier and the twenty-fourth consecutive month of annual decline.
3. Literature review
The economic literature on housing provides several insights relevant to the Canadian case.
The first concerns the role of supply constraints. Glaeser and Gyourko (2018) argue that in the United States, high housing prices in the most productive cities are mainly due to land use regulations that restrict new construction, rather than to the cost of construction itself. Saiz (2010) shows that geographical constraints, such as water bodies and steep terrain, combined with regulatory constraints, explain much of the variation in housing supply elasticity across American cities. Hsieh and Moretti (2019) estimate that housing constraints in high-productivity cities reduce aggregate economic growth by preventing workers from moving to where they are most productive. These findings apply directly to Toronto and Vancouver, which combine geographical limits with restrictive zoning.
The second concerns the link between supply and affordability. Been, Ellen and O’Regan (2019) review the evidence on “supply skepticism”, the view that new market-rate construction does not improve affordability, and conclude that new supply does reduce rents and prices in the surrounding area, even when it is at the high end of the market, through filtering and reduced competition for existing units.
The third concerns the measurement of housing need. There are two broad approaches. The first, based on demographics, estimates the number of new households expected to form and compares it with the expected growth of the housing stock. The second, based on affordability, estimates the number of units required to bring prices and rents back to a target level of affordability, which requires assumptions about the elasticity of prices to supply. CMHC (2022, 2025) uses the second approach, while the PBO (2025) uses the first. As shown below, the two approaches give very different answers.
The fourth concerns the role of population growth. Several studies by Canadian banks and by the Bank of Canada have noted that the surge in temporary residents in 2022 to 2024 added significantly to rental demand, particularly in large cities, and that its reversal would reduce pressure on rents. The present data confirm this prediction.
This article contributes by quantifying the change in the balance between housing construction and population growth, by calculating the adjustments needed to restore historical affordability, and by comparing the two official estimates of need in a common framework.
4. Data and methodology
4.1 Data
- Housing starts: CMHC annual data for 2015 to 2025 and monthly data for September 2026, including the seasonally adjusted annual rate, the six-month trend and city-level data.
- Population: Statistics Canada quarterly population estimates, including the estimate for 1 July 2026 and the annual growth rates for 2023 to 2024 and 2024 to 2025.
- Prices and sales: CREA monthly data for September 2026 and forecasts.
- Affordability: National Bank of Canada Housing Affordability Monitor, second quarter of 2026.
- Rents: Rentals.ca and Urbanation National Rent Report, September 2026.
- Housing need: CMHC housing supply gap update (2025) and PBO report on household formation and the housing gap in 2035 (2025).
4.2 Indicators
The author calculates:
1. The ratio of housing starts to estimated need, comparing actual starts with the CMHC estimate of 430,000 to 480,000 units per year and with the PBO estimate of 290,000 net completions per year. 2. Housing starts per household implied by population growth. Population growth between 1 July of consecutive years is converted into an equivalent number of households by dividing by an average household size of 2.4 persons, an assumption close to the census average. Housing starts in the calendar year are divided by this number. A ratio above 1 means that more homes are being started than the number of households implied by population growth; a ratio below 1 means the opposite. Absolute population growth for 2023 to 2024 and 2024 to 2025 is calculated from the published growth rates and the July 2026 population, and is therefore an approximation. 3. The adjustment needed to restore historical affordability. Using the National Bank’s ratio of mortgage payments to median household income (51.1 percent in the second quarter of 2026) and its long-run average since 2000 (about 40.7 percent, derived from the National Bank’s statement that the current ratio is 10.4 points above that average), the author calculates the fall in prices needed to return to the average at constant interest rates and incomes, and the number of years needed under different combinations of income growth and price change. 4. Cumulative construction scenarios to 2035.
4.3 Limitations
The household equivalent conversion assumes a constant household size, while household size varies with age structure and with the composition of immigration; in particular, many temporary residents live in shared accommodation. Housing starts are a measure of construction activity, not of completions, and there is a lag of two to four years between starts and completions for apartment buildings. The affordability ratio applies to a representative home and does not capture the diversity of situations across regions. The scenarios are illustrative.
5. Results
5.1 Construction remains far below the estimated need
Figure 1 shows annual housing starts from 2015 to 2025 and the six-month trend in September 2026, compared with two estimates of need.
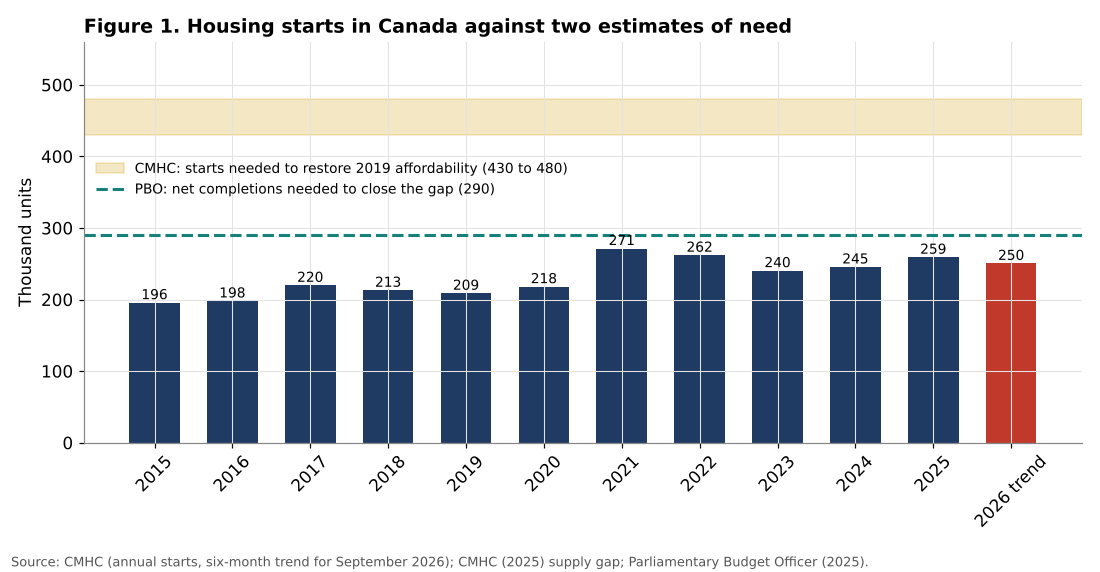
Housing starts were 245,367 units in 2024 and 259,028 in 2025, an increase of 5.6 percent. In September 2026, the seasonally adjusted annual rate was 248,896 units and the six-month trend was 250,411 units. In urban centres, actual starts in the first nine months of 2026 were 4 percent lower than in the same period of 2025.
These levels are high by historical standards. Starts in 2021 to 2025 averaged about 255,000 units per year, more than 20 percent above the average of 2015 to 2020. Rental housing now represents just over half of all starts in urban centres, a record share, reflecting the federal incentives for purpose-built rental construction.
But they are far below the level that CMHC estimates is needed. CMHC calculates that between 430,000 and 480,000 units would need to be started each year over the next decade to bring affordability back to its 2019 level. Starts in 2025 represented about 60 percent of the lower bound of this range, a gap of about 171,000 units per year. CMHC estimates that, under current conditions, starts will average about 245,000 units per year over the next decade.
The PBO estimate is lower. The PBO calculates that about 290,000 net completions per year on average would be needed over 2025 to 2035 to close the housing gap, defined as the difference between the number of households that would form if housing were available and the housing stock. Even this lower target is above current construction.
5.2 The reversal of the demand shock
Figure 2 compares population growth with housing starts.
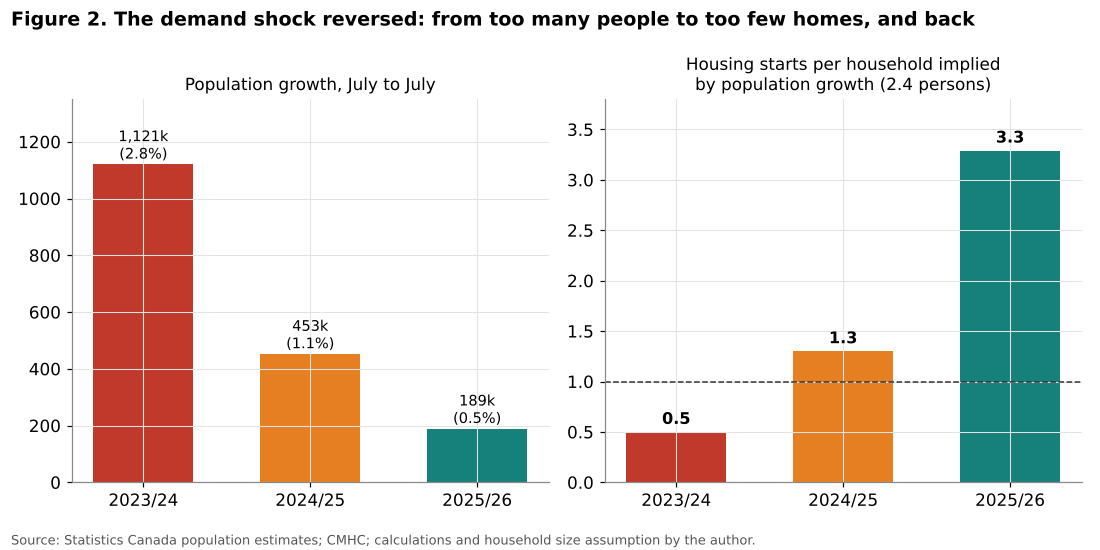
The change in population growth is dramatic. Between July 2023 and July 2024, the population grew by about 2.8 percent, or about 1.12 million people. Between July 2024 and July 2025, growth fell to 1.1 percent, about 453,000 people. Between July 2025 and July 2026, it fell to 0.5 percent, or 189,425 people.
Converting this growth into households, the author obtains the following ratios of housing starts to implied new households:
| Period | Population growth | Implied households (2.4 persons) | Housing starts | Starts per implied household |
|---|---|---|---|---|
| 2023 to 2024 | about 1,121,000 | about 467,000 | 240,267 | 0.5 |
| 2024 to 2025 | about 453,000 | about 189,000 | 245,367 | 1.3 |
| 2025 to 2026 | 189,425 | about 79,000 | 259,028 | 3.3 |
Table 1. Housing starts and population growth. Source: Statistics Canada, CMHC; calculations by the author.
In 2023 to 2024, Canada started about one home for every two households implied by population growth. In 2025 to 2026, it started more than three homes for every implied new household. In two years, the flow balance between housing supply and demographic demand has been completely reversed.
This reversal explains the main developments of 2025 and 2026. When the population was growing by more than a million people a year, rental vacancy rates were at historic lows and rents rose rapidly. Now that the population is growing by less than 200,000 a year, while construction continues at about 250,000 units, new supply exceeds new demand, vacancy rates rise and rents fall. The decline in the number of international students, concentrated among young adults aged 20 to 29, has had a particularly strong effect on rental demand in large cities and university towns.
It is important to understand what this does and does not mean. It means that the flow of new homes now exceeds the flow of new households, so the deficit is no longer growing and is being slowly reduced. It does not mean that the deficit has disappeared. The stock of housing relative to the population remains below the level that would be needed for affordability to return to its historical norm, because the deficit accumulated over many years. And the reduction of the deficit depends on population growth remaining low.
5.3 Affordability: improving, but still far from normal
Figure 3 presents the National Bank’s measure of ownership affordability.
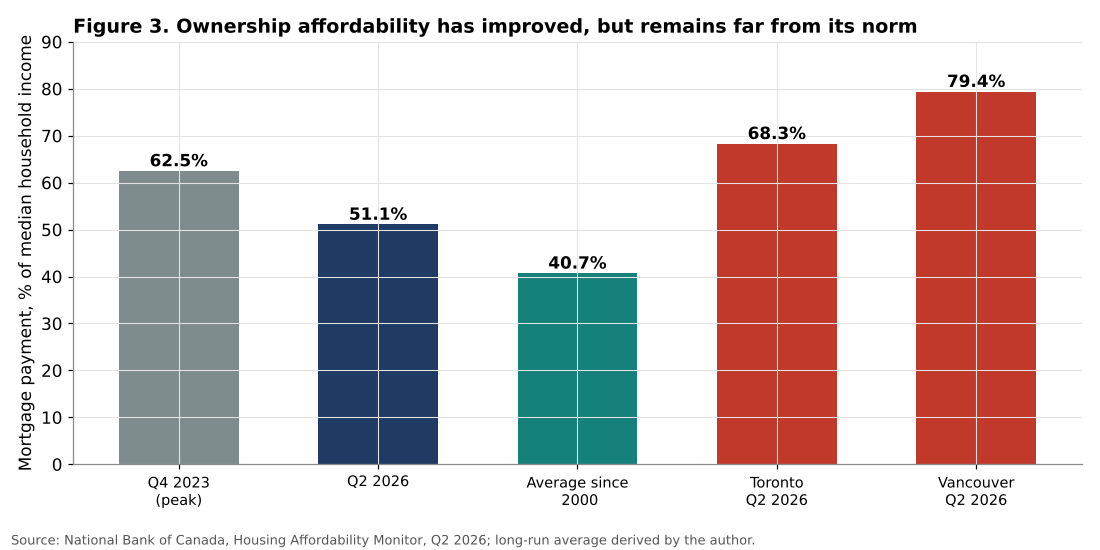
The ratio of mortgage payments to median household income for a representative home reached a peak of 62.5 percent in the fourth quarter of 2023. It has since improved for ten consecutive quarters, a record, falling to 51.1 percent in the second quarter of 2026, its best level in about four years. The improvement comes mainly from falling prices and rising incomes, since mortgage rates have changed little over the past year.
Despite this improvement, affordability remains much worse than its historical norm. The current ratio is 10.4 points above its average since 2000, which the author estimates at about 40.7 percent. CMHC’s own measure gives a similar picture: its affordability ratio was 40.3 percent in 2019, the benchmark year it uses for its supply gap estimates.
The author calculates the adjustment that would be needed to return to the long-run average:
- At constant mortgage rates and incomes, prices would have to fall by about 20.4 percent.
- At constant prices and rates, with household incomes growing by 3 percent per year, it would take about 7.7 years.
- If prices fell by 2 percent per year while incomes grew by 3 percent, it would take about 4.6 years.
- If prices rose by 2 percent per year, in line with inflation, while incomes grew by 3 percent, it would take about 23 years.
The situation in the largest cities is much more severe. In Toronto, mortgage payments represent 68.3 percent of median income, and in Vancouver 79.4 percent. A return to the national long-run average would require a fall in prices of about 40 percent in Toronto and almost 50 percent in Vancouver, at constant rates and incomes. These calculations show that the recent improvement, while real, is far from sufficient to restore affordability in the markets where the problem is most acute.
5.4 Rents: two years of decline
Figure 4 presents the evolution of asking rents.
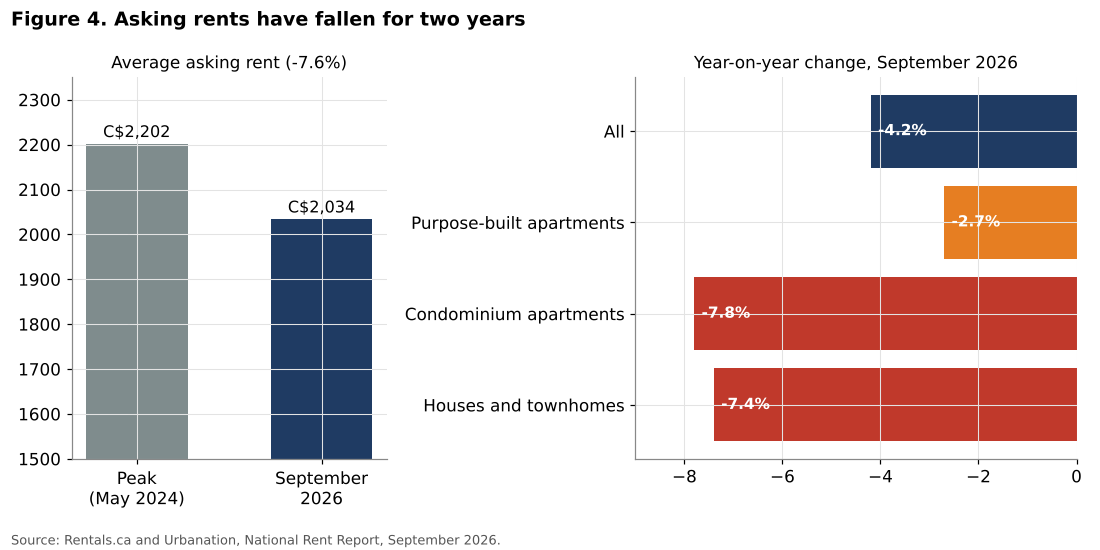
The average asking rent for all types of rental units in Canada was 2,034 dollars in September 2026, 4.2 percent lower than a year earlier and 7.6 percent below its peak of 2,202 dollars in May 2024. Asking rents have declined on an annual basis for 24 consecutive months.
The decline is uneven across property types. Rents for condominium apartments fell by 7.8 percent over the year, and those for houses and townhomes by 7.4 percent, while rents for purpose-built rental apartments fell by only 2.7 percent. The secondary rental market, consisting of condominiums and houses rented by individual investors, is more flexible and reacts faster to changes in demand. Investors who bought condominiums during the boom, often with significant leverage, have had to lower rents to find tenants as the number of students and temporary workers fell.
It is important to note that asking rents measure the rents of units advertised for rent, not the rents paid by existing tenants, which change more slowly, especially in provinces with rent control. The rent component of the consumer price index, which covers all tenants, has continued to rise, but more slowly than in 2023 and 2024.
5.5 Construction: a tale of four cities
Figure 5 shows the trend of housing starts and the change in actual starts in the four largest metropolitan areas.
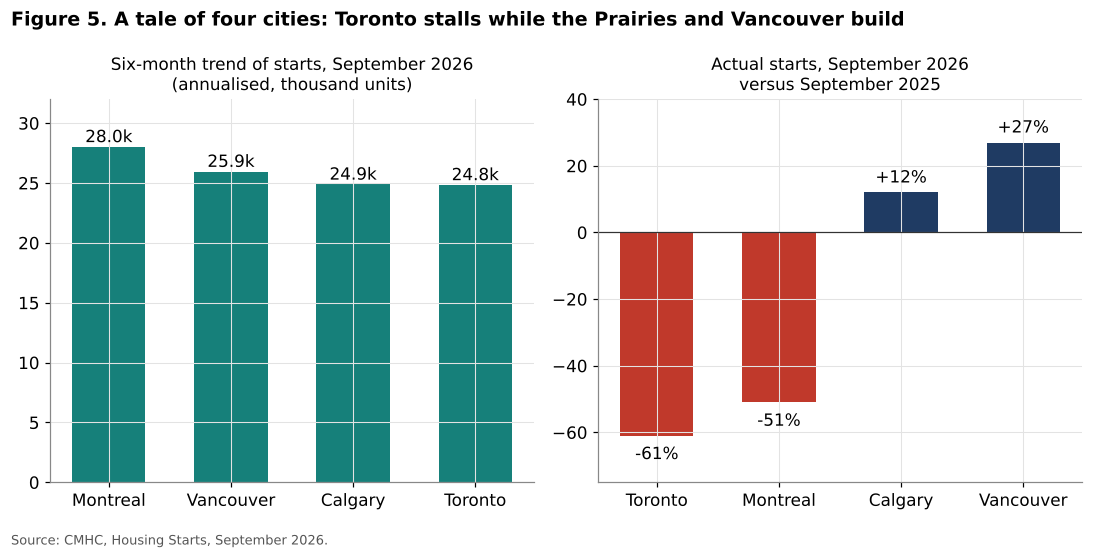
The national aggregate hides very different situations. In Toronto, actual starts in September 2026 were 61 percent lower than a year earlier, and annual starts in 2025 had already fallen by 31 percent compared with 2024. The Toronto condominium market, which financed most of the city’s new construction through presales to investors, has collapsed: investors no longer buy presale units because rents are falling and prices are lower than those paid for units now being completed. Without presales, developers cannot obtain construction financing, and new projects do not start.
In Montreal, actual starts in September 2026 were 51 percent lower than a year earlier, after a very strong year in 2025, when starts increased by 58 percent. The trend in September 2026 remained high, at about 28,000 units, but was declining.
In contrast, Calgary and Vancouver continued to build at a strong pace. In Calgary, which benefits from interprovincial migration and relatively affordable land, the trend was about 24,900 units and actual starts in September were 12 percent higher than a year earlier. In Vancouver, actual starts were 27 percent higher than a year earlier, and the trend was about 25,900 units, driven mainly by purpose-built rental projects.
The divergence between Toronto and the other large cities is one of the most important features of the current cycle. Toronto, the largest housing market in the country and the destination of a large share of immigrants, is the market where construction is falling most, which risks recreating a shortage when population growth resumes.
5.6 Two estimates of need
Figure 6 presents three scenarios of cumulative housing starts from 2026 to 2035, compared with the two official estimates of need.
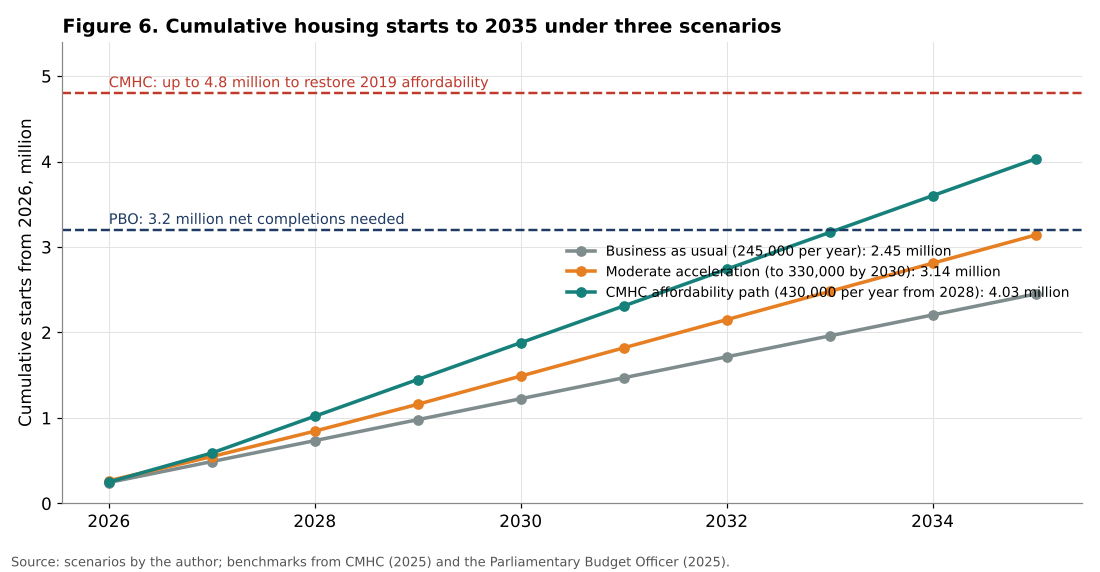
The two estimates of need differ considerably. CMHC estimates that up to 4.8 million housing units would need to be started over the next ten years to restore 2019 affordability. The PBO estimates that about 3.2 million net completions would be needed over 2025 to 2035 to close the gap between household formation and the housing stock. The difference arises from the question asked. The PBO asks how many homes are needed to house all the households that would form if housing were available. CMHC asks how many homes are needed to bring prices and rents back to the affordability of 2019, which requires a much larger supply because the price of housing is not very sensitive to the quantity supplied in the short term.
The scenarios give the following results:
| Scenario | Annual starts | Cumulative 2026 to 2035 |
|---|---|---|
| Business as usual | 245,000 | 2.45 million |
| Moderate acceleration | rising to 330,000 by 2030 | 3.14 million |
| CMHC affordability path | 430,000 from 2028 | 4.03 million |
Table 2. Cumulative housing starts under three scenarios. Source: scenarios by the author.
At the business as usual pace of about 245,000 units per year, which CMHC projects under current conditions, cumulative starts would be about 2.45 million over ten years, well below both estimates of need. A moderate acceleration to 330,000 units per year by 2030 would bring cumulative starts close to the PBO’s estimate. Even a rapid increase to 430,000 units per year from 2028 would fall short of the upper bound of CMHC’s estimate.
These results show that, even with the current reduction in population growth, the long-term supply gap cannot be closed at the current pace of construction. The PBO notes that its estimate already takes into account the reduction of immigration targets, which reduces household formation sharply in 2025 and 2026 and keeps it below its historical average until 2030.
5.7 Sales and prices: a buyers’ market without buyers
The resale market confirms the weakness of demand. According to CREA, home sales in September 2026 were 2.3 percent lower than in August and 7.7 percent lower than a year earlier. The MLS Home Price Index, which adjusts for the composition of sales, fell by 0.4 percent in the month and by 3.4 percent over the year. The national average sale price was 666,538 dollars, 1.6 percent lower than a year earlier. Active listings exceeded 200,000 at the end of September, slightly more than a year earlier.
CREA has lowered its forecast for 2026 three times. In January it expected sales to grow by 5.1 percent; in April by 1 percent; in July it expected a decline of 1.4 percent; in October a decline of 5.2 percent, to 444,530 transactions. It expects a modest recovery of 4.4 percent in 2027, with an average price of about 690,000 dollars, up 1.2 percent.
This configuration, with falling prices, abundant listings and few transactions, is typical of a market in which buyers wait for further declines while sellers are reluctant to accept lower prices. Falling prices improve affordability on paper, but they also discourage purchases by households who fear further declines, and by investors who no longer expect capital gains. The weakness of the economy under the effect of American tariffs, with unemployment between 6.5 and 7 percent, adds to the caution of potential buyers.
6. Discussion
6.1 A respite, not a resolution
The data of 2025 and 2026 show a clear improvement in the housing market from the point of view of buyers and tenants: rents are falling, prices are declining, and affordability is improving. The main driver of this improvement is not an acceleration of construction, which has remained broadly stable, but a sharp slowdown in population growth, combined with weaker economic conditions.
This distinction matters. An improvement driven by lower demand is fragile. If immigration targets are raised again, as economic or labour market needs could require, or if the economy recovers strongly, demand could rise faster than supply, and the pressure on rents and prices would return. The underlying deficit, accumulated over a decade, remains.
6.2 The paradox of falling construction
The improvement in affordability has a perverse effect on construction. Developers in Toronto and other markets dependent on presales to investors cannot launch new projects because the expected returns have fallen. Falling rents and prices reduce the profitability of new construction at a time when construction costs, including materials, labour and development charges, remain high. This is particularly true for condominium apartments, whose prices have fallen more than other types.
The result is a risk of a cyclical pattern: low population growth leads to falling rents and prices, which lead to falling construction, which creates a new shortage when population growth resumes. Breaking this cycle requires a source of construction financing that does not depend on short-term market conditions. Purpose-built rental construction supported by public financing, such as CMHC’s low-cost loan programmes, and non-market housing built by public, non-profit and cooperative organisations, can play this role. The creation of Build Canada Homes is intended to address this issue.
6.3 Productivity in construction
The cost of construction is a key constraint. Canadian construction productivity has stagnated for decades, and the industry faces labour shortages that the reduction in temporary immigration could worsen. Building 430,000 units per year, almost 70 percent more than today, would require a substantial increase in the construction workforce and in productivity, through industrialised construction methods, standardised designs and faster approval processes. This issue is linked to the broader question of Canadian productivity, examined in the next article in this series.
6.4 The role of regulation
The literature shows that land use regulations are a major determinant of housing supply. In Canada, municipalities control zoning, approve projects and set development charges, which can add tens of thousands of dollars to the cost of each new unit in large cities. The federal Housing Accelerator Fund has encouraged municipalities to allow more density, notably by permitting up to four units on residential lots in many cities. Some provinces have also reduced development charges. The impact of these reforms takes time to appear in construction data, but the experience of cities such as Calgary, which have more permissive approaches, suggests that they matter.
6.5 Mortgage renewals
A further factor will shape the market in 2026 and 2027. The Bank of Canada estimated that about 60 percent of outstanding mortgages would be renewed by the end of 2026, and that about 60 percent of these would face higher interest rates than when they were taken out, because many were taken at the very low rates of 2020 and 2021. Although the decline in rates since 2024 has reduced the shock, renewals still increase payments for many households, which weighs on consumption and may force some sales, particularly by investors.
6.6 Policy implications
Several implications follow from the analysis.
First, the current improvement in affordability should not lead governments to reduce their efforts to increase supply. The stock deficit remains large, and construction is falling in the largest market.
Second, immigration and housing policy must be coordinated. The experience of 2022 to 2024 shows the consequences of very rapid population growth without a corresponding increase in housing supply. The experience of 2025 and 2026 shows that reducing population growth rapidly relieves pressure on rents. Future immigration targets should take into account the capacity of the housing system.
Third, countercyclical support for construction is needed to prevent the collapse of construction in periods of weak demand, notably through public financing of purpose-built rental and non-market housing.
Fourth, the regional dimension is essential. National averages hide very different situations in Toronto, Vancouver, Montreal and Calgary, and policies need to be adapted to local conditions.
6.7 An international perspective
Canada is not the only advanced economy facing a housing affordability problem, but its situation is among the most severe. Australia, New Zealand and the United Kingdom also combine high population growth, restrictive land use and high price to income ratios. The Canadian experience of 2025 and 2026 is nevertheless distinctive in one respect: the speed with which a policy decision on immigration translated into a change in the rental market. Within about eighteen months of the reduction of temporary resident admissions, asking rents had fallen by more than 7 percent from their peak. This shows how much of the rental pressure of 2022 to 2024 came from the demand side, and how sensitive the market is to demographic policy. It also shows that housing supply cannot be planned independently of population policy.
7. Scenarios to 2035
7.1 Three scenarios
Scenario A: Business as usual. Housing starts remain at about 245,000 units per year. Population growth remains low until 2028, then gradually returns to about 1 percent per year as immigration targets are stabilised. Rents and prices stabilise in 2027 and then rise again as population growth resumes. Affordability improves slightly until 2028, then deteriorates. The CMHC affordability ratio would be about 52.7 percent in 2035 according to CMHC’s own projection for business as usual, compared with 40.3 percent in 2019.
Scenario B: Moderate acceleration. Reforms of zoning and development charges, public financing of rental housing and Build Canada Homes raise starts gradually to about 330,000 units per year by 2030. Cumulative starts reach about 3.1 million by 2035, close to the PBO’s estimate of need. Affordability improves gradually, but does not return to its 2019 level, particularly in Toronto and Vancouver.
Scenario C: Affordability restoration. A major national effort, comparable in scale to the post-war construction programmes, raises starts to 430,000 units per year from 2028. This scenario would require a large increase in the construction workforce, significant improvements in productivity and the active participation of all levels of government. Cumulative starts would reach about 4 million by 2035, and affordability could approach its 2019 level by the end of the decade.
7.2 Assessment
Based on the evidence of 2026, and in particular the fall in construction in Toronto and Montreal, the author considers that scenario A is the most likely in the short term, and that scenario B is possible if current reforms are maintained and strengthened. Scenario C appears unlikely given the current constraints on construction labour, financing and productivity.
7.3 Indicators to monitor
1. The six-month trend of housing starts published monthly by CMHC, and particularly the trend in Toronto. 2. Quarterly population growth published by Statistics Canada, and the number of non-permanent residents. 3. Asking rents and vacancy rates, particularly for purpose-built rental units. 4. The National Bank’s affordability ratio. 5. The share of rental and non-market housing in starts.
8. Conclusion
This article has examined the Canadian housing market in 2026 using official data and the author’s own calculations. Its main conclusions are:
1. Housing starts reached 259,028 units in 2025 and are running at about 250,000 units in 2026, about 60 percent of the level CMHC estimates is needed to restore 2019 affordability. 2. The collapse of population growth, from 2.8 percent to 0.5 percent in two years, has reversed the balance between new supply and new demand: housing starts now exceed the households implied by population growth by a factor of more than three. 3. Rents have fallen for 24 consecutive months, and ownership affordability has improved for ten consecutive quarters, but mortgage payments still absorb 51 percent of median income, about 10 points above the long-run average. A return to the average would require a fall in prices of about 20 percent at constant rates and incomes, or about 8 years of income growth at 3 percent with flat prices. 4. Construction is collapsing in Toronto and falling in Montreal, while Calgary and Vancouver continue to build strongly. 5. Even with lower population growth, the long-term supply gap cannot be closed at the current pace of construction.
Canada has obtained a respite in its housing crisis, thanks mainly to a sharp reduction in population growth. This respite offers an opportunity to rebuild the supply capacity of the housing system without the pressure of rapidly rising demand. But it also carries a risk: if construction falls further because of weak market conditions, the shortage will return as soon as population growth resumes. The challenge for Canadian housing policy is to use the respite to increase supply durably, rather than to treat it as a solution.
Need this analysis for your organisation?
We prepare confidential briefings, executive talks and studies on countries, markets and policies, built on the same method as this article.
Request a briefingSupport independent analysis
Our studies are free to read and carry no advertising. If this one was useful, a small contribution helps us publish the next.
Support our workGo further: books by Global Strategy Files


Frequently asked questions
Why are rents falling in Canada in 2026?
Mainly because population growth collapsed, from 2.8 percent in 2023 to 2024 to 0.5 percent in 2025 to 2026. Housing starts now exceed the new households implied by population growth by a factor of more than three, so asking rents have fallen for two consecutive years.
Is Canada building enough homes?
No. Housing starts reached 259,028 units in 2025 and are running at about 250,000 in 2026, roughly 60 percent of the 430,000 units a year that CMHC estimates are needed to restore 2019 affordability. Construction has not accelerated even though rents and prices are falling.
How unaffordable is housing in Canada in 2026?
Mortgage payments still absorb 51.1 percent of median household income, against a long-run average of about 41 percent. Returning to that average would require a price fall of about 20 percent at constant rates and incomes, or about eight years of 3 percent income growth with flat prices.
Where is housing construction slowing in Canada?
The construction slowdown is highly concentrated in Toronto and Montreal, while Calgary and Vancouver continue to build at a strong pace, according to CMHC data analysed in the article. Nationally, starts are running at a trend of about 250,000 units in 2026, roughly 60 percent of estimated needs.
Methodological note
All calculations were carried out by the author using data from CMHC (housing starts, supply gap update), Statistics Canada (population estimates), CREA (sales and prices), the National Bank of Canada (Housing Affordability Monitor, Q2 2026), Rentals.ca and Urbanation (National Rent Report, September 2026) and the Parliamentary Budget Officer (2025). Absolute population growth for 2023 to 2024 and 2024 to 2025 is derived from published growth rates and is approximate. The household size of 2.4 persons is an assumption. The long-run affordability average of about 40.7 percent is derived from the National Bank’s statement that the current ratio is 10.4 points above its average since 2000. The years needed to restore affordability are calculated as the logarithm of the ratio of the current to the target affordability divided by the logarithm of the ratio of income growth to price growth. The scenarios are illustrative.
References
Been, V., Ellen, I. G. and O’Regan, K. (2019). Supply Skepticism: Housing Supply and Affordability. Housing Policy Debate, 29(1), 25 to 40.
Canada Mortgage and Housing Corporation (2022). Canada’s Housing Supply Shortages: Estimating What Is Needed to Solve Canada’s Housing Affordability Crisis by 2030. Ottawa.
Canada Mortgage and Housing Corporation (2025). Canada’s Housing Supply Shortages: 2025 Update. Ottawa.
Canada Mortgage and Housing Corporation (2026). Housing Starts, December 2025 and September 2026. Ottawa.
Canadian Real Estate Association (2026). National Housing Statistics, September 2026, and Forecast Update. Ottawa.
Glaeser, E. and Gyourko, J. (2018). The Economic Implications of Housing Supply. Journal of Economic Perspectives, 32(1), 3 to 30.
Hsieh, C.-T. and Moretti, E. (2019). Housing Constraints and Spatial Misallocation. American Economic Journal: Macroeconomics, 11(2), 1 to 39.
Immigration, Refugees and Citizenship Canada (2025). Immigration Levels Plan 2026 to 2028. Ottawa.
National Bank of Canada (2026). Housing Affordability Monitor, Second Quarter 2026. Montreal.
Office of the Parliamentary Budget Officer (2025). Household Formation and the Housing Stock: Estimating the Housing Gap in 2035. Ottawa, 26 August 2025.
Rentals.ca and Urbanation (2026). National Rent Report, September 2026. Toronto.
Saiz, A. (2010). The Geographic Determinants of Housing Supply. Quarterly Journal of Economics, 125(3), 1253 to 1296.
Statistics Canada (2026). Canada’s Population Estimates, Second Quarter 2026. The Daily. Ottawa.
