
China’s AI Export Boom: New Engine or Deeper Dependence?

China’s AI Export Boom: A New Industrial Engine or a Deeper Dependence on Foreign Demand?
Driss EFFINA, PhD
Independent Researcher, Global Strategy Files
Reading time: 26 minutes
Key takeaways
- China's exports rose 36.3 percent in September 2026 to 447 billion dollars, and the trade surplus reached 938 billion dollars in nine months.
- Between 2019 and 2025, AI-related electronics contributed only 10 percent of the 1.28 trillion dollar increase in Chinese exports.
- In September 2026 chip export values rose 136 percent while volumes rose only 1 percent, a price windfall driven by the global memory shortage.
- China remains a net chip importer, with a 223 billion dollar deficit in 2025, although exports now cover 48 percent of imports.
Abstract
In September 2026, China’s exports rose by 36.3 percent year on year to 447 billion dollars, and its trade surplus reached 133.5 billion dollars in a single month. Over the first nine months of the year the surplus reached 938 billion dollars, on course to exceed the record of about 1.2 trillion dollars set in 2025. Much of the commentary attributes this surge to the global artificial intelligence boom, which has created exceptional demand for chips, servers and components. This paper tests that narrative with China’s own trade statistics, as reported to UN Comtrade for 2019 to 2025, combined with customs data for 2026 and IMF macroeconomic data. Five findings emerge. First, between 2019 and 2025 AI-related electronics (computers, computer parts, integrated circuits, telecommunications equipment, power supplies and semiconductor equipment) contributed only 10 percent of the 1.28 trillion dollar increase in Chinese exports; their share of total exports actually fell from 21.5 to 17.8 percent. Second, in 2026 the picture changes abruptly: integrated circuits alone account for about 32 percent of the growth of exports in January to September, by my estimate. Third, this surge is almost entirely a price effect: in September 2026, the value of chip exports rose by 136 percent while volumes rose by only 1 percent, implying a 134 percent rise in unit prices driven by the global memory shortage. Fourth, China remains a structural net importer of integrated circuits, with a deficit of 223 billion dollars in 2025, although exports now cover 48 percent of imports compared with 33 percent in 2019; China also imported 50 billion dollars of semiconductor manufacturing equipment in 2025. Fifth, 87 percent of China’s chip exports go to Asian assembly hubs, and the surplus has more than doubled relative to world GDP since 2019, from 0.47 to 1.01 percent. Finally, because China imports more chips than it exports and the price boom affects both flows, the chip surge has not widened the overall surplus; by my estimate the chip deficit even grew slightly in 2026. The AI boom is therefore less a new industrial engine than a powerful but cyclical price windfall that deepens China’s exposure to external demand and to trade tensions.
Keywords: China, exports, artificial intelligence, integrated circuits, semiconductors, trade surplus, global value chains, trade tensions, memory prices.
1. Introduction
China’s export performance in 2026 has surprised almost every forecaster. After the record surplus of 2025, many expected the combination of United States tariffs, European Union trade defence measures and slowing global growth to reduce Chinese exports. Instead, exports accelerated through the year, reaching growth rates of 25 percent in August and 36.3 percent in September. Imports also rose strongly, by 31 percent in September, to a record 313.7 billion dollars. According to the General Administration of Customs, total trade in the first nine months reached 39.94 trillion yuan, 18.8 percent more than a year earlier, the fastest pace for this period in nearly five years.
The dominant explanation is artificial intelligence. Integrated circuit exports reached 45 billion dollars in September 2026, 136 percent more than a year earlier, and nearly 302 billion dollars over the first nine months, up 108 percent. Exports of automatic data processing equipment rose by 54.6 percent over the same period. The Financial Times summarised the phenomenon as an export surge driven by AI-related shipments.
This raises a question with large economic and geopolitical consequences: are AI-related exports a new industrial engine for China, capable of sustaining growth as the property sector contracts, or do they represent an increased dependence on external markets, with the risk of exacerbating trade tensions as the surplus widens?
Answering this question requires separating three things that are often confused: the long-term structure of Chinese exports, the specific dynamics of 2026, and the role of prices versus volumes. This paper does so with China’s own trade data and transparent calculations. It does not rely on the interpretations of other commentators but on direct measurement.
The paper is organised as follows. Section 2 sets out the context. Section 3 reviews the literature. Section 4 describes the data and methods. Section 5 presents the results. Section 6 discusses the implications, Section 7 presents scenarios, and Section 8 concludes.
2. Context: an economy leaning on exports
China’s domestic economy remains weak. The property sector has been contracting for several years, household consumption is subdued and consumer prices are close to zero growth: the IMF estimates consumer price inflation at 0.0 percent in 2025 and projects 1.0 percent in 2026. In this environment, external demand has become a central support of growth. The IMF projects real growth of 4.5 percent in 2026, at the bottom of Beijing’s target range of 4.5 to 5 percent, and estimates China’s current account surplus at 3.7 percent of GDP in 2025 and 4.0 percent in 2026.
At the same time, China’s trading partners are reacting. The United States launched an investigation into excess industrial capacity in China and other partners in 2026, even as Washington and Beijing extended their trade truce and agreed to cut tariffs on 60 billion dollars of goods. The European Union, whose trade deficit with China exceeds 1.1 billion dollars a day, concluded an understanding with Beijing that is expected to halve Chinese hybrid car imports into the EU over the next few years. Analysts at BNP Paribas have noted that European efforts to rebalance trade “directly target high-value exports”, and Conference Board economist Max Zenglein has warned that a slowdown in global AI investment could hurt Chinese exports more than foreign trade restrictions.
The AI boom itself has a specific character in 2026. The global build-out of data centres has created a shortage of memory chips, pushing up prices sharply. Chinese producers, who have expanded their capacity in memory and mature-node chips in recent years, benefit directly from these prices.
3. Literature review
Three bodies of research frame the analysis.
The first concerns global value chains. Baldwin and Lopez-Gonzalez (2015) showed how manufacturing became organised around regional “factories”, with Asia forming one of the three major hubs. In electronics, components travel several times between countries before final assembly. This means that gross export values can be misleading about where value is created and about who the final customer is. Koopman, Wang and Wei (2014) developed methods to decompose gross exports into domestic and foreign value added, showing that China’s domestic value added share in exports was historically low in electronics but has risen over time.
The second concerns China’s trade surplus and its global consequences. The “China shock” literature (Autor, Dorn and Hanson, 2013) documented the effects of Chinese import competition on manufacturing employment in the United States. More recent work examines whether China’s continuing surpluses reflect excess saving and weak domestic demand, an argument frequently made by the IMF in its external sector assessments.
The third concerns semiconductor markets and their cyclicality. Memory chip markets are known for strong price cycles, driven by capacity investment and demand shocks. Periods of shortage lead to sharp price increases, which raise the value of trade without corresponding changes in volume. This distinction is central to this paper.
4. Data and methodology
4.1 Data
- China’s trade by product and partner, 2019 to 2025: UN Comtrade, data reported by China, annual values in US dollars, total and for selected Harmonized System codes: 8471 (computers and servers), 8473 (computer parts), 8542 (integrated circuits), 8517 (telephones and telecommunications equipment), 8504 (transformers and power supplies), 8486 (semiconductor manufacturing equipment), 8541 (diodes, transistors and photovoltaic cells), 8507 (batteries), 8703 (cars) and 2709 (crude oil, imports). Exports by destination for sixteen partners.
- China’s trade in 2026: General Administration of Customs data as reported by the Global Times, Mysteel, the South China Morning Post, Caixin, Trading Economics and the Associated Press: exports and imports in yuan for January to September, monthly figures for September, integrated circuit export values and volumes, and the surplus.
- Macroeconomic data: IMF World Economic Outlook database (GDP in US dollars for China and the world, current account balances, growth, inflation).
Data were collected on 18 October 2026.
4.2 Methods
Definition of AI-related exports. I define AI-related electronics as the sum of codes 8471, 8473, 8542, 8517, 8504 and 8486. This is a broad definition that captures servers, components, chips, networking equipment and power supplies used in data centres, though it also includes consumer electronics. For comparison, I define green exports as cars (8703), batteries (8507) and photovoltaic and semiconductor devices (8541).
Contribution analysis. I compute the change in exports between 2019 and 2025 and attribute it to AI-related, green and other products.
2026 estimate. Customs data for 2026 are available in yuan for total exports and in dollars for integrated circuits. I convert integrated circuit exports into yuan using the exchange rate implied by the reported yuan and dollar values of the surplus (about 6.89 yuan per dollar), then estimate the share of integrated circuits in the growth of exports over January to September.
Price and volume decomposition. Using reported values and unit volumes of integrated circuit exports, I compute the implied change in average unit value.
Trade balance in chips. I compute exports, imports, net balance and the export to import coverage ratio for integrated circuits.
Destinations and concentration. I compute the shares of partners in China’s exports of integrated circuits and computers, and the Herfindahl index of concentration.
Limitations. Gross trade values do not measure value added. Product codes are broad. The 2026 estimates rely on press reports of customs data and a derived exchange rate. Unit values aggregate very different chips and are only an indicator of price trends. The results are presented as orders of magnitude.
5. Results
5.1 A record surplus
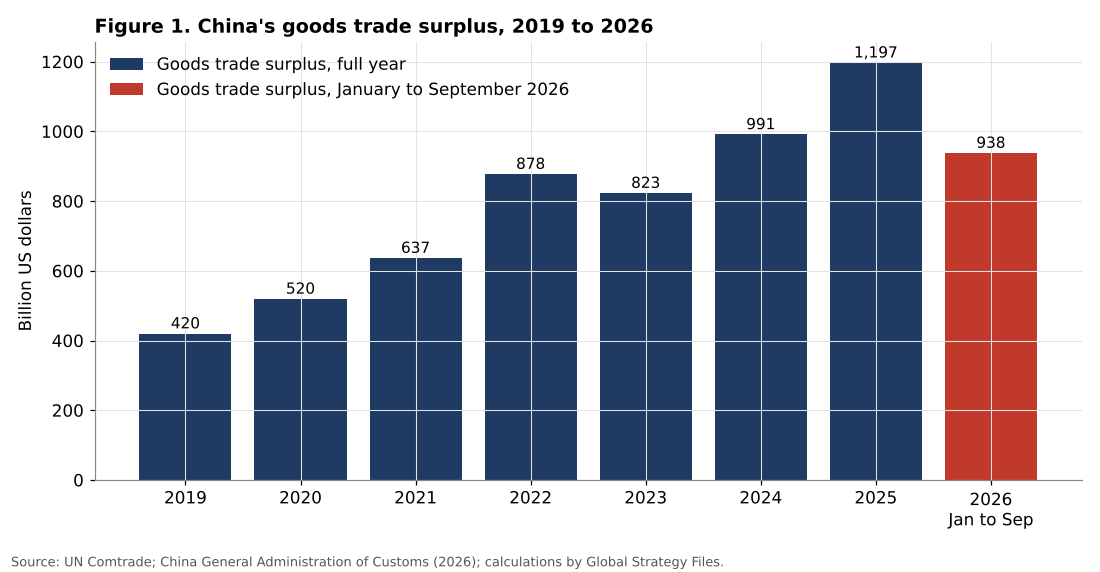
China’s goods trade surplus, as reported to UN Comtrade, rose from 420 billion dollars in 2019 to 637 billion in 2021, 878 billion in 2022, 823 billion in 2023, 991 billion in 2024 and 1,197 billion in 2025. In the first nine months of 2026 it reached 938 billion dollars, which puts the full year on course for a new record.
Table 1. China’s goods trade (billion US dollars)
| Year | Exports | Imports | Surplus | Surplus, % of China’s GDP | Surplus, % of world GDP |
|---|---|---|---|---|---|
| 2019 | 2,499 | 2,079 | 420 | 2.9 | 0.47 |
| 2021 | 3,316 | 2,679 | 637 | 3.5 | 0.65 |
| 2023 | 3,380 | 2,557 | 823 | 4.5 | 0.77 |
| 2024 | 3,577 | 2,585 | 991 | 5.2 | 0.89 |
| 2025 | 3,776 | 2,579 | 1,197 | 6.1 | 1.01 |
Source: UN Comtrade (China-reported trade); IMF World Economic Outlook for GDP; calculations by the author.
The most striking feature of Table 1 is the stagnation of imports. Between 2021 and 2025, exports rose by 460 billion dollars while imports fell slightly. The surplus has more than doubled relative to world GDP, from 0.47 percent to 1.01 percent, and relative to China’s own GDP from 2.9 to 6.1 percent. A surplus of this size, equal to one percent of global output, inevitably becomes a source of friction with trading partners.
5.2 Until 2025, AI was not the engine
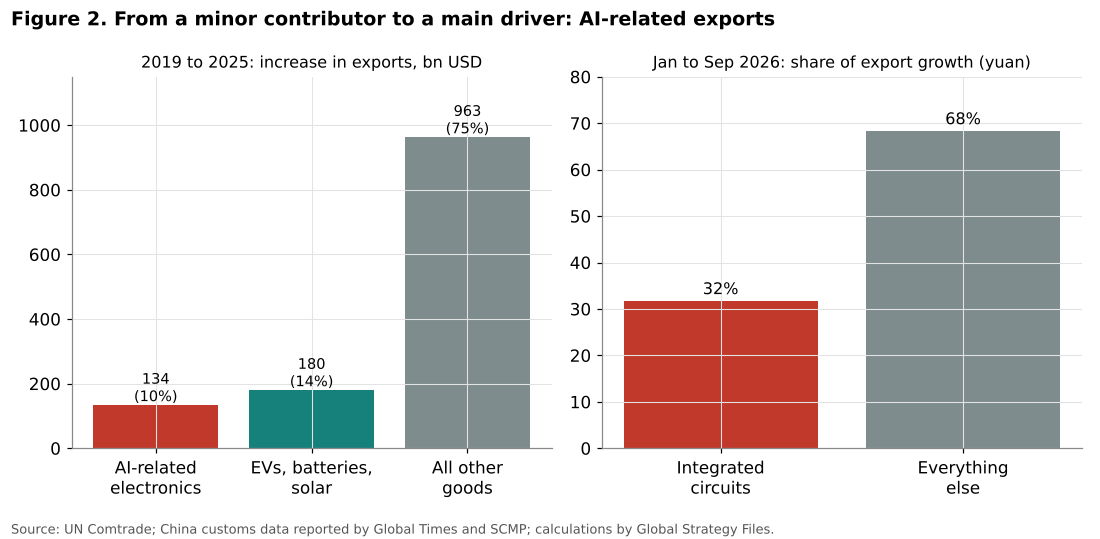
How much of the export growth between 2019 and 2025 came from AI-related products? The answer is surprising.
Table 2. Contributions to the increase in China’s exports, 2019 to 2025
| Category | Exports 2019 (bn USD) | Exports 2025 (bn USD) | Increase (bn USD) | Share of total increase |
|---|---|---|---|---|
| AI-related electronics (8471, 8473, 8542, 8517, 8504, 8486) | 536.8 | 670.8 | 134.0 | 10.5% |
| of which integrated circuits (8542) | 102.1 | 202.7 | 100.6 | 7.9% |
| of which computers and servers (8471) | 148.4 | 150.7 | 2.3 | 0.2% |
| Green products (8703, 8507, 8541) | 60.1 | 240.1 | 180.1 | 14.1% |
| All other goods | 1,902.3 | 2,865.4 | 963.1 | 75.4% |
| Total | 2,499.2 | 3,776.4 | 1,277.2 | 100% |
Source: UN Comtrade; calculations by the author.
Over six years, AI-related electronics contributed only 134 billion dollars, or 10.5 percent, of the increase in exports. Their share in total exports fell from 21.5 percent in 2019 to 17.8 percent in 2025. Exports of computers and servers were almost exactly the same in 2025 as in 2019 (151 against 148 billion dollars), after a peak of 204 billion in 2021. Green products contributed more than AI (14.1 percent), led by cars, whose exports rose from 8.6 to 110.4 billion dollars, and batteries, from 16.9 to 82.1 billion. But three quarters of the growth came from the broad range of other manufactured goods.
This result matters. It shows that the strength of Chinese exports up to 2025 was not driven by a single sector but by broad-based competitiveness across manufacturing, supported by a weak currency, low domestic prices and excess capacity. AI-related products were, until 2025, a declining share of the export mix.
5.3 In 2026, chips become a main driver
The situation changed in 2026. According to customs data, exports in January to September 2026 reached 23.2 trillion yuan, 16.4 percent more than a year earlier, while integrated circuit exports reached nearly 302 billion dollars, up 108 percent in dollars and 99.1 percent in yuan.
Using the exchange rate implied by the reported surplus (about 6.89 yuan per dollar), integrated circuit exports amount to about 2.08 trillion yuan, or 9.0 percent of total exports, compared with 5.4 percent for the full year 2025. Their increase over a year is about 1.04 trillion yuan, while the increase in total exports is about 3.27 trillion yuan. Integrated circuits alone therefore account for about 32 percent of the growth of Chinese exports in the first nine months of 2026.
Adding other AI-related products, whose growth was also strong (automatic data processing equipment up 54.6 percent according to customs figures reported by the Associated Press, and computer parts more than doubling), the share of AI-related electronics in 2026 export growth is likely above 40 percent. In a single year, AI has gone from a minor contributor to the main driver of Chinese export growth.
5.4 A price boom, not a volume boom
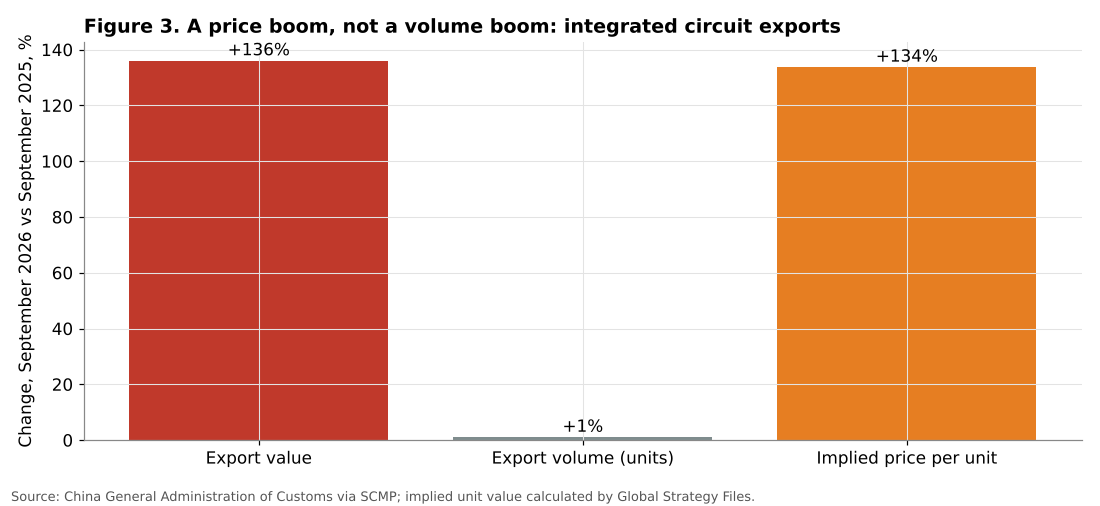
The nature of this growth becomes clear when values are compared with volumes. In September 2026, China exported 32.7 billion integrated circuits, only 1 percent more than in September 2025. The value of these exports, however, rose by 136 percent. The implied average price per unit therefore rose by about 134 percent in one year. Over January to September 2026, the average value was about 1.10 dollars per unit, and in September about 1.38 dollars. Customs data also indicate that chip export volumes fell by 7.8 percent in August.
This is a decisive finding. China is not shipping many more chips; it is shipping roughly the same number at much higher prices. The driver is the global shortage of memory chips caused by the construction of AI data centres. Chinese memory and mature-node producers are price takers in a market where prices have more than doubled.
Price-driven export booms have two characteristics. They raise export revenue and profits quickly, which supports domestic producers and the trade surplus. But they are reversible: when new capacity comes on line globally or AI investment slows, prices fall and export values fall with them, even if volumes are maintained. The history of memory markets is full of such cycles.
5.5 Still a net importer of chips
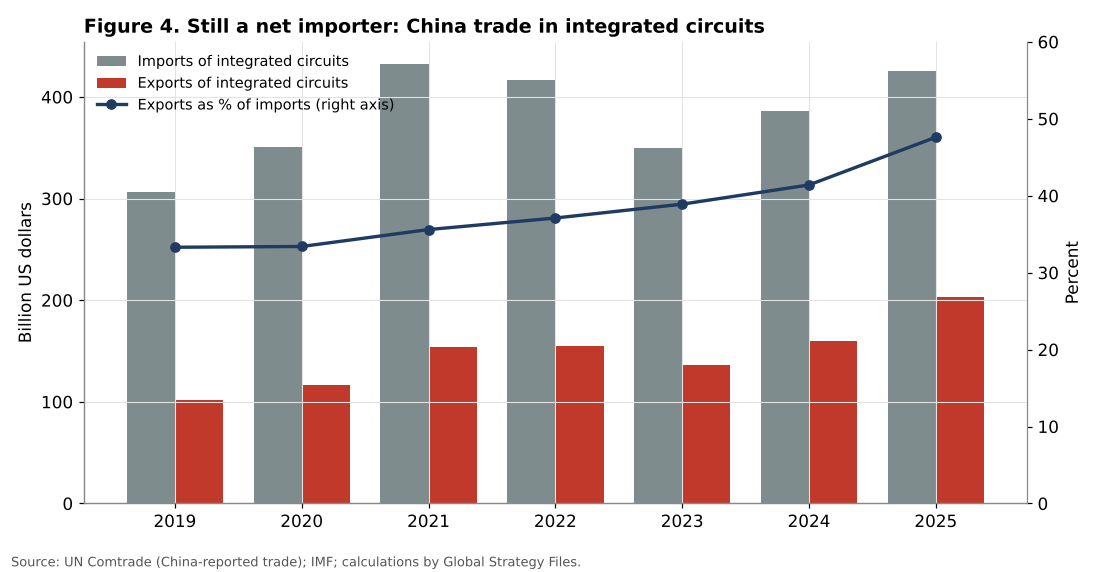
Despite the export surge, China remains a large net importer of integrated circuits.
Table 3. China’s trade in integrated circuits and semiconductor equipment (billion US dollars)
| Year | IC exports | IC imports | IC balance | Exports as % of imports | Imports of semiconductor equipment (8486) |
|---|---|---|---|---|---|
| 2019 | 102.1 | 306.4 | -204.3 | 33.3 | 26.4 |
| 2021 | 154.2 | 432.6 | -278.4 | 35.6 | 41.0 |
| 2023 | 136.3 | 350.1 | -213.8 | 38.9 | 39.6 |
| 2024 | 159.7 | 386.1 | -226.4 | 41.4 | 47.1 |
| 2025 | 202.7 | 425.4 | -222.7 | 47.6 | 50.3 |
Source: UN Comtrade (China-reported trade); calculations by the author.
Two trends coexist. On one hand, China’s self-sufficiency in chip trade has improved steadily: exports now cover 47.6 percent of imports, compared with 33.3 percent in 2019. On the other hand, the absolute deficit remains around 220 billion dollars, a sum comparable to China’s crude oil import bill of 295 billion dollars in 2025. China also imports large and rising amounts of semiconductor manufacturing equipment, 50.3 billion dollars in 2025 against exports of only 5.7 billion.
The 2026 data suggest that this pattern continues. According to customs data reported by the press, integrated circuit imports rose by 56.6 percent in January to September 2026 and memory imports by 150 percent. If imports in January to September 2025 represented about three quarters of the annual total, as is typical, the implied value of imports in 2026 would be around 495 billion dollars for nine months, against exports of 302 billion. The coverage ratio would rise to about 60 percent, but the deficit would remain close to 200 billion dollars. China benefits from the AI boom as both exporter and importer: it buys advanced chips and sells mature and memory chips, and the price boom raises both sides of the account.
This finding qualifies the idea of a new “industrial engine”. China’s chip industry is growing and gaining ground, but it remains embedded in a global chain in which the most advanced chips and the equipment to produce them are still largely imported.
5.6 Where the chips go: Asian assembly hubs
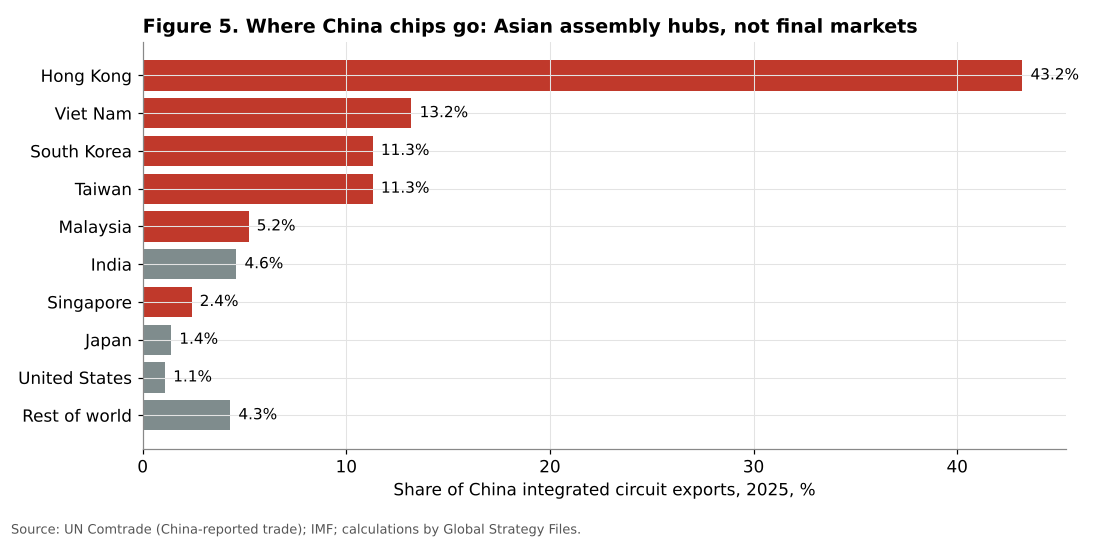
Table 4. Destinations of China’s integrated circuit exports (share of total, %)
| Destination | 2019 | 2025 |
|---|---|---|
| Hong Kong | 40.6 | 43.2 |
| Viet Nam | 9.7 | 13.2 |
| South Korea | 15.0 | 11.3 |
| Taiwan | 14.0 | 11.3 |
| Malaysia | 6.1 | 5.2 |
| India | 2.2 | 4.6 |
| Singapore | 3.7 | 2.4 |
| Japan | 1.8 | 1.4 |
| United States | 0.9 | 1.1 |
Source: UN Comtrade; calculations by the author.
Six Asian economies (Hong Kong, Viet Nam, South Korea, Taiwan, Malaysia and Singapore) absorbed 86.6 percent of China’s chip exports in 2025. Only 1.1 percent went directly to the United States. Hong Kong alone took 43 percent, largely for re-export. Viet Nam’s share rose from 9.7 to 13.2 percent, reflecting the relocation of electronics assembly from China to Viet Nam. The concentration index (Herfindahl) of chip export destinations rose slightly, from about 2,240 to 2,370.
The final demand for these chips, however, lies largely in the data centres of the United States and other advanced economies. Chinese chips are assembled into modules, servers and devices in Asia, then shipped to their final markets. China’s dependence on external demand is therefore indirect but real: a slowdown of AI investment in the United States would reduce demand throughout the Asian chain and, ultimately, for Chinese components.
The same pattern of indirect exposure appears in computers. The share of the United States in China’s exports of computers and servers (8471) fell from 29.4 percent in 2019 to 15.3 percent in 2025, while the value of direct exports to the United States halved from 43.7 to 23.0 billion dollars. Part of this trade has been rerouted through third countries.
5.7 Rerouting rather than decoupling
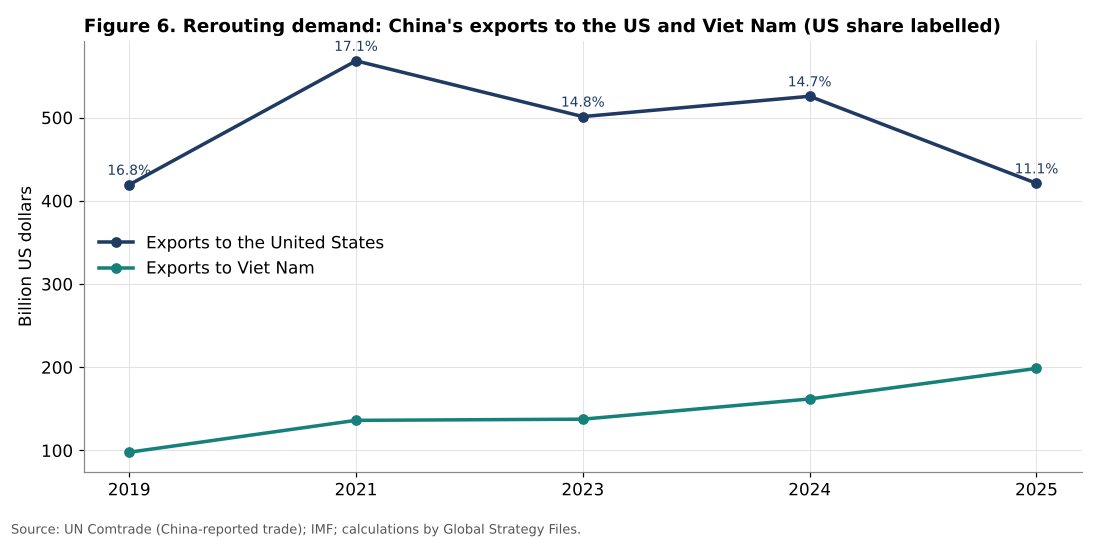
The broader trade data confirm this rerouting. China’s total exports to the United States fell from 525.6 billion dollars in 2024 to 421.0 billion in 2025, and their share in China’s total exports from 16.8 percent in 2019 to 11.1 percent in 2025. At the same time, exports to Viet Nam doubled, from 97.9 billion dollars in 2019 to 198.6 billion in 2025, and exports of integrated circuits to Viet Nam nearly tripled, from 9.9 to 26.7 billion dollars.
These figures show that tariffs have changed the geography of Chinese exports more than their volume. Chinese components increasingly reach American consumers and data centres through assembly in Viet Nam, Malaysia, Mexico and other countries. This makes the bilateral surplus with the United States a less accurate measure of China’s exposure, and it explains why trading partners in Europe and elsewhere increasingly focus on China’s global surplus rather than on bilateral balances.
5.8 The net effect of the chip boom on the surplus
A last calculation puts the chip boom in perspective. It is tempting to conclude that the surge in chip exports explains the rise of China’s surplus in 2026. The data suggest otherwise.
Integrated circuit exports in January to September 2026 were about 302 billion dollars, up 108 percent, which implies about 145 billion dollars in the same period of 2025 and an increase of about 157 billion dollars. On the import side, customs data show an increase of 56.6 percent. Assuming, as in Section 5.5, that imports in January to September 2025 were about three quarters of the 2025 total of 425 billion dollars, or about 316 billion, imports in the same period of 2026 would be about 495 billion, an increase of about 179 billion dollars.
Table 5. Estimated chip trade, January to September (billion US dollars)
| 2025 (estimate) | 2026 (estimate) | Change | |
|---|---|---|---|
| Integrated circuit exports | 145 | 302 | +157 |
| Integrated circuit imports | 316 | 495 | +179 |
| Integrated circuit balance | -171 | -193 | -22 |
Source: China customs data reported by the press; UN Comtrade for 2025 annual imports; estimates by the author.
On these estimates, the chip boom has not increased China’s trade surplus at all; it has slightly widened the deficit in chips. The reason is that the memory shortage raises the prices China pays for imported chips as well as the prices it receives for its exports, and China still imports more chips than it exports. The increase in the overall surplus in 2026 must therefore come from other products, such as cars (exports up 54 percent over January to September), electric vehicles, batteries and the broad range of manufactured goods.
This result reinforces the main conclusion of the paper. The AI boom is a major driver of the growth of China’s gross exports in 2026, but it is not the main source of the widening surplus. The surplus, which is what concerns China’s trading partners most, reflects the broader competitiveness of Chinese manufacturing and the weakness of domestic demand.
6. Discussion
6.1 New engine or price windfall?
The results support a nuanced answer to the research question.
AI-related exports are a real and growing part of China’s industrial structure. China’s chip exports doubled between 2019 and 2025 even before the price boom, and its self-sufficiency ratio in chip trade improved by 14 percentage points. Chinese firms have built competitive positions in mature-node chips, memory, power electronics and components for servers.
But the 2026 surge is predominantly a price phenomenon. Volumes of chip exports are flat; prices have more than doubled. A price windfall can disappear as quickly as it appeared. If the memory cycle turns, the 32 percent contribution of chips to export growth could become a negative contribution in 2027.
Moreover, until 2025 the main sources of China’s export strength were elsewhere: in cars, batteries and the broad range of manufactured goods. The AI boom has added a powerful but cyclical layer on top of this structural competitiveness.
6.2 Increased dependence on external markets
The analysis also shows that the AI boom increases China’s dependence on external demand in three ways.
First, it adds to a surplus that already equals 1 percent of world GDP. Each additional dollar of exports without a corresponding increase in imports adds to the imbalance that partners are trying to reduce.
Second, the final demand for AI-related exports depends heavily on the investment decisions of a small number of large technology firms in the United States and other advanced economies. This is a concentrated and volatile source of demand.
Third, the AI chain runs through Asian hubs whose own trade relations with the United States are under scrutiny. Tighter rules of origin or tariffs on transhipment would affect Chinese components indirectly.
6.3 The tension with trading partners
The widening surplus is already producing reactions. The EU-China understanding on hybrid cars, the US investigation into excess capacity and the EU’s focus on high-value exports all point to an environment in which further surplus growth will meet resistance. The AI boom complicates this picture. Because AI-related goods are critical inputs for Western data centres, partners may be reluctant to restrict them, which gives China some leverage. But it also makes these goods a natural target for national security measures, as the history of export controls on advanced chips shows.
6.4 Policy implications for China
For Chinese policymakers, the analysis suggests that the AI boom should be treated as a temporary windfall rather than a substitute for domestic demand. Using the revenue from high chip prices to invest in capacity and technology is rational, but relying on exports to compensate for weak consumption and the property downturn increases vulnerability. The more sustainable path, often recommended by the IMF, is to raise household consumption through social spending and income support, which would reduce the surplus and the associated tensions.
6.5 Lessons from earlier memory cycles
Memory chip markets have gone through several boom and bust cycles. The most recent comparable episode occurred in 2017 and 2018, when strong demand from data centres and smartphones pushed memory prices to record levels and lifted the exports of the main producers, notably South Korea. In 2019 prices fell sharply as new capacity came on line and demand slowed, and South Korea’s semiconductor exports fell by about a quarter, dragging its total exports down. The lesson for China is direct: an export surge built on memory prices can reverse within a year, and economies that rely heavily on such exports experience large swings in growth and trade balances. China’s diversified export base makes it less vulnerable than South Korea was in 2019, but the share of chips in its export growth is now large enough for a price reversal to be felt.
7. Scenarios for 2027
Scenario A: the memory cycle turns. New memory capacity comes on line and AI investment growth moderates. Chip prices fall by 30 to 50 percent from their 2026 peak. With volumes stable, chip export values fall correspondingly, subtracting several percentage points from export growth. The surplus narrows somewhat but remains large because of other products.
Scenario B: the AI boom continues. AI investment keeps growing strongly and memory remains in short supply. Chip export values continue to rise, and the surplus reaches new records. Trade tensions intensify, with a higher risk of new tariffs, rules of origin and export controls targeting both chips and the hubs through which they pass.
Scenario C: trade restrictions tighten. Partners respond to the surplus with broader measures, including restrictions on transhipment through Viet Nam and other hubs. Chinese exports become more reliant on markets in Asia, Latin America and Africa, which, as analysts have noted, cannot fully replace Western demand.
8. Conclusion
Is the AI export boom a new industrial engine for China or a source of deeper dependence on external markets? The data point to both, but with a clear balance.
First, until 2025, AI-related electronics were not the engine of Chinese exports: they contributed only about 10 percent of export growth since 2019, and their share in exports declined.
Second, in 2026, integrated circuits alone account for about 32 percent of export growth, which makes AI the main driver of this year’s surge.
Third, this surge is a price effect, not a volume effect: chip export volumes are flat while unit values have more than doubled because of the global memory shortage.
Fourth, China remains a net importer of chips and of the equipment needed to make them, even though its coverage ratio has improved significantly.
Fifth, and contrary to a common assumption, the chip boom is not what is widening the surplus: because China still imports more chips than it exports and prices have risen on both sides, the estimated chip deficit widened slightly in 2026. The surplus reflects the broader competitiveness of Chinese manufacturing and weak domestic demand.
Finally, the boom deepens China’s exposure to external demand: its surplus now equals 1 percent of world GDP, its chips flow mainly through Asian hubs to final markets in advanced economies, and its trading partners are increasingly determined to reduce the imbalance.
The AI boom is therefore best understood as a cyclical windfall layered on top of China’s structural export competitiveness. It brings revenue and technological progress, but it does not resolve, and may aggravate, the central imbalance of the Chinese economy: weak domestic demand compensated by external surpluses.
Need this analysis for your organisation?
We prepare confidential briefings, executive talks and studies on countries, markets and policies, built on the same method as this article.
Request a briefingSupport independent analysis
Our studies are free to read and carry no advertising. If this one was useful, a small contribution helps us publish the next.
Support our workGo further: books by Global Strategy Files


Frequently asked questions
Is artificial intelligence driving China’s export boom in 2026?
Yes in 2026, but mainly through prices. Integrated circuits account for about 32 percent of China’s export growth in January to September 2026, yet in September chip export values rose 136 percent while volumes rose only 1 percent, reflecting the global memory shortage.
Is China a net exporter of semiconductors?
No. China remains a structural net importer of integrated circuits, with a deficit of 223 billion dollars in 2025, although its exports now cover 48 percent of its chip imports against 33 percent in 2019. China also imported 50 billion dollars of chip-making equipment in 2025.
How large is China’s trade surplus in 2026?
China’s trade surplus reached 133.5 billion dollars in September 2026 alone and 938 billion dollars in the first nine months, on course to exceed the 2025 record of about 1.2 trillion dollars. Relative to world GDP, the surplus has risen from 0.47 percent in 2019 to 1.01 percent.
Did the chip boom widen China’s trade surplus?
No. Because China imports more chips than it exports and prices have risen on both sides, the estimated chip deficit even widened slightly in 2026. The surplus reflects the broader competitiveness of Chinese manufacturing and weak domestic demand rather than AI electronics.
Methodological note
All calculations were performed by the author. Annual trade data are China-reported values from UN Comtrade. AI-related electronics are defined as HS codes 8471, 8473, 8542, 8517, 8504 and 8486. The 2026 contribution of integrated circuits is estimated in yuan, using the exchange rate implied by the reported surplus. Unit values are derived from customs values and volumes. Data are available from the author on request.
References
Autor, D. H., Dorn, D., and Hanson, G. H. (2013). The China syndrome: Local labor market effects of import competition in the United States. American Economic Review, 103(6), 2121 to 2168.
Baldwin, R., and Lopez-Gonzalez, J. (2015). Supply-chain trade: A portrait of global patterns and several testable hypotheses. The World Economy, 38(11), 1682 to 1721.
Associated Press. (2026). China’s exports surge 36.3% in September as pressure ramps up to rebalance trade. 14 October 2026.
Caixin Global. (2026). China’s September exports surge 36.3% amid AI boom, auto export rush. 15 October 2026.
Financial Times. (2026). China’s exports surge 36% as AI-related shipments boom. 14 October 2026.
Global Times. (2026). China’s foreign trade in the first three quarters. October 2026.
International Monetary Fund. (2026). World Economic Outlook database, accessed through the IMF DataMapper, October 2026.
Koopman, R., Wang, Z., and Wei, S.-J. (2014). Tracing value-added and double counting in gross exports. American Economic Review, 104(2), 459 to 494.
South China Morning Post. (2026). China chip exports jump 136% to US$45 billion as AI frenzy jacks up prices. October 2026.
Trading Economics. (2026). China’s trade surplus surges as exports soar on AI boom. 14 October 2026.
United Nations. (2026). UN Comtrade database, China-reported trade by product and partner, accessed October 2026.
